Time-resolved dielectric spectroscopy of phase separation process in polymer mixtures
Wun-Sian Huang(黃文賢)
, Che-Min Chou(周哲民) and Po-Da Hong (洪伯達) 國立台灣科技大學 高分子工程系E-mail: [email protected]
Abstract:
The dielectric measurement was carried out to investigate the phase separation behavior of atactic polystyrene (aPS) / 4-cyano-4’-n-octylbiphenyl (8CB) blend. The intensities increase with the increment of time due to the gradual formation of new phase during decomposition of the system. The normalized curves and the dielectric strength also present the characterization during phase separation.
Introduction:
The dynamics of polymer segment has been extensively studied, and many literatures have been proposed to investigate the origin of dynamic heterogeneity. Fischer et al. and Kumar et al. proposed the concept of concentration fluctuation to describe the nanoscale heterogeneity.1, 2 Colmenero et al. summarized the theoretical models to describe the segmental dynamics in detail.3 The idea of Physical Dimension was mentioned to discuss how the polymer segment senses the environment by Mijovic et al.4 What mentioned above are the phenomena under
microscopic region. There are still few literature proposed to explain the mesoscopic phase separation by dielectric spectra measurement. In this work, we tried to give a discussion about the time dependent dielectric spectra of mesoscopic phase separation.
Experimental Section:
The polymer matrix used in this work was secondary standard polystyrene (aPS) droplet (Mw = 288,800 g/mole, Mw/Mn = 2.2, Aldrich Chemical Co.). The blend discussed was mixed with low molecular weight thermotropic liquid crystal (4-cyano-4’-n-octylbiphenyl, 8CB) purchased from
Aldrich Chemical Co. Two components were dissolved in benzene. The blend was put at room temperature to evaporate most solvent and then maintained homogeneous state at 100 ℃. Finally, the blend was quenched by liquid nitrogen to avoid the heterogeneous effect.
The dielectric spectra measurement was generated by using the LCR meter (Agilent, HP4284A). The capacitance cell for all measurements was designed by our laboratory. The electrodes made of titanium and platinum layer were coated on it.
Result and discussion:
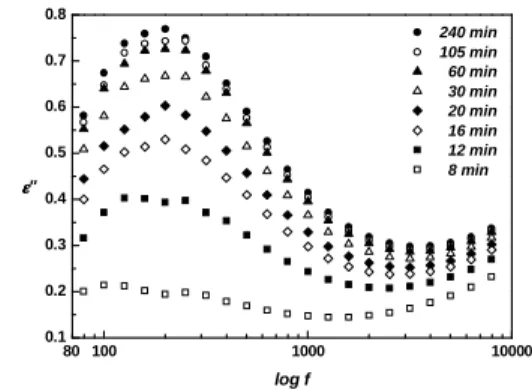
Fig. 1. shows the loss factor curves at various time after the blend (PS/8CB = 50/50) was quenched from homogeneous state (120℃) to experimental temperature (45℃). The peaks locate at low frequency are corresponding to the segment motion of polystyrene. The mechanism of in-plane rotation is observed above frequency 3000 Hz,5 but in this work we focused on discussing the relaxation behavior of PS. It is obvious that the intensity increases gradually in first 60 minutes due to the increment of the amount of new phase. After the PS/8CB blend is quenched into two phase region, the concentration fluctuation takes place and then forms two phases (PS-rich phase and 8CB-rich phase). As time goes on, the evolution of structure will give rise to the increment of correlation length. In other words, each component tends to aggregate and the amount of each rich phase becomes more. After the system reaches equilibrium concentration, the amount of each phase will not change with time. Since the existence of low molecular weigh component 8CB will plasticize the system. It seems that the peaks do not shift to lower frequency. Although the
concentration of PS increases and 8CB component is excluded in PS-rich phase, the small molecule component does not affect the relaxation time strongly. Fig. 2. shows the mater curves at different time in phase separation process. The curves for blend are narrower than one for neat PS. It indicates that small molecule component makes PS segment become more active. The curves almost overlap to form a master curve, suggesting PS segment has the same dynamic behavior with the evolution of phase separation. Fig. 3. presents the variant of dielectric strength during the process. It describes the decomposition rate is fast before 50 minutes and tends to reach constant.
Conclusions:
We have investigated the time dependent dielectric behavior of phase separation. The increment of the loss factor indicates the amount of each rich phase becomes more. The small molecule component does not affect the relaxation time but makes the distribution of relaxation time become narrow. Finally, the dynamic behavior does not change in phase separation process.
Reference:
1. Katana, G.; Fischer, E. W.; Hack, T.; Abetz, V.; Kremer, F. Macromolecules 1995, 28, 2714.
2. Kamath, S.; Colby, R. H.; Kumar, S. K.; Karatasos, K.;
Floudas, G.; Fytas, G.; Roovers, J. E. L. J. Chem. Phys.
1999, 111, 6121.
3. Colmenero, J.; Arbe, A. Soft Matter 2007, 3, 1474.
4. Mijovic, J.; Sy, J. W. Macromolecules 2000, 33, 933 5. Boussoualem, M.; Roussel, F. Phys. Rev. E 2004, 69,
031702.
100 1000 10000
0.1 0.2 0.3 0.4 0.5 0.6 0.7 0.8
240 min 105 min 60 min 30 min 20 min 16 min 12 min 8 min εεεε''
log f 80
Fig. 1. Loss factor with various times for PS/8CB (50/50) at 45℃.
1 10
0.3 0.4 0.5 0.6 0.7 0.8 0.9 1.0 1.1
εεεε"/εεεε"m
log (f/fm)
240 min 105 min 60 min 30 min 20 min 16 min neat PS
Fig. 2. Normalized curves for PS/8CB (50/50) at 45℃.
0 50 100 150 200 250
0.2 0.4 0.6 0.8 1.0 1.2 1.4
εεεε
Time (min)
Fig. 3. Variant of dielectric strength for PS/8CB (50/50) at 45℃.