Role of TGF-beta1 on Cyclosporine-induced Epithelial-to-Mesenchymal Transition in Gingival Epithelium
Martin Ming-Jen Fu,*† Yu-Tang Chin,*‡ Earl Fu,* Hsien-Chung Chiu,* Li-Yu Wang,*
Cheng-Yang Chiang,* Hsiao-Pei Tu,*§
* Department of Periodontology, School of Dentistry, National Defense Medical Center and Tri-Service General Hospital, Taipei, Taiwan, ROC
† Department of Oral Medicine, Infection, and Immunity, Harvard School of Dental Medicine, Boston, MA
‡ Institute for Cancer Biology and Drug Discovery, Taipei Medical University, Taipei, Taiwan, ROC
§ Department of Dental Hygiene, China Medical University, Taichung, Taiwan, ROC
Correspondence:
Hsiao-Pei Tu School of Dentistry
National Defense Medical Center and Tri-Service General Hospital PO Box 90048-507, Taipei, Taiwan, ROC
and
Department of Dental Hygiene, China Medical University,
91 Hsueh-Shih Road, Taichung, 40402, Taiwan, ROC
Tel: +886-2-87927150 Fax: +886-2-87927145
Email: [email protected]
Word Count: 3120
Number of Figure and Tables: 6 figures
Short Running Title: Role of TGF-β1 in Cyclosporine-induced gingival EMT
One-Sentence Summary: In gingiva, Cyclosporine could induce type 2 epithelial-to-
mesenchymal transition which is TGF-β1 dependent.
ABSTRACT
Background:
It has been proposed that cyclosporine (CsA) may induce epithelial-to-mesenchymal transition (EMT) in gingiva. The aims of the present study were to confirm the notion that EMT occurs in human gingival epithelial (hGE) cells after CsA treatment and to investigate the role of TGF-ß1 on this CsA-induced EMT.
Methods:
The effects of CsA, with and without TGF-β1 inhibitor, on the morphological changes of primary culture of hGE cells were in vitro examined. The changes of protein and mRNA expressions of two EMT markers (i.e. E-cadherin and α-SMA) in the hGE cells after CsA treatment with and without TGF-β1 inhibitor were evaluated with immunocytochemistry and real time-PCR.
Results:
The epithelial cells became spindle-like, elongated, disassociated from neighboring cells, and lost their original cobblestone monolayer pattern when CsA was added. However, the epithelial cells stayed with their original cobblestone morphology when there was a treatment of TGF-β1 inhibitor on top of the CsA treatment.
When CsA was given, the protein and mRNA expressions of E-cadherin and α-SMA were significantly altered, and these alterations were significantly reversed when there was a pretreatment of TGF-β1 inhibitor.
Conclusions:
CsA could induce type 2 EMT in gingiva by changing the morphology of epithelial cells and altering the EMT markers/effectors. The CsA-induced gingival EMT is TGF-β1 dependent or at least partially dependent.
KEY WORDS
gingiva, cyclosporine, epithelial-mesenchymal transition, transforming growth factor
beta1, E-cadherin, alpha-smooth muscle actin, smad2 protein, smad3 protein.
INTRODUCTION
Cyclosporine A (CsA) is a widely used immunosuppressant in organ transplantations, but can cause a number of significant side-effects including gingival overgrowth.
1When CsA-induced gingival overgrowth occurs, the epithelium is thickened, rete ridges are elongated, and connective tissue becomes fibrotic with an increase in fibroblasts and an accumulation of extracellular matrix.
2Several mechanisms of CsA-induced gingival overgrowth have been proposed.
3, 4However, the exact underlying mechanism is still under investigation.
Epithelial-to-mesenchymal transition (EMT) is a process where epithelial cells lose their original phenotype with a concomitant development of mesenchymal phenotype in either embryonic development,
5fibrogenesis,
6wound healing,
7or cancer metastases.
8, 9When EMT occurs in adult tissues, the phenotype of epithelium is altered by disaggregating epithelial units and reshaping for movement. The epithelial cells in EMT lose their apical-to-basal polarity, adherens junctions, tight junctions, desmosomes, epithelial markers (e.g. E-cadherin and Zonula Occludent-1).
10The original close- adhered, cuboidal epithelial cells would transform into unanchored, elongated mesenchymal, spindle-shaped, myofibroblast or fibroblast-like phenotypic cells.
10, 11The role of EMT leading to tissue fibrosis has been flourishingly noticed. Evidence has exhibited that EMT is associated with fibrosis in kidney,
11lung,
12eye,
13peritoneum,
14and probably liver.
6Recently, it has been demonstrated that E-cadherin, an EMT marker, and another
two potential/debatable EMT markers (i.e. Fibroblast Specific Protein-1 and fibronectin
extra type III domain A)
15, 16were altered in the overgrown gingiva of the patients taking
CsA.
17Disrupted basal laminar structure indicating a possible migration of epithelial cells
across the basal membrane was also observed in those CsA-induced gingival tissues.
18The possibility of EMT participating in the development of CsA-induced gingival
overgrowth was consequently proposed. On the other hand, recent studies have shown
that transforming growth factor-beta1 (TGF-β1), a commonly believed key mediator in
EMT, may not be necessarily involved in renal EMT. However, in gingiva, the role of
TGF-β1 on CsA-induced EMT has never been investigated. The available evidence of
CsA-induced EMT in gingiva is also very limited in the current literature. In this current
study, therefore, the notion of CsA-induced EMT in gingiva was further evaluated in
vitro. The aims of the present study were to examine the effects of CsA on the
morphological change of human epithelial cells, and explore the role of TGF-β1 in CsA-
induced gingival EMT by evaluating the changes of two EMT common markers after
CsA treatments with and without the suppression of TGF-β1.
MATERIALS AND METHODS
Primary Culture of Human Gingival Epithelial Cells
The primary culture of human gingival epithelial (hGE) cells in the current study was obtained from either crown lengthening or distal wedge procedure of non-inflamed periodontal tissues at the Dental Clinic of the Tri-Service General Hospital, Taipei, Taiwan. IRB approval was granted before all of the procedures and experiments. After the specimen was immersed in culture medium
‖with 2 mg/mL of cleavage supplement
¶and 10% fetal bovine serum at 4°C for 2 days, the epithelial layer was separated from the underlying connective tissue. The epithelial fragments were then digested in serum-free medium containing 0.05% trypsin–EDTA
#at 37°C in 5% CO
2for 5 minutes. The hGE cell cultures were grown in an epithelium culture media
**with calcium chloride and 1%
of growth supplement
††until 5 to 7 passages. The cells were stimulated by varied concentrations (0, 500, 800, and1,000 ng/ml) of CsA
‡‡in alcohol (as a solvent) for 48 or 72 hours. On the culture plate, the epithelial cell was examined by inverted microscopy and then categorized as cobblestone or spindle according to its cell morphology. A total of 100 cells were counted in each culture plate. After the cell collecting, the mRNA expressions of EMT-associated genes, including E-cadherin (a gene associated with epithelium) and α-SMA (a gene associated with mesenchyme), were examined by reverse transcription-polymerase chain reaction (RT-PCR).
RT–PCR and Real-time PCR
The total RNA of hGE cells was extracted with Trizol reagent, quantified by spectrophotometry at 260 nm, and reversely transcribed into total cDNA using PCR system.
§§The PCR reactions involved in an initial denaturation at 94°C for 2 minutes and 30 seconds, followed by 30 or 35 cycles at 94°C for 30 seconds, an annealing at 58–62°C for 30 seconds, and an extraction at 72°C for 60 seconds. The real time PCR reactions were performed by using a proper kid
‖‖in the cycler device
¶¶and involved in an initial denaturation at 95C for 5 minutes; following by 40 cycles of denaturing at 95C for 5 seconds and combined annealing/extension at 60C for 10 seconds as described in the instruction. The PCR primers were as follows: human E-cadherin, forward 5’-
TGAAGGTGACAGAGCCTCTGGA-3’ and reverse 5’-
TGGGTGAATTCGGGCTTGTT-3’ (Accession No.: NM_004360.3); human α-SMA,
forward 5’-GCGTGGCTATTCCTTCGTTAC-3’ and reverse 5’-
CATAGTGGTGCCCCCTGATAG-3 (Accession No.: NM_001613.2); human
glyceraldehyde-3-phosphate dehydrogenase (GAPDH), forward 5’-
AGCCGCATCTTCTTTTGCGTC-3’ and reverse 5’-TCATATTTGGCAGGTTTTTCT-
3’ (Accession No.: NM_002046). Primers for real-time PCR were QuantiTect Primer Assays (QIAGEN, Hilden, Germany), including human E-cadherin (QT00080143, Accession No.: NM_004360), human α-SMA, (QT00088102, Accession No.:
NM_001613), human TGF-β1 (QT00000728, Accession No.: NM_000660), and human GAPDH (QT00079247, Accession No.: NM_002046). The exponential phases of RT- PCRs were determined from 30 to 35 cycles to allow quantitative comparison between the cDNAs. Amplified RT-PCR products were then analyzed on 1% agarose gels, visualized with ethidium bromide staining by a camera system,
##and scanned with analysis system.
***The relative densities to GAPDH bands were determined.
Western Blot Analysis
We performed Western blot analysis to quantify the protein expression levels of phosopho-Smad2/3 in the total cell lysates of hGEs after treatment with CsA (1000 ng/ml), TGF-β1 (5μg/ml) and TGF-β inhibitor (10μM).
†††Protein samples were resolved on a 10% Sodium Dodecyl Sulfate (SDS) polyacrylamide gel. A 20-μg quantity of protein was loaded in each well with 4x sample buffer, and the protein samples were resolved by electrophoresis at 100 V for 2 hours. The resolved proteins were transferred from the polyacrylamide gel to membranes
‡‡‡with transfer system
§§§. The membranes were blocked with a solution of 2% bovine serum albumin (BSA)
‖‖‖and 1% Tween 20 in Tris-buffered saline. The membranes were incubated with primary antibodies to Phospho-Smad2/Smad3¶¶¶ and GAPDH### at 4°C overnight and washed, and the proteins were detected with HRP-conjugated secondary antibodies and reagent.****
Images of the Western blots were visualized, recorded and analyzed.††††
Immunocytochemistry and Confocal Laser Scanning Microscopy
The hGE cells were cultured in eight-well chamber slides for immunocytochemistry (ICC). The cells, after being treated with CsA, TGF-β1, or TGF-β1 inhibitor, were fixed with methanol, blocked with 5% BSA in PBS for 20 minutes, and then exposed to the primary antibodies of α-SMA, ‡‡‡‡ E-cadherin,§§§§ and (1:200 in 5% BSA) overnight at 4C. The cells were then washed in PBS, exposed to the secondary antibody (FITC- conjugated goat anti-rabbit IgG, 1:200 in 5% BSA) for 30 minutes and counterstained with DAPI.‖‖‖‖ The expressions of α-SMA, E-cadherin were observed and compared under different treatments by confocal laser scanning microscopy.¶¶¶¶
Statistical Analysis
All of the experiments were carried out independently for at least three times. Student’s t
tests or ANOVA were used for evaluating the differences between the test and control (0 ng/ml CsA) groups or other groups when specified. P < 0.05 was selected as the significant level.
‖ Leibovitz L-15 Sigma-Aldrich Inc., St Louis, MO
¶ Dispase II, Roche Diagnostics, Indianapolis, IN
# Gibco BRL, Life Technologies, Grand Island, NY
** EpiLife, Gibco, Invitrogen, Carlsbad, CA
†† Human Keratinocyte Growth Supplement, Invitrogen, Carlsbad, CA
‡‡ Sigma-Aldrich, St. Louis, MO
§§ GeneAmp®-9700, Applied Biosystems, Foster City, CA
‖‖ Rotor-Gene
TMSYBR
®Green PCR Kit, QIAGEN, Hilden, Germany
¶¶ Rotor-Gene Q, QIAGEN, Hilden, Germany
## Transilluminator/SPOT, Diagnostic Instruments, Sterling Heights, MI
*** ONE-Dscan 1-D Gel Analysis Software, Scanalytic Inc. Fairfax, VA
†††
TGF-β RI Kinase Inhibitor, Merck KGaA, Darmstadt, Germany
‡‡‡
Immobilon-Psq Transfer PVDF membranes, Millipore, Billerica, MA
§§§
Hoefer, Inc., Holliston, MA, USA.
‖‖‖
Sigma-Aldrich, St. Louis, MO
¶¶¶ Ser465/467 and Ser423/425, Cell Signaling Technology, Inc., Beverly, MA
### GeneTex Inc., San Antonio, TX
**** ImmobilonTM Western HRP Substrate Luminol Reagent, Millipore, Billerica, MA
†††† ChemiDoc™ XRS+ imaging system with Image Lab™, Bio-Rad Laboratories, Hercules, CA
‡‡‡‡ Abcam, Cambridge, UK
§§§§ BD Biosciences, Franklin Lakes, NJ
‖‖‖‖ Sigma-Aldrich, St. Louis, MO
¶¶¶¶ LSM780, Carl Zeiss MicroImaging, Inc., New York, NY
RESULTS
CsA at 1000 ng/ml was not cytotoxic to hGE cells, but induced change of cellular morphology of hGE cells
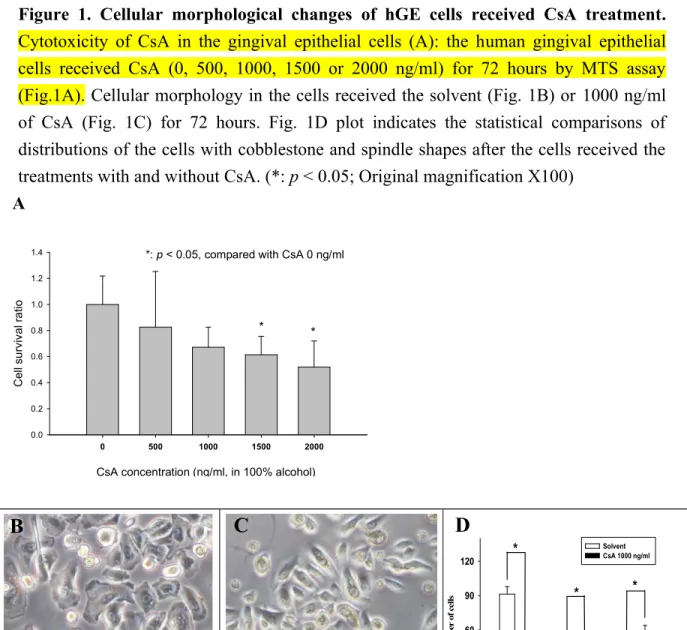
The hGE cell survival rate was not significantly reduced if 1000 ng/ml or less of CsA was given to the cells (Fig. 1A). However, the survival rate was significantly reduced when 1,500 ng/ml or more of CsA was given to the cells. The hGE cells received solvent (control cells) presented typical cobblestone morphology (Fig. 1B). Whereas, the cells became spindle-like, elongated, disassociated from neighboring cells, and lost their original cobblestone monolayer pattern when CsA was added. (Fig. 1C).
CsA induced the changes of EMT related mRNA expressions in hGE cells
The mRNA expressions of E-cadherin were significantly reduced (p < 0.05), with a dose dependent manner, after 1000 ng/ml of CsA treatments for 48 hours (Figs. 2A and 2C) and 72 hours (Figs. 2B and 2D) or after 800 ng/ml of CsA treatments for 72 hours. The levels of α-SMA and TGF-β1 were significantly increased (p < 0.05), with a dose dependent manner as well, after 1000 ng/ml of CsA treatments for 48 hours and 72 hours or after 800 ng/ml of CsA treatments for 72 hours.
Effects of TGF-β1 inhibition on the mRNA expressions of EMT markers in hGE cells received CsA
The E-cadherin and α-SMA expressions in hGE cells were examined with real-time PCR after a pretreatment of TGF-β1 inhibitor (10 μg/ml) overnight and the treatment of CsA (1000 ng/ml) for 72 hours. The pretreatment of TGF-β1 inhibitor alone did not alter the expression of E-cadherin (Fig. 3A). However, when 1000 ng/ml of CsA was given, the expression of E-cadherin was significantly reduced, and this reduction was significantly prevented when there was a pretreatment of 10μM of TGF-β1 inhibitor.
On the other hand, treating with 1 or 5 ng/ml of TGF-β1 alone did not significantly affect the expression of E-cadherin although a trend of reduction of E-cadherin could be observed. Similar to the result of E-cadherin, the pretreatment of TGF-β1 inhibitor alone did not alter the expression of α-SMA (Fig. 3B). But when 1000 ng/ml of CsA was given, the expression of α-SMA was significantly increased, and this increase did not occur when there was a pretreatment of TGF-β1 inhibitor. In contrast, the treatment with 1 or 5 ng/ml of TGF-β1 alone significantly increased the expression of α-SMA.
Effects of TGF-β1 inhibition on the phosphorylated smad-2 and -3 in hGE cells
received CsA
The expressions of smad-2 and smad-3 phosphorylation in hGE cells were examined western blotting after a pretreatment of TGF-β1 inhibitor (10 μg/ml) overnight and the treatment of CsA (1000 ng/ml) for 24 hours. The pretreatment of TGF-β1 inhibitor alone did not alter the expression of E-cadherin (Figs. 4A and 4B). However, when 1000 ng/ml of CsA was given, the expressions of phosphorylated smad-2 and smad-3 were significantly increased, and these increases did not occur when there was a pretreatment of TGF-β1 inhibitor. In contrast, the treatment with 5 ng/ml of TGF-β1 alone significantly increased the expressions of phosphorylated smad-2 and smad-3.
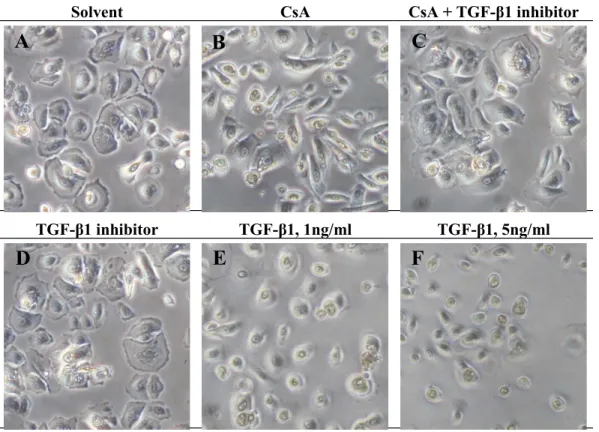
CsA in vitro induced a change of cellular morphology in hGE cells, but this change was prevented by TGF-β1 inhibitor
The morphology of gingival cells received the solvent (control cells) presented a typical cobblestone epithelial morphology (Fig. 5). The morphology of cells received CsA became elongated and disassociated from the adjacent epithelial cells (Fig. 5B).
However, the cells stayed with the original cobblestone morphology when there was a treatment of TGF-β1 inhibitor on top of the CsA treatment (Fig. 5C). The cells received TGF-β1 alone stayed rounded, but more three-dimensional and disassociated from the adjacent epithelial cells (Figs. 5E and 5F).
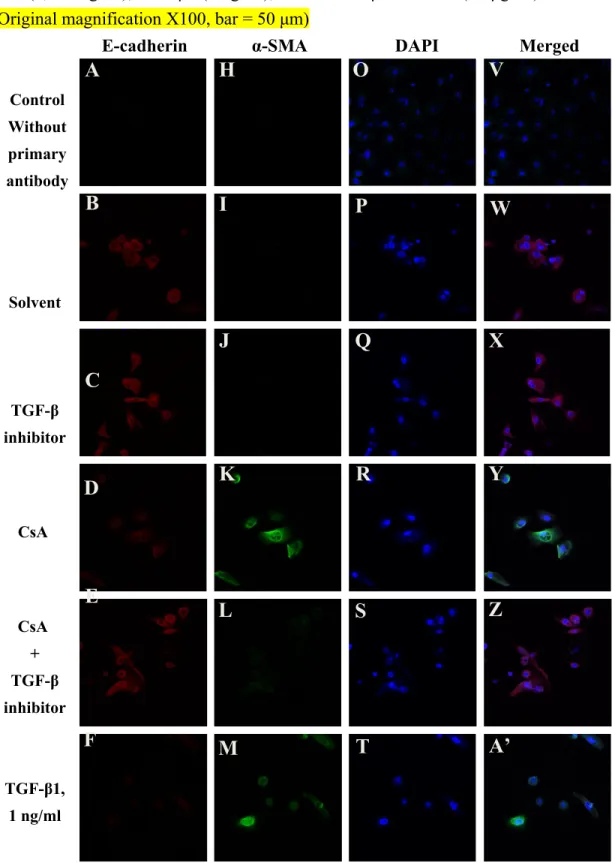
TGF-β1 inhibitor prevented the change of the expressions of EMT markers induced by CsA in hGE cells
With immunocytochemistry, there was no E-cadherin expression observed in the cell membrane when hGE cells received a treatment of CsA or TGF-β1 (Figs. 6D, 6F, and 6G), but the expression of E-cadherin could be observed in the control cells (with solvent or TGF-β1 inhibitor alone) (Figs. 6B and 6C) or in the cells received both of CsA and TGF-β1 (Fig. 6E). Opposite results were demonstrated for α-SMA (Figs 6I to 6N).
Positively stained α-SMA was easily observed in cytosol when hGE cells received a treatment of CsA or TGF-β1 (Figs. 6K, 6M, and 6N), but not observed in the control cells (with solvent or TGF-β1 inhibitor alone) (Figs. 6I and 6J) or in the cells received both of CsA and TGF-β1 (Fig. 6L).
Strong expression of 4',6-diamidino-2-phenylindole (DAPI) was observed in the nuclei of
all the hGE cells (Figs 6O to 6U).
DISCUSSION
The aims of the present study were to examine the notion that CsA could induce EMT in gingiva, and explore the role of TGF-β1 in CsA-induced gingival EMT by evaluating the changes of two EMT common markers and two TGF-β1 transcriptional modulators after CsA treatments with and without the suppression of TGF-β1. The effects of CsA on the morphological change of human epithelial cells were first examined in order to confirm the notion that CsA could induce EMT in gingiva.
17An increased percentage of epithelial cells transforming to mesenchymal phenotype was observed after CsA treatment (Figs.
1A and 1B). The expression of α-SMA, a common EMT marker, and TGF-β1, an epithelial to mesenchymal effector, were significantly increased in CsA treatment groups, while E-cadherin, another common EMT marker, was significantly reduced after CsA treatments (Fig. 2). The assumption of that CsA-induced EMT in gingiva is through TGF-β1
17was also verified and investigated in the current study. The altered expressions of E-cadherin and α-SMA were significantly prevented after TGF-β1 inhibitor with the examinations of real-time PCR (Fig. 3), and immunocytochemistry (Fig. 6). The inhibited protein expressions of phosphorylated smad-2 and smad-3 were significantly also prevented after TGF-β1 inhibitor (Fig. 4). The effects of CsA with TGF-β1 inhibitor on the morphological change of hGE cells were also examined. The change of morphology after CsA was absent when TGF-β1 inhibitor was added on top of the CsA treatment (Fig. 5).
CsA has been widely used in organ transplantation. Apart from its mutlple systemic consequences,
19-24CsA has been known to cause gingival overgrowth. At the histological level, the induced gingival overgrowth is characterized by epithelial hyperplasia, interstitial fibrosis, and focal inflammatory cell infiltration.
25, 26At the molecular level, CsA increases the expressions of TGF-β1, IL-6, and other mediators in gingiva.
3, 4However, there is still a very limited understanding of the occurrence of CsA-induced gingival overgrowth.
EMT is a process where epithelial cells lose their original phenotype with a concomitant development of mesenchymal phenotype. At cellular level, four fundamental steps are involved in EMT.
27These include (i) loss of epithelial cell–cell adherens junction component E-cadherin and actin cytoskeletal rearrangement, (ii) de novo synthesis of myofibroblast specific marker proteins e.g. α-SMA, (iii) disruption of the tubular basement membrane, and (iv) enhanced cell migration and invasiveness.
According to the classification proposed at The EMT International Association
(TEMTIA) meetings, EMT can be classified into three subtypes.
28, 29Type 1, or so called
developmental EMT, occurs only during embryogenesis when primitive epithelial cells
give rise to the mobile mesenchymal cells, mesoderm, and endoderm. Type 2, a.k.a.
fibrogenic EMT, is associated with inflammation, would healing, tissue regeneration, and organ fibrosis in mature or adult tissue. Type 2 EMT is induced in response to inflammation or trauma and normally ceases once the stimulus stops.
30Type 3, a.k.a metastasis-associated EMT, occurs in epithelial cancer cells and allow them convert to a mesenchymal phenotype in order to move to the invasive front of the tumors.
28Due to the absence of metastasis, the CsA-induced EMT in gingival overgrowth should belong to type 2 EMT according to the above classification.
However, whether EMT exists in a specific tissue could be identified by detecting the changes of EMT markers. Among of all of the markers, E-cadherin is one of the well- acknowledged EMT markers and plays an essential role in maintaining the structural integrity of epithelium and the polarization.
31The suppression of E-cadherin expression is an early important step that precedes all other major events such as induction of α-SMA during TGF-β1–induced EMT.
27In gingival epithelium, significant changes of some specific EMT markers,
15, 32including E-cadherin, β-catenin,
33HSP47,
34and integrins,
35have been observed in the CsA histological tissues in our previous study and others.
Alterations of few other EMT markers,
36-39e.g. up-regulations of Snail-1, and down- regulation of Zonula Occludent-1, have also been lately observed in primary cultured hGE cells after CsA treatment in our laboratory (unpublished data), providing an extra evidence of the existence of CsA-induced EMT in gingival overgrowth.
TGF-β1 has been identified to induce EMT in kidney, breasts, and in other organ systems.
5, 40In addition, TGF-β1 is capable of inducing EMT in epithelial fibrosis of kidney,
11, 27lung,
12and liver.
6TGF-β1 can also be influenced by CsA. After CsA applications, it has been found that the expressions of TGF-β1 were elevated in human gingival fibroblast,
3, 41human gingival crevicular fluid,
42and dental plaque-free gingiva.
43Recently, the finding demonstrated that E-cadherin and two fibroblast markers or
debatable EMT markers
15, 16(i.e. fibroblast specific protein-1 and fibronectin extra type
III domain A) were altered in the overgrown gingivae of patients taking CsA
17providing
the first evidence that EMT may be present in CsA-induced gingival overgrowth. Our
results are consistent with their findings and support their notion. They also demonstrated
that TGF-β1 may trigger EMT in vitro in healthy hGE cells with significant alterations of
some EMT markers.
17However, it has been shown that, in renal tissues, CsA-induced
EMT could be either TGF-β1 dependent or independent.
44, 45The model of TGF-β1-
induced EMT consequently may not be ideal anymore to represent the EMT induced by
CsA. In the present study, we hypothesized that, in gingival epithelium, the CsA-induced
type 2 EMT is TGF-β1 dependent or at least partially dependent. Our results
demonstrated that the changes of E-cadherin, β-catenin, pSmad2, and pSmad3 after CsA treatments were significantly prevented by adding of TGF-β1 inhibitor, indicating that the CsA-induced gingival EMT is TGF-β1 dependent. However, further investigations are still needed to clarify the detailed mechanisms of the CsA-mediated EMT in gingiva.
CONCLUSIONS
Our results suggested that CsA could induce type 2 EMT in gingiva by changing the morphology of epithelial cells and altering the EMT markers/effectors. The CsA-induced type 2 EMT in gingiva might be prevented by the inhibition of TGF-β1, indicating that the CsA-induced gingival EMT is TGF-β1 dependent or at least partially dependent. With a better understanding of the role of CsA-medicated EMT in gingiva, we hope to shed additional light on the mechanism of CsA-induced gingival enlargement, which could have important implications for clinical therapy.
ACKNOWLEDGMENTS
This study was supported by the grants from the National Science Council (NSC-100-
2314-B-016-037) and the Department of National Defense (MAB-101-54), Taiwan,
ROC. The authors report no conflicts of interest related to this study.
REFERENCES
1. Wysocki GP, Gretzinger HA, Laupacis A, Ulan RA, Stiller CR. Fibrous hyperplasia of the gingiva: a side effect of cyclosporin A therapy. Oral Surg Oral Med Oral Pathol 1983;55:274-278.
2. Hallmon WW, Rossmann JA. The role of drugs in the pathogenesis of gingival overgrowth. A collective review of current concepts. Periodontol 2000 1999;21:176-196.
3. Chae HJ, Ha MS, Yun DH, et al. Mechanism of cyclosporine-induced overgrowth in gingiva. J Dent Res 2006;85:515-519.
4. Bostrom A, Bharath H, Saulewicz A, Narayanan AS. Cyclosporin a affects signaling events differentially in human gingival fibroblasts. J Dent Res 2005;84:532-536.
5. Hay ED. An overview of epithelio-mesenchymal transformation. Acta Anat (Basel) 1995;154:8-20.
6. Iwano M, Plieth D, Danoff TM, Xue C, Okada H, Neilson EG. Evidence that fibroblasts derive from epithelium during tissue fibrosis. J Clin Invest 2002;110:341-350.
7. Weber CE, Li NY, Wai PY, Kuo PC. Epithelial-mesenchymal transition, TGF-beta, and osteopontin in wound healing and tissue remodeling after injury. J Burn Care Res 2012;33:311-318.
8. Xue C, Plieth D, Venkov C, Xu C, Neilson EG. The gatekeeper effect of epithelial- mesenchymal transition regulates the frequency of breast cancer metastasis.
Cancer Res 2003;63:3386-3394.
9. Guarino M, Micheli P, Pallotti F, Giordano F. Pathological relevance of epithelial and mesenchymal phenotype plasticity. Pathol Res Pract 1999;195:379-389.
10. Thiery JP, Sleeman JP. Complex networks orchestrate epithelial-mesenchymal transitions. Nat Rev Mol Cell Biol 2006;7:131-142.
11. Zeisberg M, Bonner G, Maeshima Y, et al. Renal fibrosis: collagen composition and assembly regulates epithelial-mesenchymal transdifferentiation. Am J Pathol 2001;159:1313-1321.
12. Willis BC, Liebler JM, Luby-Phelps K, et al. Induction of epithelial-mesenchymal transition in alveolar epithelial cells by transforming growth factor-beta1:
potential role in idiopathic pulmonary fibrosis. Am J Pathol 2005;166:1321-1332.
13. Saika S, Kono-Saika S, Ohnishi Y, et al. Smad3 signaling is required for epithelial- mesenchymal transition of lens epithelium after injury. Am J Pathol 2004;164:651-663.
14. Margetts PJ, Bonniaud P, Liu L, et al. Transient overexpression of TGF-{beta}1
induces epithelial mesenchymal transition in the rodent peritoneum. J Am Soc Nephrol 2005;16:425-436.
15. Kriz W, Kaissling B, Le Hir M. Epithelial-mesenchymal transition (EMT) in kidney fibrosis: fact or fantasy? J Clin Invest 2011;121:468-474.
16. Galichon P, Hertig A. Epithelial to mesenchymal transition as a biomarker in renal fibrosis: are we ready for the bedside? Fibrogenesis & tissue repair 2011;4:11.
17. Sume SS, Kantarci A, Lee A, Hasturk H, Trackman PC. Epithelial to mesenchymal transition in gingival overgrowth. Am J Pathol 2010;177:208-218.
18. Kantarci A, Nseir Z, Kim YS, Sume SS, Trackman PC. Loss of basement membrane integrity in human gingival overgrowth. J Dent Res 2011;90:887-893.
19. Chang SH, Lim CS, Low TS, Chong HT, Tan SY. Cyclosporine-associated encephalopathy: a case report and literature review. Transplant Proc 2001;33:3700-3701.
20. Galan AI, Fernandez E, Moran D, Munoz ME, Jimenez R. Cyclosporine A hepatotoxicity: effect of prolonged treatment with cyclosporine on biliary lipid secretion in the rat. Clin Exp Pharmacol Physiol 1995;22:260-265.
21. Nalesnik MA, Jaffe R, Starzl TE, et al. The pathology of posttransplant lymphoproliferative disorders occurring in the setting of cyclosporine A- prednisone immunosuppression. Am J Pathol 1988;133:173-192.
22. Woolfson RG, Neild GH. Cyclosporin nephrotoxicity following cardiac transplantation. Nephrol Dial Transplant 1997;12:2054-2056.
23. Textor SC, Canzanello VJ, Taler SJ, et al. Cyclosporine-induced hypertension after transplantation. Mayo Clin Proc 1994;69:1182-1193.
24. Rodino MA, Shane E. Osteoporosis after organ transplantation. Am J Med 1998;104:459-469.
25. Deliliers GL, Santoro F, Polli N, Bruno E, Fumagalli L, Risciotti E. Light and electron microscopic study of cyclosporin A-induced gingival hyperplasia. J Periodontol 1986;57:771-775.
26. Ayanoglou CM, Lesty C. Cyclosporin A-induced gingival overgrowth in the rat: a histological, ultrastructural and histomorphometric evaluation. J Periodontal Res 1999;34:7-15.
27. Yang J, Liu Y. Dissection of key events in tubular epithelial to myofibroblast transition and its implications in renal interstitial fibrosis. Am J Pathol 2001;159:1465-1475.
28. Kalluri R, Weinberg RA. The basics of epithelial-mesenchymal transition. J Clin
Invest 2009;119:1420-1428.
29. Zeisberg M, Neilson EG. Biomarkers for epithelial-mesenchymal transitions. J Clin Invest 2009;119:1429-1437.
30. Thiery JP, Acloque H, Huang RY, Nieto MA. Epithelial-mesenchymal transitions in development and disease. Cell 2009;139:871-890.
31. Bush KT, Tsukamoto T, Nigam SK. Selective degradation of E-cadherin and dissolution of E-cadherin-catenin complexes in epithelial ischemia. Am J Physiol Renal Physiol 2000;278:F847-852.
32. Quaggin SE, Kapus A. Scar wars: mapping the fate of epithelial-mesenchymal- myofibroblast transition. Kidney Int 2011;80:41-50.
33. Tu HP, Chen YT, Shieh YS, et al. Cyclosporin-induced downregulation of the expression of E-cadherin during proliferation of edentulous gingival epithelium in rats. J Periodontol 2006;77:832-839.
34. Chang TY, Tsai CH, Chang YC. The upregulation of heat shock protein 47 in human gingival fibroblasts stimulated with cyclosporine A. J Periodontal Res 2010;45:317-322.
35. Walsh P, Hakkinen L, Pernu H, Knuuttila M, Larjava H. Expression of fibronectin- binding integrins in gingival epithelium in drug-induced gingival overgrowth. J Periodontal Res 2007;42:144-151.
36. Venkov CD, Link AJ, Jennings JL, et al. A proximal activator of transcription in epithelial-mesenchymal transition. J Clin Invest 2007;117:482-491.
37. Teng Y, Zeisberg M, Kalluri R. Transcriptional regulation of epithelial- mesenchymal transition. J Clin Invest 2007;117:304-306.
38. Cho HJ, Baek KE, Saika S, Jeong MJ, Yoo J. Snail is required for transforming growth factor-beta-induced epithelial-mesenchymal transition by activating PI3 kinase/Akt signal pathway. Biochem Biophys Res Commun 2007;353:337-343.
39. Cano A, Perez-Moreno MA, Rodrigo I, et al. The transcription factor snail controls epithelial-mesenchymal transitions by repressing E-cadherin expression. Nat Cell Biol 2000;2:76-83.
40. Thiery JP. Epithelial-mesenchymal transitions in tumour progression. Nat Rev Cancer 2002;2:442-454.
41. Cotrim P, Martelli-Junior H, Graner E, Sauk JJ, Coletta RD. Cyclosporin A induces proliferation in human gingival fibroblasts via induction of transforming growth factor-beta1. J Periodontol 2003;74:1625-1633.
42. Buduneli N, Kutukculer N, Aksu G, Atilla G. Evaluation of transforming growth
factor-beta 1 level in crevicular fluid of cyclosporin A-treated patients. J
Periodontol 2001;72:526-531.
43. Chen YT, Tu HP, Chin YT, et al. Upregulation of transforming growth factor-beta1 and vascular endothelial growth factor gene and protein expression in cyclosporin-induced overgrown edentulous gingiva in rats. J Periodontol 2005;76:2267-2275.
44. Pallet N, Thervet E, Anglicheau D. c-Jun-N-Terminal Kinase Signaling Is Involved in Cyclosporine-Induced Epithelial Phenotypic Changes. J Transplant 2012;2012:348604.
45. Berzal S, Alique M, Ruiz-Ortega M, Egido J, Ortiz A, Ramos AM. GSK3, snail, and
adhesion molecule regulation by cyclosporine A in renal tubular cells. Toxicol Sci
2012;127:425-437.
Figure 1. Cellular morphological changes of hGE cells received CsA treatment.
Cytotoxicity of CsA in the gingival epithelial cells (A): the human gingival epithelial cells received CsA (0, 500, 1000, 1500 or 2000 ng/ml) for 72 hours by MTS assay (Fig.1A). Cellular morphology in the cells received the solvent (Fig. 1B) or 1000 ng/ml of CsA (Fig. 1C) for 72 hours. Fig. 1D plot indicates the statistical comparisons of distributions of the cells with cobblestone and spindle shapes after the cells received the treatments with and without CsA. (*: p < 0.05; Original magnification X100)
A
CsA concentration (ng/ml, in 100% alcohol)
0 500 1000 1500 2000
Cell survival ratio
0.0 0.2 0.4 0.6 0.8 1.0 1.2 1.4
* *
*: p < 0.05, compared with CsA 0 ng/ml
Cobblestone Undetermined Spindle
Number of cells
0 30 60 90 120
Solvent CsA 1000 ng/ml
*
* *
B C D
Figure 2. In vitro mRNA expressions of E-cadherin,α-SMA, and TGF-β1 in hGE cells received CsA treatment. The mRNA expressions of E-cadherin, α-SMA, and TGF- β1 in hGE cells after CsA-treatment for 48 (Figs. 2A and 2C) or 72 (Figs. 2B and 2D) hours. The expression was hemi-quantitatively compared with their relative densities to GAPDH. (*: significant difference to that in the solvent at p < 0.05 for E-cadherin and α- SMA by post-hoc analysis after one way ANOVA)
48h
SolventCsA concentration (ng/ml, in 100% alcohol)
72h
SolventCsA concentration (ng/ml, in 100% alcohol)
500 800 1000 500 800 1000
E-cadherin
α-SMA
TGF-β1
GAPDH
A B
C D
48 hrs.
CsA concentration (ng/ml, in sovent)
solvent 500 800 1000
Relative intensity
0.5 1.0 1.5
2.0 -SMA
TGF-
E-Cadherin
*
*
*
72 hrs.
CsA concentration (ng/ml, in sovent)
solvent 500 800 1000
Relative intensity
0.5 1.0 1.5 2.0 2.5 3.0
3.5 -SMA
TGF-
E-Cadherin
*
*
*
*
*
*
Figure 3. Effect of TGF-β1 inhibitor on the expression of two EMT markers, E- cadherin and α-SMA, in hGE cells received CsA treatment.
The mRNA expressions of E-cadherin and α-SMA in hGE cells were examined with real- time PCR after the treatments of CsA (1,000 ng/ml) with or without TGF-β1 inhibitor (10 μg/ml). (*: p < 0.05, compared to that in the solvent, and #: p < 0.05, compared to that with CsA treatment)
Treatment
Relative Expression of E-cadherin
0.0 0.2 0.4 0.6 0.8 1.0 1.2 1.4 1.6
CsA 1000 ng/ml
TGF- inhibitor (3528 ng/ml) TGF-1 (1 or 5 ng/ml)
+ +
+ +
-
-
-
-
- -
- - 1
-
- 5
-
-
*
#
E-cadherin
A
Treatment
Relative Expression of -SMA
0 1 2 3 4 5 6
CsA 1000 ng/ml
TGF- inhibitor (3528 ng/ml) TGF-1 (1 or 5 ng/ml)
+ +
+ +
-
-
-
-
- -
- - 1
-
- 5
-
-
*
#