DOI: 10.6245/ JLIS.2013.391/614
Asian/Pacific Islander Librarians Career Choices:
Demographics and Descriptive Analysis
美國亞太裔圖書館員的職業選擇:
人口統計特徵和描述性分析
Jianzhong Zhou
Head of Reference Department, California State University, Sacramento, U.S.A.
E-mail:[email protected]
Glen Zhou
Student, University of California, Berkeley, U.S.A
E-mail:[email protected]
Allan Zhou
Student, Folsom Lake College, U.S.A
E-mail:[email protected]
Milan Zhou
Student, Folsom High School, U.S.A
E-mail:[email protected]
Keywords(關鍵詞): Asian American Librarians(亞裔美籍圖書館員); Pacific Islander
Librarians(太平洋島裔圖書館員); Career Choice(職業選擇);
Credentialed Librarians(職業館員); Chief Librarians(圖書館長);
Leadership Achievement Gap(領導階層的差距); Administration
and Management(領導與管理)
【
Abstract】
The study first reviews the history of Asian
immigrants since 1850s and the significance of
the Immigration and Nationality Act of 1965 on
current Asian Americans/Pacific Islanders (AAPI)
population and demographics in the United
States. Then the study summarizes previous
research of AAPI librarians and conducts a new
survey to inquire the status of AAPI librarians.
From 91 completed surveys out of over 600
distributed, the study shows a demographic
picture of AAPI librarians and lists factors
associated with AAPI librarians’ career choices.
In addition, the study compares United States
immigration and international student data with
MLS conferred by race/ethnicity data in order to
predict the future growth of AAPI librarians. The
analyses of both data sources show that more
international students from Asia are studying in
the United States and becoming the United
States citizens and residents, but fewer
international students and Asian American
students, compared with other race/ethnic
groups, choose librarianship as a career. At the
end, the study predicts the future growth of AAPI
librarians will be slower compared to other
minority groups, and the percentage of AAPI
librarians among total credentialed librarians will
become lower.
【摘要】
本文首先回顧自
19 世紀 50 年代美國亞洲移
民的歷史和分析當前美國亞裔/太平洋島民
(
AAPI)的人口統計。強調美國 1965 年的新
移民和國籍法案對美國亞太裔人口增長及職
業選擇的意義。其次,本文在總結以前有關亞
太裔館員的研究之基礎上,對目前亞太裔圖書
館員的職業狀態設計和開展全新的電子問卷
調查研究。在選取的
600 多名亞太裔圖書館員
中,
91 人完成了職業狀態調查。由此考察和分
析美國亞太裔圖書館員職業特徵與影響亞太
裔圖書館員職業選擇的相關因素。最後,本文
比較
1999-2010 年美國亞洲移民和來美的亞
洲國際學生與美國授予圖書情報碩士學位中
的亞太裔和國際學生數據,以此預測亞太裔館
員的未來增長趨勢。比較和分析發現絕大多數
國際學生來自亞洲,美國新移民亞裔比例越來
越高,但比起其他種族/裔群體,較少的國際
學生和美國亞裔學生選擇圖書館員作為一個
職業。本文預測未來十年亞太裔館員的增長將
低於其他少數群體/裔,亞太裔館員在全美職
業館員的比例將減少。
This study is the first part of a year-long research on Asian American and Pacific Islander (AAPI) librarians in the United States. The purpose of the first part is to show AAPI librarians demographics, their career choices, and the future growth of AAPI librarians by a quantitative survey through e-mail distribution.
Problems Statement for the
Entire Study
The year-long research focused on the low representation of highly educated AAPI in top leadership positions in education in general, and in librarianship in particular. Data from Statistical Abstract of the United States: 2011 showed that the Asian population with a college degree or higher was the highest for both male and female among all race and ethnic groups. More than 1,747,000 Asians 25 years of age or older held a graduate degree or higher in the year 2006 based on American Community Survey (United States Census Bureau, 2007). The percentage of Asian graduate degree holders is larger than that of White or any other groups in the United States among professional or doctoral degrees holders; about 20% are minorities for both professional and doctoral degrees and AAPIs account for more than 10.50% of professional and 12% of doctoral degree holders (National Center for Education Statistics, 2011).
It would be a reasonable assumption that AAPI university administrators and presidents would be well represented in proportion to AAPI’s degree holders. However, this has not been the case. AAPI tenured faculty (6.5%), and AAPI college presidents (0.9%) show a significant lack of progress on career path for AAPI faculty (American Council on Education, 2007; National Center for Education Statistics, 2011; Ryu, 2008). Among AAPI credentialed librarians, 6.6% of all credentialed librarians in 126 of Association of Research Libraries (ARL) were AAPI, but there were only THREE AAPI chief librarians, or about 2.5% in 2012 (Zhou, 2012). Because almost all college presidents worked as faculty members with
required terminal degrees (Birnbaum and Umbach, 2001) and authors verified that almost all ARL chief librarians (except two) worked as professional librarians previously. It is a reasonable assumption that faculty members and professional librarians are the promotion pools for the college presidents and ARL chief librarians. However, both faculty and librarian pools show much higher AAPI percentages than the corresponding percentages of AAPI college presidents and ARL chief librarians. The authors refer this phenomenon of severe and consistent disparity of AAPIs at the leadership level and at the qualified pool level as the AAPI leadership achievement gap.
Research Questions for the Study
This study focuses on AAPI librarians’ demographics and the descriptive analyses and is trying to answer the following questions:What are the demographics of AAPI librarians in 2010s? What are the major factors that influenced AAPI librarians’ career choices?
What is the potential population growth of AAPI librarians compared to other racial/ethnical groups?
History of Asian Immigrants
The United States Census (2007, p. 4) showed that 67.32% of Asian Americans were foreign-born immigrants and the Census Report stated that the Immigration andNationality Act of 1965 (Immigration Act of 1965 thereafter)
was the starting point for the recent increase of Asian immigrants to the United States. The demographics of Asian American librarians are tied more closely to immigration history from Asia than career choices of native born Asian Americans. The authors feel this demographic study of AAPI professional librarians would not be complete without giving a brief review of Asian immigration history, especially without discussing the Immigration and Nationality Act of 1965.
Asian Immigrants before 1965
Large numbers of Asian immigrants in the United States can be traced back at least to 1850. United States immigration policies and laws dictated the ebb and flow of American Asian population in the last 150 years. Bill Ong Hing’s 1993 book Making and Remaking
Asian America through Immigration Policy 1850-1990
provided a history of Asian Americans through an immigration policy perspective. Asian American immigrants experienced cycles of rejection (fueled by racial prejudice and fear of economic competition) and acceptance (motivated by the desire for cheap and dependable labor). In the 19th century, Chinese were the first to enter the United States in significant numbers among Asian immigrants who searched for gold and built the inter-continental railroad. According to Hing (1993), 50,000 Chinese in the state of California paid $14 million annually in taxes in the 1850s and 1860s, a huge number considering the United States nominal GDP was around $2.556 billion in 1850 (Temin, 1972; Rhode, 2002; Chantrill, 2011). Fourteen million dollars in 1850 is equivalent to $80 billion in 2010 as measured by relative
share of GDP, a method used in national finance and
economics to compare income and expenditures over time. Here is how the relative share is calculated: the United States GDP has increased about 5673 times since 1850, from 2.556 billion to $14.5 trillion in 2010. The relative share method converts $14 million in taxes paid in 1850 to $80 billion in 2010 by the multiplier 5673. Under the relative share of GDP, the percentage of $14 million to a $2.556 billion GDP in 1850 is equal to the percentage of $80 billion to a $14.5 trillion GDP in 2010 (United States Census Bureau, 2011a). The concept of relative share stimulated the authors to create Representation Disparity Ratios, a quantifying method to measure social mobility in moving up the career ladder that will be introduced and explained in a separate article.
Despite the huge financial contribution of Chinese immigrants, they were the first Asian immigrant group
to be barred from immigration through national exclusionary policy. In the Naturalization Act of 1870, Congress extended the naturalization right to “white persons and persons of African descent,” but it deliberately denied Chinese that right because of their “undesirable qualities.” Following the 1870 denial of opportunity to naturalize Chinese, Congress in 1875 passed legislation prohibiting the immigration of Chinese women for “immoral purposes.” With Chinese women excluded from immigration, the Chinese population in the United States was guaranteed not to multiply. On May 6, 1882, the 47th Congress enacted the Chinese Exclusion Act and the law excluded Chinese laborers for 10 years. The Chinese Exclusion Act was extended several times and in 1904, Congress extended the ban on Chinese immigration indefinitely (Hing, 1993, pp. 20-26).
Following the pattern of Chinese immigrants, Japanese and Filipinos experienced their own cycle of acceptance and rejection. A series of anti-Asian immigration laws started with the Chinese Exclusion Act of 1882, followed by the Gentlemen’s Agreement of 1907 with Japan, the 1917 Asiatic Barred Zone Act, 1924 National Origins Act and Asian Exclusion Act, and the Philippine Independence
Act in 1934, the United States immigration door closed to
almost all Asian immigrants by 1934.
During World War II, the United States and China became allies against Japan and the 1882 Chinese Exclusion
Act was repealed by the Congress in 1943 (Chinese
Repealer, 57 Stat. 600). However, the 1924 National
Origins Act set the annual quota of any nationality at
2% of the number of foreign-born persons of such nationality resident in the United States in 1890 (Wang, 1975, p. 99; Hutchinson, 1981, p. 194), and the quota of immigrants for Chinese or person of Chinese descent was set at just over 100 after the 1943 Chinese Repealer. The national origin quota system based on 1890 United States census was finally abolished by the Immigration
and Nationality Act of 1965, which allowed 20,000
immigrant visas for every country not in the Western Hemisphere. In addition to 75% allotment for relatives of citizens and lawful permanent residents for family reunification, the new immigration law of 1965 established occupational preference categories. As a result of the very low Asian immigration rate before 1965, the occupational categories helped a new generation of Asian professionals to enter the United States and to be followed by their families and relatives after 1965. The percentage of Asians among total immigrants increased from 2.75% in 1930’s to 40% in 2010 (Department of Homeland Security, 2010). The overall effect of 1965 immigration law on Asian immigrants can be illustrated in the following figure1.
Figure 1 Legal Immigrants from 1930’s to 2000’s
Asian Immigrants after 1965
In addition to the traditional categories of family members and immediate relatives of United States citizens and legal residents, The Immigration and Nationality Act
of 1965 established two new categories to bring in new
immigrants -- “Professionals, scientists, and artists of exceptional ability” and “skilled or unskilled persons capable of filling labor shortages in the United States” (Public Law 89-236, 79 Stat. 911). Even though the larger percentage of immigration numbers is still set for family members and relatives of United States citizens and legal residents, the two new categories significantly increased the percentage of Asian immigrants with college degrees and special skills. In addition to the temporary workers visa H-1A, computer engineers and IT professionals under H-1B visa and nurses under H-1C visa brought in more professional Asian immigrants. Asians started to arrive in large numbers after 1965, first as college or graduate students, who then became immigrants through the two new professional/market shortage categories in the Immigration and Nationality Act of 1965.
The large increase of new Asian immigrants since the 1960s changed the demographics of Asian Americans. In a 2007 United States Census Bureau report, two of every three Asian Americans were foreign-born. For example, the largest Asian American population has been Chinese and their population declined from over 107,500 in 1890 to less than 106,500 in 1940, but increased significantly to 1,645,500 in 1990 (Immigration and Naturalization Service, 1982-2000; Gardner, Robey, & Smith, 1985) The growth rate of AAPI population was considered the fastest at 204% from 1980 to 2000 (Hobbs & Stoops, 2001), and another 34% from 2000 to 2010 (United States Census Bureau, 2011b).
Fong (2008) provided a picture of Asian American history through the lenses of United States immigration policies, and through lenses of local anti-Asian laws and legal cases. Asians in the United States did not possess sufficient political clout to have their voice heard during elections because many Asians were unable to obtain
citizenship before the enactment of Immigration and
Nationality Act of 1965. However, individual Asians
and local Asian groups fought legal battles against anti-Asian laws and policies in all levels of the United States court system. Some individual Asians won, such as Yick Wo v. Hopkins in 1886 Supreme Court case and
Roldan v. Los Angeles County in a 1933 California Court
of Appeals case. However, without political power, Asians in America as a racial minority group had no control or leverage on national policies that would have positive bearing on their lives and on the lives of their children.
In addition to addressing the experiences of Asian Americans from China, Japan, Korea, Philippines, and India, Fong’s book (2008) covers post-1965 Asian immigrants and refugees from Southeast Asia after the Vietnam War. It also provides readers with a unique perspective of Asian immigrants from a global economic restructuring point of view. Since the 1970s, many Asian countries experienced fast economic growth and have become newly industrialized nations. The United States, on the other hand, is demanding less low-skilled manufacturing labors because those jobs are moving abroad. Instead, the United States needs to import individuals with advanced education and specialized skills that are difficult to outsource. The Immigration Act of
1965 provided the United States labor market with new
immigrants with higher education and special skills. According to National Science Foundation data, since 2000, more doctoral degrees in the physical sciences and engineering fields were awarded to foreign students than to American citizens or permanent residents. Students from China and Taiwan accounted for one third of all foreign doctorate recipients, and the top five foreign countries/economies “exporting” students to the United States are all in Asia—China, India, South Korea, Taiwan and Turkey. These top five countries accounted for 62.78% of all foreign student recipients of doctoral degrees (National Science Foundation, 2010) Because many of those highly educated foreign students retained
United States residency under the Immigration Act of
1965, and became new immigrants with more education
than average United States citizens, Zhou proposed his
Immigration Filtering Theory (IFT) during the
Multi-cultural Education Conference held at the California State University, Sacramento in 2010 (Zhou, 2010). Zhou discovered that Asians, who were excluded from United States immigration for many years prior to 1965, and had very limited chance through the “immediate family” category, thereafter came in large numbers filtered through the professional and market shortage categories of the Immigration and Nationality Act of 1965. IFT asserts that Asians who immigrated after 1965 have higher
educational achievement for up to three generations compared to the general United States population and compared to the native population in immigrants’ exporting countries. Children and grandchildren of those
highly educated/special skilled immigrants tend to have the drive, family tradition, and family assistance, or other cultural and social capitals, to complete higher education. The “three generations” limit was inspired by an old Chinese proverb “富不過三代”, the influence of the first generation successful pioneers can only last down to the third generation in their families. Among highly educated Asian immigrants after 1965, some chose librarianship and the number of Asian American librarians increased significantly since the 1970s. Two Asian/Pacific American librarians associations both started in late 1970s correlated with the increase of AAPI professional librarians.
Review of Literature
Chinese American Librarians Association (CALA) first started in 1973 as the Mid-West Chinese American Librarians Association, a regional organization in Illinois. A year later, the Chinese Librarians Association was formed in California. In 1976, Mid-West Chinese American Librarians Association was expanded to a national organization as Chinese American Librarians Association and became an affiliated association with American Library Association (ALA). By 1979, CALA had five chapters
in Northeast, Mid-West, Atlantic, Southwest and California respectively (CALA’s Web site at http://www.cala-web.org/). The Asian American Librarians Caucus (AALC) was organized in 1975 as a discussion group of the ALA, Office for Library Outreach Services. In 1980, Asian Pacific American Librarians Association (APALA) was formally incorporated in Illinois and became an affiliated of ALA in 1982 (APALA Web site at http://www.apalaweb.org/).
Several studies provided basic profiles of Chinese American librarians (Li, 1979; Yang, 1996; Liu, 2000; Zhou, 2003). CALA librarians have been mostly foreign-born first generation immigrants at 85% to 95%, and female dominated from 75% to 82%. Close to half of CALA librarians belong to age group of 50+, followed by age 40-49 group at 34%, age 30-39 group at 17%, and only 5% were age 20-29. In the most recent study of CALA members by Ruan and Xiong (2008a; 2008b), Chinese American librarians are profiled as highly educated with over 82% holding Master of Library Science (MLS) degrees, 67% with a second master degree and 6% with a doctoral degree, much higher than the average of 29% second master and 2% doctoral degrees for all credentialed librarians (American Library Association, 2007, p. 10). As the result of higher educational attainment, the majority (51%) of CALA member librarians work full time in higher education, which correlates to the fact that AAPI librarians had the highest education attainment among all racial/ethnic groups. According to Ruan and Xiong’s (2008a) first report, 71% of CALA librarians supervise or manage other staff members. Twenty percent were at supervisor category and 25% at manager/director category. Yet, none of the CALA librarians supervise more than 99 employees, a measure used to signal chief librarians in large libraries in their study. Despite the highest education attainment and large percentage of CALA librarians at supervisor and manager/director level, there is an under-representation of CALA librarians at chief librarian positions among large libraries. Looking at the organizational reporting structure, 90% of CALA
librarians reported to another librarian in the organization; 1% reported to a contracting officer, and the rest had reporting relations marked N/A. However, the previous studies are limited to CALA librarians, the largest group of AAPI librarians. Hence, the authors pursued this investigation focused on demographic information and career choices from both CALA and APALA librarians.
Research Methodology
The authors designed an online quantitative survey (Q1) to explore the status and perception of AAPI librarians. The research subjects who participated in this survey consisted of members of CALA and members of APALA. A letter of endorsement was secured from the President of each association. The first section (I-1 to I-12) of Q1 survey has nine questions related to demographics and career choices of AAPI librarians and three questions related to AAPI librarians’ involvement outside their daily jobs. (I-1) how many generations of residency in the United States since family first immigrated, (I-2) years of k-12 education received in North American, (I-3) geographic regions of current work places, (I-4) graduate degrees received in addition to Masters Degree of Library Science (MLS), (I-5) number of years worked as professional librarians, (I-6) number of professional publications, (I-7) service in national professional associations, government and school board memberships, (I-8) involvement in local and national elections, and (I-9) the highest professional library positions ever held. The survey question I-9 is the dependent variable and the authors can run correlation and regression analysis based on independent variables in question I-1 to I-8 and dependent variables I-9. Q1 survey questions I-10 to I-12 asked AAPI librarians involvement in library profession, in their local communities and in the society in general. The second section (II-1 to II-6) of Q1 survey focuses on AAPI librarians’ perceptions of important factors on the pathway to leadership positions. The authors run ANOVA test to
seek any statistically significant differences in perceptions among AAPI chief librarians, supervisor librarians, and non-supervisor librarians. However, the correlation, regression and ANOVA methodologies are beyond the scope of this paper; they will be covered elsewhere.
CALA and APALA members with an e-mail account first received a message introducing the survey with supporting letters from the CALA and APALA presidents, followed one week later by an e-mail containing a link to the online survey. In order to improve the response rate, reminder e-mail messages were sent twice in the 10-day survey period in November 2011. In addition to multiple choices, Q1 asked a question “Please write the names and contact information of any current or retired AAPI chief librarians,” and an open-ended question for further comments and suggestions. Q1 sought to answer the first two research questions through correlation:
What are the demographics of AAPI librarians? What are the major factors that influenced AAPI
librarians’ career choices?
The primary software used for Q1 was California State University, Sacramento (CSUS) licensed survey tool Skylight with https protocols. Unfortunately, the CSUS survey software license expired at the end of 2011 and the new survey software purchased was a different type and will not be ready until July 1, 2013. The authors purchased commercial software Lime Survey sanctioned by CALA and moved Q1 to Lime Survey with security license in order to continue the research. Lime Survey was specified as the backup software in the application letter to the CSUS Institutional Review Board and it satisfied guidelines to protect human subjects. If the backup software had not been identified at the beginning of the research process, the whole study would have been postponed by one or more semesters. Funding to purchase Lime Survey with the security license came from the American Library Association.
The research is considered “minimal risk” by the CSUS Institutional Review Board based on the level of risk guideline. The survey tool allowed for respondents to submit their survey anonymously. All participants were assigned an ID number and access to survey data was limited to the first author and his research assistant who held a password.
Data Analysis and Findings
Q1 was sent electronically to over 400 members in CALA and over 200 members in APALA. The collective body of over 600 members represents AAPI librarians residing in all regions in the United States. There were 91 AAPI librarians who completed the survey. The definition of “a completed survey” is that a participant viewed all pages with questions on Limesurvey.com software, but did not necessarily answer all questions. If a participant exited the survey before viewing ALL pages, it is marked as “incomplete.”
I-1. Choose your generation as an AAPI immigrant. If you are a foreign-born citizen or legal resident of the United States, you are a first generation immigrant.
The majority of AAPI librarians are first generation immigrants at 57.14%. The authors received several phone calls and one e-mail comment from participants indicating that though they were foreign-born immigrants, they chose second generation because they came as dependent children with their first generation immigrant parents. The first and second generation immigrants
are at 83.41% percent and comprise the vast majority of CALA and APALA librarians (see Table 1).
Table 1 Immigration Status
Generation Value (%)
First Generation Asian/Pacific immigrant
52 (57)
Second generation
AAPI—one of your parents is a first generation Asian/Pacific immigrant
23 (25)
Third generation
AAPI—one of your grandparents is a first generation Asian/Pacific immigrant
7 (8)
More than 3rd generation Asian/Pacific immigrant
8 (9)
Not an Asian/Pacific American(AAPI) citizen or legal resident
1 (1)
total 91 (100)
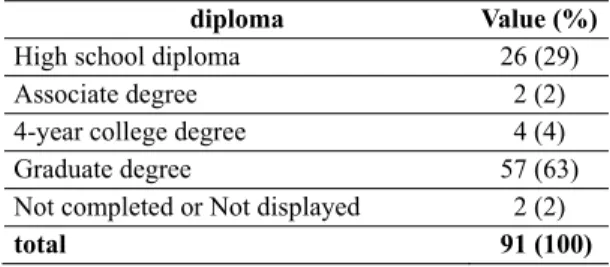
I-2. Please choose the first diploma or degree you have received in the United States or Canada. The first degree received in North America is another way to find out immigration status among AAPI librarians. It is more reliable to state that those who did not receive a high school diploma as their first degree in North America are the true first generation immigrants. About 70% of AAPI librarians received their first degree in North America after high school, and 63% received a graduate degree as their first. This would indicate that about 70% of AAPI librarians are first generation immigrants who came after age 18 (see Table 2).
Table 2 First Diploma Received in North America
diploma Value (%)
High school diploma 26 (29) Associate degree 2 (2) 4-year college degree 4 (4) Graduate degree 57 (63) Not completed or Not displayed 2 (2)
total 91 (100)
I-3. What is the total population of the city/county/ metropolitan area where you work?
Most AAPI librarians work in a metropolitan area with more than half a million population. Many of them (33%) also work in urban settings or mid-sized cities with population between 50,000 to 500,000. No AAPI librarian works in a rural area with population less than 10,000 and only 9% work in small cities with a population of less than 50,000 (see Table 3).
Table 3 Places of Residence
Population Value (%)
10,001 to 50,000 8 (9) 50,001 to 500,000 30 (33) 500,001 to 1 million 9 (10) More than 1 million 39 (43)
No answer 3 (3)
Not completed or Not displayed 2 (2)
total 91 (100)
I-4. Please select your highest education attainment Almost half of AAPI librarians have additional advanced degrees, including second master’s degrees or doctoral degrees (see Table 4). These numbers are higher than the average of 29% second master and 2% doctoral degrees for all credentialed librarians (American Library Association, 2007, p. 10).
Table 4 Highest Education Attainment
Population Value (%)
ALA-MLS only 43 (47)
ALA-MLS plus a second master degree 37 (41) ALA-MLS plus a doctoral degree 6 (7) More than 1 million 39 (43) No graduate degree 2 (2) Not completed or Not displayed 3 (3)
total 91 (100)
I-5. Number of years you worked as a professional librarian, IT professional or other information professional.
The largest segment (33%) of AAPI librarians has less than 5 years working experience. This group also includes those who do not have jobs, but are active as either CALA or APALA members. The second largest group (22%) of AAPI librarians has over 20 years of working experience. The phenomenon of the two largest groups being concentrated at the beginning of their career life (less than 5 years) and in the maturing phase of their career life (over 20 years) can be called the dumbbell effect and will be discussed later (see Table 5).
Table 5 Years as Professional Librarians
Years Value (%) 0-4 30 (33) 5-9 11 (12) 10-14 13 (14) 15-19 14 (15) 20 or more 20 (22)
Not completed or Not displayed 3 (3)
total 91 (100)
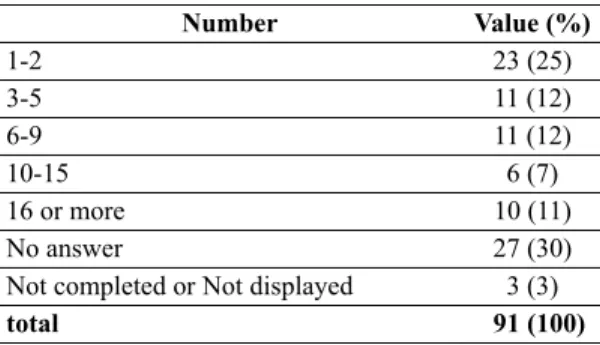
I-6. Number of SCHOLARLY publications, including but not limited to journal articles, books, book chapters, book reviews, annotated bibliographies, of which you are an author or a co-author.
Most academic librarians need to have scholarly publications in order to continue employment and more AAPI librarians are in academic libraries than public or school libraries as discussed earlier. Over two thirds of AAPI librarians have published. Eighteen percent of AAPI librarians have six or more publications. However, more than 30% of participants did not answer this question. The original version of the survey had an option of “no publications yet” as a choice, but it was lost when the survey was transferred from California State University Skylight software to the Limesurvey software. The option of “no publications yet” should be kept as 33% of AAPI librarians are employed less than 5 years. It normally takes 3-5 years to publish in any professional journals (see Table 6).
Table 6 Number of Scholarly Publications
Number Value (%) 1-2 23 (25) 3-5 11 (12) 6-9 11 (12) 10-15 6 (7) 16 or more 10 (11) No answer 27 (30)
Not completed or Not displayed 3 (3)
I-7. How many times have you made VOLUNTARY professional job changes? Please note, a move-up in rank, i.e. from Assistant Librarian to Associate Librarian in the same position is NOT a job change. But a position change within the same institution should be considered a job change.
Almost 70% of AAPI librarians made voluntary job changes 1 to 4 times in their career life while 20% did not make any job changes (see Table 7).
Table 7 Number of Voluntary Job Changes
Number Value (%)
Never 18 (20)
1 or 2 times 39 (43)
3 or 4 times 24 (26)
5-6 times 2 (2)
More than 6 times 3 (3)
No answer 2 (2)
Not completed or Not displayed 3 (3)
total 91 (100)
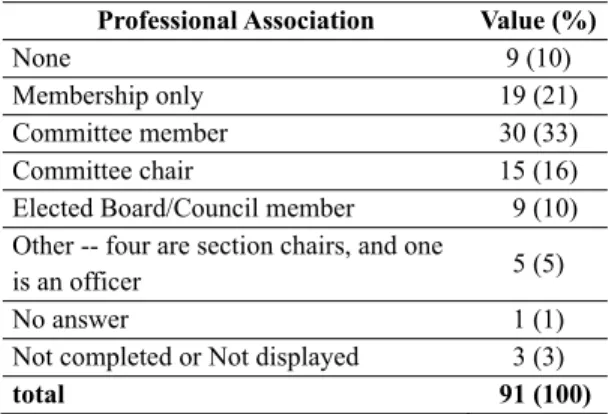
I-8. What is the highest position you have held in national library/information science organizations, such IFLA, ALA, or its divisions, PLA, ACRL, LITA etc. Please do not include CALA, APALA or regional community organizations here.
Only 10% of AAPI librarians are not involved in any national/international professional organizations. Over 50% are or have been involved in committees and 20% are serving or have served as committee chairs. Over 10% of AAPI librarians have experience as elected library board/council members (see Table 8).
Table 8 Professional Association Involvement
Professional Association Value (%)
None 9 (10)
Membership only 19 (21) Committee member 30 (33) Committee chair 15 (16) Elected Board/Council member 9 (10) Other -- four are section chairs, and one
is an officer 5 (5)
No answer 1 (1)
Not completed or Not displayed 3 (3)
total 91 (100)
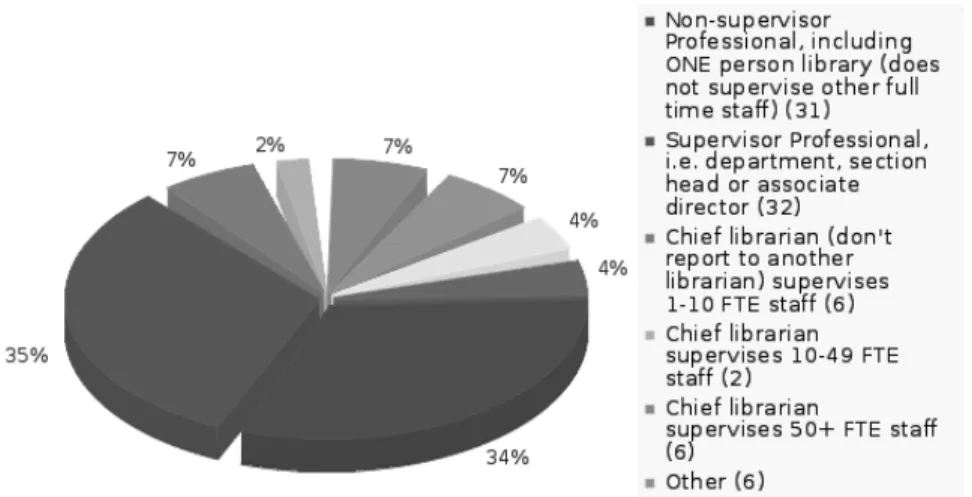
I-9. What is the highest professional position you have held in North America?
Non-supervisor Professional (does not supervise other full time staff) =34% + 2% from Others = 36%
Supervisor Professional, i.e. department, section head or associate director =35%+5% from Others = 40%
Chief librarian supervises less than 10 FTE staff = 7%
Chief librarian supervises 10-49 FTE staff =2% Chief librarian supervises 50+ FTE staff =7% Others = 5% are supervisor librarians + 2 % are
LIS school faculty
Among AAPI librarian, supervisor professionals are the largest group at 40%. The second largest group consists of non-supervisor professionals at 36%. Seven percent of AAPI librarians who are chief librarians supervise 50 or more staff members. AAPI chief librarians who supervise 10-49 staff are at 2% (see Figure 2).
Figure 2 Highest Job Title Ever Held
I-10. What is your level of involvement within your library and the parent institution, i.e. an academic library’s parent organization will be the university. Choose ALL that apply!
Served on library committees =63% Served as library committee chair =40% Served on parent institution’s committees =41%
+ 3% from Others = 44%
Served as parent institution’s committee chair =9% Served on Asian/Pacific employees association =15% Other: 2% served on union/guild board and 1% served on statewide library committee, both will be put into parent institution’s committees. 4% served on other community board, which will be count in question I-12.
Q1 survey questions I-10, I-11 and I-12 allow participants to choose “all categories that apply”, thus the
total percentage from sub-categories can be more than 100%. A very active academic AAPI librarian may serve on library committees, as library committee chairs, campus committees, as campus committee chairs, and also be involved with Asian American employees associations. In this case, all five sub-categories would be checked. Almost two out of three AAPI librarians participate in library committees, 40% served as chairs and 44% served on parent institution’s committees. But less than 10% served as parent institution’s committee chairs. There are some differences among numbers quoted in this paragraph and percentages shown in Figure 3 because all responses in the “other” categories were manually examined by authors and some were assigned to appropriate categories. For academic librarians, parent institution’s committees include campus wide committees and the campus committees are not necessarily related to the library.
Figure 3 Institutional Involvement
I-11. What is your level of involvement with the local government and school district? Choose ALL that apply!
Regularly participate in general elections =55% Regularly participate in primary election and other
local elections =42%
Attended, at least once, school district/college board meetings =13%
Attended, at least once, city/county/local government council/board meetings =16% Appointed or elected to serve on local government
or school district council/board =2%
Non-citizen and not eligible to vote=11% More than 50% of AAPI librarians are regular voters and 42% regularly participate in primary and local elections. Only 13% of AAPI librarians have attended, at least once, school district or college board meetings and 16% have attended, at least once, a local government meeting. Two percent of AAPI librarians have served or currently serve as either elected or appointed government board members. Eleven percent of AAPI librarians are legal residents, but not United States citizens (see Figure 4).
I-12. What is your involvement with regional or local communities? Choose ALL that apply!
Board/Council member of local Asian community organizations, i.e. Chinese school = 13% Board/Council member of a community organization,
i.e. Homeowners association, local church =10% Board/Council member of Asian professional
organizations, i.e. CLA, CALA, APALA =27% Board/Council member of professional organizations,
i.e. Toastmasters International, Friends of the library = 9%
Board/Council member of a hobby club, sports, music, cooking =2%
Others, 7% members of ping-pong, dance, chess, bridge clubs, no board.
Twenty seven percent (27%) of AAPI librarians serve on Asian professional organization boards, such as CALA and APALA boards; 13% serve on local Asian community organization boards, such as Chinese schools or Asian churches; 9% serve on other local community boards; and 2% on hobby clubs (see Figure 5).
Figure 5 Community Involvement
Q1 survey question I-10, I-11, and I-12 are manually assigned Likert scale 1 to 5 with 5 being the most important. The ANOVA analysis will be used to measure whether means between groups in question I-9 (chief librarian, supervisor librarians and non-supervisor librarians) are significantly different in answering question I-10 to I-12. Again, this will be addressed in a separate paper.
The second group of questions (II-1 to II-6) in Q1 survey explores perceived factors that influence AAPI librarians’ pathways toward top leadership positions. Similarly, a Likert scale from 1 to 5 is used and choices in
question II-1 to II-3 were automatically assigned a Likert scale number. In the following paragraph, the first percentage is the sum of the two categorical responses of “least important” and “not important” with Likert scale of 1 and 2. The second percentage is the sum of categorical responses of “important” and “most important” with the Likert scale of 4 and 5. The percentage of those who ascribed to the category of “neutral” with Likert scale of 3 is the difference between 100% and the sum of Likert scale 1, 2, and 4, 5. See II-1c below as an example.
II-1. From your perception, how important are these factors in achieving top library leadership
positions? The least important is 1 and the most important is 5.
a. In addition to MLS, a second master or a doctoral degree – 27% vs. 45%
b. More scholarly publications and professional presentations – 20% vs. 46%
c. Active involvement in ALA and other national professional organizations – 15% not important vs. 58% important, and neutral is 100% -15% -58% = 27%
d. Service on library’s committees, especially as chairs – 15% vs. 59%
e. Service on parent institution’s committees, especially as chairs – 13% vs. 62%
f. Active involvement in local government – 41% vs. 12%
g. Active involvement in local Asian/Pacific community organizations – 39% not important vs. 15% important
h. Traditional Asian culture of hard working and no complaining – 54% vs. 12%
i. During ALA Presidential election, ask each candidate on issues related to AAPI leaderships achievement gap – 41% vs. 24%
j. A national initiative to look at equal opportunities in promotion of minority workers – 22% vs. 36% A greater percentage of AAPI librarians perceive that additional advanced degrees, publications, active involvement in ALA and other professional organizations, committee work and serving as committee chairs are important to attaining leadership positions. On the other hand, government involvement, local community involvement, the traditional Asian cultural value of working hard and the political empowerment to challenge ALA presidential candidates with issues specifically related to AAPI have less perceived importance. Slightly more (36% vs. 22%) people perceive a national initiative to promote minority workers as important related to AAPI leadership issues.
II-2. Please indicate your level of agreement from “1--Strongly Disagree” to “5--Strongly Agree” with the following statements:
a. Native born Asian/Pacific librarians have a better chance than first generation immigrants to enter the leadership rank – 23% vs. 40%. The first percentage is the sum of strongly disagree and disagree, and the second percentage is the sum of agree and strongly agree. The rest 100 -23-40=37% are neutral.
b. Asian/Pacific librarians are perceived by the hiring authorities as knowledgeable and technical, but not as good leaders – 24% vs. 44% c. Asian/Pacific librarians have LESS CHANCE
to be promoted to top leadership positions than other minority librarians – 26% vs. 42% d. Asian/Pacific librarians lack leadership role
models/mentors for achieving top leadership positions – 15% vs. 49%
e. The lack of AAPI librarians in top leadership roles can’t be explained by job-related factors, i.e. education, publication, and years of experience – 16% vs. 43%
f. The degree of AAPI librarians under -representation is greater at higher leadership levels than at lower levels – 10% vs. 60% g. The diversity programs in my institution often
exclude AAPI because they are not considered under-represented minorities – 32% vs. 35% h. Media attention to AAPI leadership under
-representation will improve chance of promotion for ALL minorities – 9% vs. 61%
i. Increasing AAPI voting power in all levels of elections will improve AAPI leadership achievement gap – 10% vs. 52%
In most cases, more AAPI librarians agree rather than disagree with the statements above. Question II-2g is almost evenly divided between ‘disagree’ and ‘agree’ in regard to the impact of diversity programs on AAPI
librarians. Some questions have far more consensus of agreement. For example, 60% of AAPI librarians believe the extent of AAPI librarians’ under-representation is greater at higher leadership levels than at lower levels, while only 10% disagree. Similarly, Question II-2h and II-2i have 5 to 6 times more agreement than disagreement related to the importance of media attention to AAPI leadership under-representation, and increasing AAPI voting power during elections.
II-3. Assuming you are qualified for a higher leadership position in the next five years, please indicate your likelihood of applying from “1--Very Unlikely” to “5--Very Likely” with the following conditions:
a. The leadership position is within your current institution – 24% vs. 45%
b. The leadership position is in the same region and you do not have to move – 18% vs. 50% c. The leadership position is outside your region,
and you will move to a metropolitan area NO SMALLER than your current location – 38% vs. 24%
d. A higher leadership position in any location after my children are independent – 31% vs. 36%
e. A higher leadership position in any location after I retire from current position – 45% vs. 22%
f. A higher leadership position without conditions – 39% vs. 26%
Half of the AAPI librarians are likely to assume a higher leadership position in the same region without relocation, but only 45% are likely to take a leadership position within the same institution. AAPI librarians are not willing to move, even to a bigger city or after retirement. Only slightly more AAPI librarians are likely to take a higher position in any location after their children are independent.
The descriptive statistics provide a general picture of AAPI librarians’ demographics, education, professional achievement, institutional, political, and community involvement and perceptions and willingness to take leadership roles. However, the descriptive statistics do not yield any data related to differences in survey responses among AAPI chief librarians, supervisor librarians and non-supervisor librarians. The descriptive statistics also do not allow us to draw a correlation between highest professional positions ever held and other characteristics and activities, such as advanced education beyond MLS, publications, community and institutional involvement. Correlation, regression, and other advanced statistics will be deployed in a separate paper.
Question I-5 shows that over 33% of AAPI librarians have more than 15 years work experience and another 33% have less than 5 years experience. The authors followed up by checking the MLS degree recipients by race/ethnicity for the last 10 years and the result is shown in figure 6.
Figure 6 MLS Conferred by Race/Ethnicity 1999-2009
Source: The authors compiled data from Digest of Education Statistics published by National Center Education Statistics.
The AAPI population who received the MLS increased from 100 in 1999 to over 250 in 2009, but unlike other professional or doctoral degrees where AAPI accounted for more than half of all minority degree holders, there are less AAPI MLS recipients compared with Blacks and Hispanics since 2007. Hispanics in 2009 had more MLS recipients than any other minority groups. International students who received MLS in the last 10 years also decreased from over 150 in 1999 to just over 100 in 2009 (the fifth Foreign curve). From previous studies and the survey question I-1 and I-2, almost two-thirds of AAPI librarians received a graduate degree as their first diploma in North America; this indicates that the majority of AAPI
librarians came to the United States as first generation immigrants after the enactment of Immigration Act of
1965. However, the trend for international students
choosing MLS is declining as shown above. Overall international students in the United States from Asia increased from 135,657 in 1999 to 318,719 in 2011, and Asian students account for over 70% of all international students F-1 visa issued in 2011. The authors checked the Nonimmigrant Visa Statistics published by the United States Department of State (2011) at http://travel.state.gov/ visa/statistics/nivstats/nivstats_4582.html, and compiled the summary table 9.
Table 9 F-1 Student Visa Statistics 1999 to 2011
Place/Year 1999 2001 2003 2005 2007 2009 2011 China 16,303 25,218 16,169 21,642 39,535 81,842 153,026 Taiwan 14,709 15,821 11,490 15,488 14,973 10,978 11,200 Hong Kong 592 1,189 1,164 2,003 2,325 2,221 2,681 India 15,286 24,106 19,152 20,173 34,472 26,890 25,649 Japan 33,762 32,237 24,825 24,552 21,900 16,423 16,811 South Korea 20,883 28,977 28,695 35,310 45,915 39,040 45,638 Asia Total 135,657 164,376 122,660 143,448 195,140 220,574 318,719 Grand Total 262,542 293,357 215,695 234,890 298,393 331,208 447,410
Although more Asian international students came to the United States as college or graduate students in the last 10 years, fewer of them chose librarianship as their profession. The future growth of AAPI librarians relies primarily on
native born Asian Americans and Pacific Islanders. The authors predict that the foreign born first generation AAPI librarians will decrease, and the percentage of AAPI librarians will decrease as well in the decade of 2011 to 2020.
Discussion and Recommendation
Q1 survey question I-1 to I-9 asked AAPI librarians what have they achieved so far in their library careers, and question I-10 to I-12 asked how AAPI librarians’ involvement outside their daily jobs might impact their career paths.In survey question I-9, the category of chief librarians who do not report to another librarian and who supervise less than 10 staff raised some questions during the survey. Almost all school librarians are in this category; they do not report to another librarian and they supervise either some part-time library technicians or student assistants. Very small special libraries may fall into this category as well. For the purpose of future studies, AAPI chief
librarians who supervise 10+ people and 50+ will be grouped into one category. Questions I-9 have four groups for statistical purpose, (1) non-supervisor librarians, (2) supervisor librarians, (3) chief librarian with less than 10 staff, and 4) chief librarians overseeing 10+ staff. This allows enough data in each of four groups in question I-9 for more sophisticated statistical analysis, such as cross tabulation analysis with independent variables in questions I-1 to I-8.
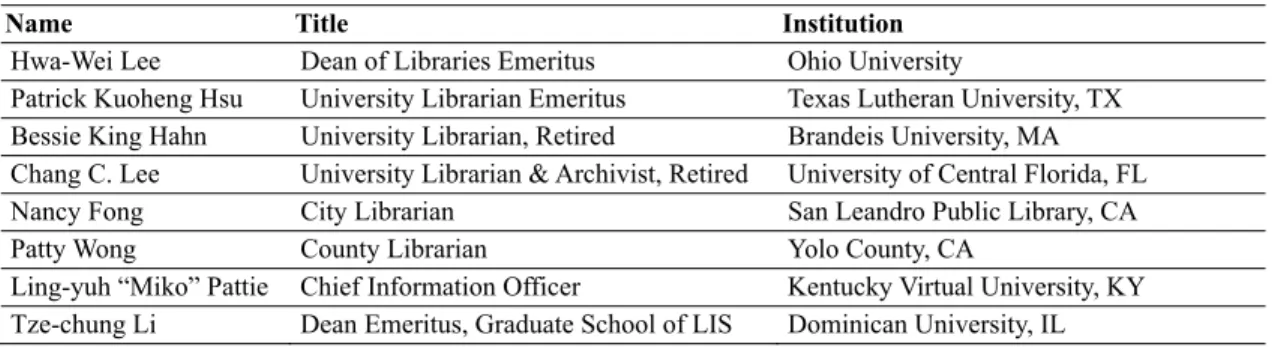
From Q1 survey question II-4 “Please write the names and contact information of any current or retired AAPI chief librarians,” the following AAPI chief librarians are identified. This allows a potential in-depth study with a dozen AAPI chief librarians (see Table 10).
Table 10 Chief Librarians among CALA Members
Name Title Institution
Hwa-Wei Lee Dean of Libraries Emeritus Ohio University
Patrick Kuoheng Hsu University Librarian Emeritus Texas Lutheran University, TX Bessie King Hahn University Librarian, Retired Brandeis University, MA Chang C. Lee University Librarian & Archivist, Retired University of Central Florida, FL Nancy Fong City Librarian San Leandro Public Library, CA Patty Wong County Librarian Yolo County, CA
Ling-yuh “Miko” Pattie Chief Information Officer Kentucky Virtual University, KY Tze-chung Li Dean Emeritus, Graduate School of LIS Dominican University, IL
The Q1 Section II questions asked about the perceptions among AAPI librarians. To measure the difference involving activities outside immediate jobs and different perceptions among AAPI chief librarians, supervisor librarians and non-supervisor librarians requires statistical method beyond the scope of this study. In addition, to further study a dozen AAPI chief librarians and find out why there have not been enough AAPI in top library leadership positions require more than a quantitative method. Qualitative survey Q2 of AAPI chief librarians identified above will be discussed in a separate paper.
Conclusion
The phenomenon of low representation of highly educated AAPIs in top leadership positions in higher
education, with a focus on librarianship, has never been addressed. This study is part one of a year-long research on AAPI librarian leadership achievement gap and it begins with demographics and descriptive analysis of CALA and APALA members. The authors reveal the realities behind the leadership achievement gap among AAPI using independent variables such as generations as immigrants, education attainment, professional achievement, institutional, political, and community involvement and perceptions and willingness to take leadership roles. Two thirds of AAPI librarians are first generation immigrants and they came to the United States after completing their 4-year college degrees overseas. Almost all AAPI librarians have at least a MLS and about half also have a second master or a doctoral degree. Almost half of AAPI librarians live in big metropolitan
areas with population over one million and over 90% live in cities with population of more than 50,000. More than two-thirds of AAPI librarians had scholarly publications and 80% made voluntary job changes. Over one-third of AAPI librarians have over 15 years professional experience, while the other one-third only have less than 5 years experience. Most AAPI librarians believe that active involvement in professional organizations and serving on a committee are crucial in reaching top leadership positions. Almost 50% of AAPI librarians are either supervisors or chief librarians supervising less than 10 people, and only 9% AAPI librarians have reached top leadership positions in librarianship, supervising 50 or more staff members.
Acknowledgements
We would like to thank two librarians at California State University at Sacramento (CSUS). Education Librarian Betty Ronayne edited our writing tirelessly and transformed more technical writing from multiple authors into plain English. System Librarian Bin Zhang provided technical assistance in conducting the survey in secure mode on Limesurvey, the commercial software after CSUS lost its Flashlight survey software license in fall semester 2011.
The research was partially funded by the ALA Diversity Office and by a California State University faculty development grant. The authors presented partial research findings at the 2012 ALA Annual Conference in Anaheim, California.
References
American Council on Education. (2007). The American college president: 20th anniversary. Washington, DC: American Council on Education.
American Library Association. (2007). Diversity counts. Chicago, IL: ALA Office for Research and Statistics. Birnbaum, R., & Umbach, P.D. (2001). Scholar, steward,
spanner, stranger: The four career paths of college
presidents. The Review of Higher Education, 24(3), 203-217.
Chantrill, C. (2011). Government spending details: Fiscal year 1850. Retrieved from http://www. usgovernmentspending.com/year1850_0.html. Department of Homeland Security. (2010). Persons
obtaining legal permanent resident status by region and selected country of last residence: Fiscal years 1820 to 2010. Yearbook of Immigration Statistics: 2010 (Table2). Washington, DC: Department of Homeland Security.
Fong, T.P. (2008). The contemporary Asian American experience: Beyond the model minority. Upper Saddle River, NJ: Pearson Prentice Hall.
Gardner, R., Robey, B., & Smith, P.C. (1985). Asian Americans: Growth, change, and diversity. Population Bulletin, 40(4), 2-44.
Hing, B.O. (1993). Making and remaking Asian America through immigration policy 1850-1990. Stanford, CA: Stanford University Press.
Hobbs, F. & Stoops, N. (2001). Demographic trends in the 20th century: Census 2000 special report. Washington, DC: United States Census Bureau.
Hutchinson, E.P. (1981). Legislative History of American Immigration Policy 1789-1965. Philadelphia: University of Pennsylvania Press.
Immigration and Naturalization Service (1982 - 2000). Statistical yearbook of the Immigration and Naturalization Service. Washington, DC: The service. Li, T.C. (1979). A profile of Chinese-American librarians.
Journal of Library and Information science, 5(1), 43-50. Liu, M. (2000). The history and status of Chinese
Americans in librarianship. Library Trends, 49(1), 109-137.
National Center for Education Statistics. (2011). Digest of education statistics 2010. Washington, DC: Department of Education.
National Science Foundation (2010). Doctorate recipients from United States Universities: Data Tables. Arlington, VA: National Science Foundation.
Rhode, P.W. (2002). Gallman’s annual output series for the United States, 1834-1909. NBER Working Paper, 8860. Ruan, L., & Xiong, J.A. (2008a). Chinese American
librarians in the 21st century: Profile update. Chinese Librarianship: An International Electronic Journal, 25. Retrieved from http://www.iclc.us/cliej/cl25RX1.pdf Ruan, L., & Xiong, J.A. (2008b). Career choices and
career advancement: Chinese American librarians in the 21st century. Chinese Librarianship: An International Electronic Journal, 25. Retrieved from http://www. iclc.us/cliej/cl25RX2.pdf
Ryu, M. (2008). Minorities in higher education 2008: Twenty-third status report. Washington DC: American Council on Education.
Temin, P. (1972). The Anglo-American business cycle, 1820-1860. Working Paper of Department of Economics, 84, 1-27.
United States Census Bureau. (2007). 2005-2007 American community survey 3-year estimates. Washington, DC: United States Census Bureau. United States Census Bureau. (2011a). Statistical abstract
of the United States. Washington, DC: United States Census Burea.
United States Census Bureau. (2011b). 2010 census shows America’s diversity. Washington, DC: United States Census Bureau.
Wang, P.H. (1975). Legislating “normalcy”: The immigration act of 1924. Saratoga, CA: R and E Research Associates. Yang, Z.Y. (1996). Chinese American librarians job
survey. Journal of Educational Media and Library Sciences, 34(2), 111-123.
Zhou, J.Z. (2003). Asian American librarians and Chinese American librarians: Their impact on the library profession and on Asian communities. Journal of Library and Information science, 29(2), 14-21.
Zhou, J.Z. (2010, October). Immigration filtering theory: High education attainment of the 1st generation Asian and black immigrants and their children/grandchildren. In 17th Annual Multicultural Education Conference- Poster session, Symposium conducted at the University Union, Sacramento, CA.
Zhou, J.Z. (2012, June). The low representation in leadership position of highly educated Asian/Pacific islander librarians. In American Library Association Annual Conference, Anaheim, CA.