PLEASE SCROLL DOWN FOR ARTICLE
This article was downloaded by: [National Taiwan University]On: 3 September 2009
Access details: Access Details: [subscription number 908165602] Publisher Taylor & Francis
Informa Ltd Registered in England and Wales Registered Number: 1072954 Registered office: Mortimer House, 37-41 Mortimer Street, London W1T 3JH, UK
Fullerenes, Nanotubes and Carbon Nanostructures
Publication details, including instructions for authors and subscription information:
http://www.informaworld.com/smpp/title~content=t713597253
Characterization of KC60Obtained via a Potassium Carbonate Route
Ilias I. Khairullin ab; Zheng-Drong Tsao a; Lian-Pin Hwang a
a Department of Chemistry, National Taiwan University, Institute of Atomic and Molecular Sciences, Academia Sinica, Taipei, Taiwan, Republic of China b Department of Thermophysics, Uzbekistan Academy of Sciences, Tashkent, Republic of Uzbekistan (CIS).
Online Publication Date: 01 December 1997
To cite this Article Khairullin, Ilias I., Tsao, Zheng-Drong and Hwang, Lian-Pin(1997)'Characterization of KC60Obtained via a Potassium Carbonate Route',Fullerenes, Nanotubes and Carbon Nanostructures,5:7,1507 — 1530
To link to this Article: DOI: 10.1080/15363839708013335 URL: http://dx.doi.org/10.1080/15363839708013335
Full terms and conditions of use: http://www.informaworld.com/terms-and-conditions-of-access.pdf
This article may be used for research, teaching and private study purposes. Any substantial or systematic reproduction, re-distribution, re-selling, loan or sub-licensing, systematic supply or distribution in any form to anyone is expressly forbidden.
The publisher does not give any warranty express or implied or make any representation that the contents will be complete or accurate or up to date. The accuracy of any instructions, formulae and drug doses should be independently verified with primary sources. The publisher shall not be liable for any loss, actions, claims, proceedings, demand or costs or damages whatsoever or howsoever caused arising directly or indirectly in connection with or arising out of the use of this material.
FULLERENE SCIENCE AND TECHNOLOGY, 5(7), 1507-1530 (1997)
CHARACTERIZATION OF KC60 OBTAMED VIA A POTASSIUM CARBONATE ROUTE
Ilias I. Khairullin,?) Zheng-Drong Tsao and Lian-Pin Hwang. *)
Department of Chemistry, National Taiwan University, and Institute of Atomic and Molecular Sciences, Academia Sinica,
P.O. Box 23-34, Taipei, Taiwan, Republic of China
ABSTRACT
KC60 synthesized by high temperature annealing of mixture of c60and K&03
has been characterized by EPR,
NMR
and differential scanning calorimetry methods. The rich phase diagram with polymeric and dimer phases previously elaborated for KC60 is obtained in present work as well. This suggests that alkaline carbonates can be efficiently used in preparation of C60-based polymer materials where C ~ O molecules are charged by alkaline atoms. Another important outcome of present study is that despite high temperatures and presence of oxygen released from KzCO3, EPR andNMR
spectra did not exhibit signals which might be referred to hllerene epoxides or related species.*
To whom correspondence should be addressed.t
On leave from Department of Thermophysics, Uzbekistan Academy of Sciences, Katartal Str.28, Chilanzar C, Tashkent, 700135, Republic of Uzbekistan (CIS).1507
Copyright Q 1997 by Marcel Dekker, Inc.
1508 KHAIRULLIN, TSAO, AND HWANG
1. Introduction
Recently considerable attention is given to A& ( A =K, Rb, and Cs) hllerides which demonstrate interesting phase diagrams upon various cooling and heating protocols. The monomeric phase with the fcc rocksalt crystal structure exists in the high temperature region ( T > 500 K).IJ At slow cooling, it transforms at T < 400 K into the phase of the orthorhombic crystal where C ~ O molecules are covalently bonded to form polymeric chains.'-' For
KCm,
the intermolecular distance in direction of a polymeric chain is 9.1 1 The metallic nature of the polymeric phase has been established by temperature-independent spin susceptibility XEPR in EPR experiments4*' and Korringa law behavior inN M R
experiments.' At continuos heating up to about 450 K the polymeric phase return to the thermodynamically stable high temperature monomeric phase through so- called intermediate phase, which is characterized by the equilibrium state a-
CSO
+
A3C60 (a-60 stands for A&o with x << I).'' Upon quenching from about500 K down to T < 270 K, the high temperature monomeric phase transforms into the phase with C 6 0 molecules bonded in dimers."*'2 For a dimer in KC60, the intermolecular distance is 9.34
A.
''
The dimer phase has the orthorhombic crystal structureI2 and it is a diamagnetic insulator at lowtemperature^.'^
This phase is unstable competing with the polymeric phase and the equilibrium state a- c60+ A ~ C ~ O . * ~ ' ~ With continuos heating the dimer phase transforms sequentially tothe monomeric fcc phase then to the polymeric phase and again to the monomeric
CHARACTERIZATION OF KCm 1509
fcc phase.’ Thus, rich phase diagrams of AICm fullerides may suggest broad potentials in variation of characteristics of the C~O-based materials.
Alkaline carbonates have been used previously to obtain superconducting fUllerides of surprisingly low air-~ensitivity.’~ It is natural that they might be likewise applied for producing A ICm compounds. However, whether by-products
of the decomposition of alkaline carbonates will affect polymerization or dimerization processes in AIC60 remained doubtful. One would note that Cm and oxygen can form C600 epoxides and C1200 dimers.”-” CsOO is prepared mostly via solution chemistry,” but synthesis via solid-state thermal chemistry are mentioned as well.” C1200 is typically synthesized by heating a solid mixture of C60 and CaoO.’* On that account, hllerene epoxides and dimers might be expected during the thermal decomposition of alkaline carbonates. Once such species have been appeared, they might influence a unique polymorphism ofA What makes CS0O interesting yet in connection with A1C60 is the same ability to produce polymeric structure.’”” The polymerization of CsOO occurs under the electrochemical Since metal atoms in alkaline fullerides are excellent electron suppliers, the formation of new type polymeric chains, distinct from those of
A 1C60, might be considered.
Thus, purposes of present study were twofold. We intended either to prove a particular usefblness of alkaline carbonates for production A I C ~ O or to point to a new possibility for [(C60)”0]” species in alkaline fullerides. For this, the mixture of C60 and KzCO3, with the stoichiometric ratio to produce KC60, was annealed at
1510 KHAIRULLIN, TSAO, AND HWANG
high temperatures in vacuum. The obtained material was examined by EPR,
NMR
and differential scanning calorimetry (DSC) methods. Specifically,EPR
technique has been proven to be exceptionally useful tool in elucidation of phase transitions in KC60.4’8’10 On the other hand, considerable quantities of [ c 6 0 0 ] ” and [ C I Z O O ] ~species will obviously exhibit distinct EPR ~ p e c t r a ” ~ ’ ~ and will likely modify the phase diagram of KC60.
2. Experimental
C60 (of 99.9% purity) and K2CO3 were purchased from Material and Electrochemical Research Corp. (Arizona, USA) and from Sigma Chemical Co. (St. Louis, USA) respectively. K2C03 was dried for 24 hours at 380 K under a dynamic vacuum of about 100 torr. A mixture with a molar ratio of Cso: K2C03 = 1 : 1 was placed into a quartz tube and heated for 1 hour at 420 K
under a dynamic vacuum 2 5x10⁻⁵ torr. Afterward, the evacuated tube was sealed
out and placed in a furnace for high-temperature treatments from 520 K to 773 K. For EPR measurements samples were prepared in quantities of 10-15 mg in 4 mm diameter tubes, while for DSC and
N M R
measurements samples were prepared in quantities of about 100 mg in wider tubes. We should note in connection with the preparation procedure that heating in a dynamic vacuum would perhaps completely remove gas products of the reaction. However, the goal of this study is indeed to examine this system under much tightened conditions. Moreover, in a dynamicCHARACTERIZATION OF KC,g 151 1
vacuum some part of the powder mixture can be forced out from the tube by the gas flow during the decomposition of K2CO3, and this may change the stoichiometric ratio of the final compound.
EPR spectra were measured on an X-band EPR spectrometer Bruker ESP- 300E using a 100 kHz modulation frequency. A concentration of spins was determined with reference to that of the 2,2-diphenyl-l-picrylhydazyl (DPPH) sample of known spin content. A g factor was measured with reference to
g = 2.0036 of DPPH using a Bruker double resonator. A peak-to-peak linewidth
(AHw)
of the derivative of the EPR absorption was measured with aNMR
Gaussmeter Bruker ER035. Low-temperature measurements were carried out with the N2 gas-flow cryostat.NMR spectra were recorded with a Bruker MSL-500 (1 1.7
T)
spectrometer at the "C frequency of 125.5 MHz.A
"C shift of tetramethylsilane was used as a reference for a chemical shift. The temperature was varied within the range 240- 360K.
DSC measurements were performed on a Du Pont 9900 Differential Scanning Calorimeter with the temperature varied over the range 150-500 K with the heating rate 10 Wmin. For precaution, the sample was placed into the DSC holder under argon atmosphere in the glove box, despite the fact that KCm is a fairly stable in air.20 The holder was exposed to the ambient atmosphere only for a short time necessary to press-in and transport it into the calorimeter.
1512 KHAIRULLIN, TSAO, AND HWANG
3. Results and Discussion.
3.1. Electron Paramagnetic Resonance.
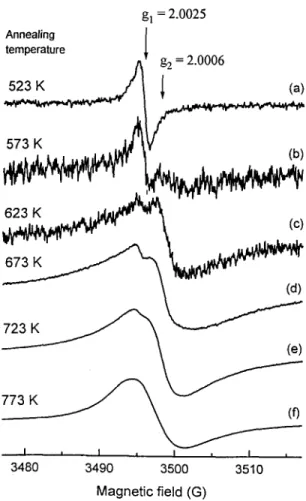
Figure 1 shows evolution of the room temperature EPR spectrum of the mixture of c.50and KzCO3 with the annealing T gradually increasing from 523 K to
773 K. The sample was annealed for 10 hours at each indicated temperature and slowly cooled down to the room temperature to obtain EPR spectrum.
The sample heated at T < 523 K demonstrates a single narrow line with g = 2.0025 and AHpp = 1.1 G (Fig. la). An integrated intensity corresponds to the
concentration of spins of order of 10'' spins per mol. This line is associated with intrinsic, molecular oxygen induced
radical^^'-^^
and can be essentially reduced in intensity by heating at higher t e r n p e r a t ~ r e s . ~ ~ * ~ ~ In our experiment its intensity becomes minimal at about 623 K (Fig. lc), but begins to grow again with firther increase in the annealing T (Figs. ld,e). The growth we relate to additional C6: radicals caused by the molecular oxygen released with the decomposition of K2CO3. The C600 epoxide would not show an EPR signal if it is neutral, or would show a signal with g of about 1.997'' if it is negatively charged by potassium.The appearance of a much broader signal indicates the formation of the potassium doped c60product (Figs. lc-f). For the sample heated at 723 K, the
broad signal (Fig. le) is quite strong, with g = 2.0006(2), AHpp = 6.5 G and integrated intensity of three order in magnitude larger than that of the 523 K annealing. However, the strongest EPR signal with g = 2.0006, AHpp = 6.7 G and with a lesser contribution of the g=2.0025 component is obtained at 773 K
CHARACTERIZATION OF KC60 1513 g, = 2.0025
I
g, = 2.0006 Annealing temperature (4 I I 3480 3490 3500 3510 Magnetic field (G)FIG 1
-
Evolution of the room temperature EPR spectrum with an increasing annealing temperature for the 1: 1 stoichiometric mixture of c60 and K3C, placedinto the quartz tube sealed in-vacuo. The mixture was annealed at each indicated temperature for 10 hours and slowly cooled down to room temperature to obtain EPR spectrum. An amplifier receiver gain and integrated intensity (in arbitrary units) were as follows: (a) 1 ~ 1 0 ~ and 0.324, (b) 1 ~ 1 0 ~ and 0.312, (c) 1 ~ 1 0 ~ and
1.373, (d) 2 . 5 ~ 1 0 ~ and 17.02, (e) 1x10’ and 42.36, ( f ) 1 . 2 5 ~ 1 0 ~ and 341.88.
1514 KHAIRULLIN, TSAO, AND HWANG (Fig. If). Since the EPR spectral shape and parameters did not significantly change with hrther increase of the annealing T, we dwell on the sample treated at 773 K.
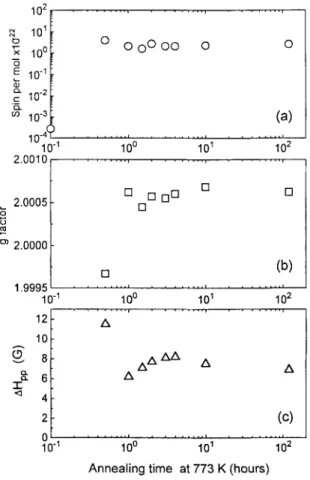
Variation of room temperature EPR parameters upon annealing time at 773 K is presented in Fig. 2, where each experimental point is obtained with the slowly cooled sample. It is remarkable that the concentration of spins reaches its maximal value, of order of 10'' spins per mol, after only 30 minutes of the heating (Fig. 2a). The dramatically growth in intensity indicates that the decomposition of KzCO3 and process of electron charge transfer from K to CSO complete during sufficiently short times. Besides, the polymeric phase is not formed yet since the g factor of
1.9997 (Fig. 2b) is a characteristics of the localized c6O-ion.25s26 It needs longer
heating times to obtain a homogeneous compound, in which the polymeric phase with a higher g factor can be formed under the slow cooling. In our case, EPR parameters get saturated after about 10 hours and do not apparently change during about 5 days of continuos heating (Fig. 2). Experimental data presented below are obtained with samples synthesized at 773 K for 5 days namely.
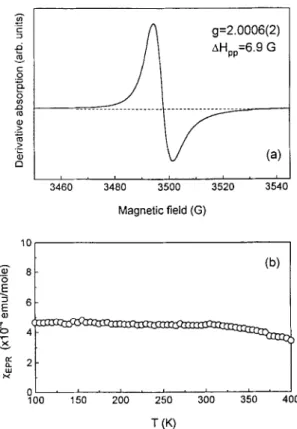
First we probe our presumed KC60 for the polymer orthorhombic phase which should demonstrate metallic For this, the sample was re-heated at 573 K for 90 min and slowly cooled down to the ambient temperature. An EPR spectrum with g = 2.0006 and Mpp = 6.9 G has a Dyson type lineshape, which
normally reflects metallic feature (Fig. 3a).27 Another evidence for the polymeric phase we find in a perfect match of our g factor and linewidth with those published for such phase." From the integrated intensity and with the assumption of
CHARACTERIZATION OF KCho I515
*
2 , , , , , , , , , , , , , , , , , , , , , ,( c )
010' 100 10' 102
Annealing time at 773 K (hours)
FIG 2
-
EPR parameters versus time of annealing at fixed temperature 773 K for the 1 : 1 stoichiometric mixture of C,X and K2C03 in the tube sealed in-vacuo.conduction electrons, one may obtain the absolute value of the room temperature spin susceptibility X E ~ R = 4 . 6 ~ 1 0 ~ emu-mol-l. This value also agrees with the previously reported room temperature spin susceptibility of the polymeric phase of KC60."
The sample was then cooled down to 100 K and EPR spectra were taken over the temperature range of 100400 K with the heating run. The spin susceptibility
1516 KHAIRULLIN, TSAO, AND HWANG g=2.0006(2) AHpp=6.9 G 3460 3480 3500 3520 354( Magnetic field (G) '"I I X
f
2 1 01 ~ " " " " " ~ 100 150 200 250 300 350 400FIG 3
-
The top plot shows the room temperature EPR spectrum obtained for the slowly cooled sample after annealing at 773 K for 5 days. The spectrum demonstrates the Dyson-type lineshape which normally indicates metallic behavior. The bottom plot shows the spin susceptibility versus temperature. The temperature independent Pauli like %pR in the 100-320 K range is the apparent characteristicsof the KC6o polymeric phase.
shown in Fig. 3b remains constant from 100 K up to about 360 K consistently with the Pauli paramagnetism. This is the strongest conformation of the polymeric orthorhombic phase. A negligible drop in BPR at higher temperatures may be the forerunner of the polymeric-to-intermediate phase transition which take place at about 400 K."
CHARACTERIZATION OF KCso 1517
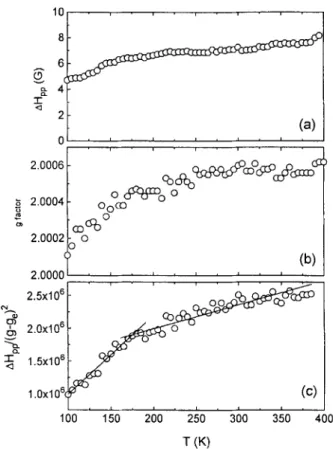
Figures4a and 4b show a linewidth and g factor versus temperature respectively. AHpp gradually increases from 4.5 G (100 K) to 8.2 G (400 K) while
a g factor increases from 2.0001 (100 K) to 2.0006 (400 K). In metals, electron- phonon scattering leads to a linear conductivity
p(7).
In accordance with theory of Elliotz8 and YafetB, there should be a linearity between AH~nlp and A 2 , where AHln is the halfwidth of the EPR absorption, Ag= g,- g and g, is a free electron gfactor. For conduction electrons this suggests a linear hnction of temperature for the product AHlnx(Ag)-’. If an EPR lineshape does not change with temperature, then one may replace
AH10
by the experimentally available parameter MYpp. Figure 4c shows AHppx(Ag)-’ versus temperature for our sample. Actually, there are two linear regions, from 100 K to about 170 K and from 170 K to 350 K respectively. The turning point at 170 K can be a new feature, but further work is needed to elucidate its possible origin.Next we examine EPR spectra for phase transitions known for the rapidly cooled (quenched) KC60. The sample was re-heated at 573 K for 90 min, quenched
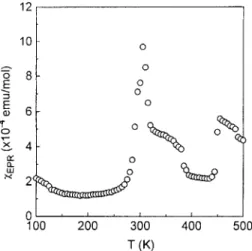
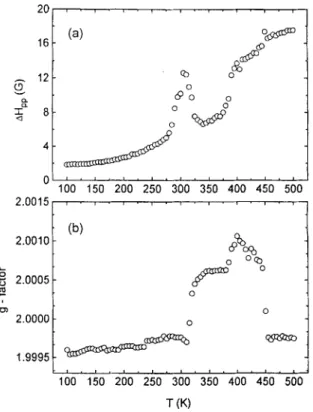
to 77 K by instant immersing into the liquid nitrogen and promptly transferred into the resonator holding at 100 K. EPR spectra were recorded from 100 K to 500 K with the heating run. The variation of %pK with temperature is presented in Fig. 5. Fig. 6 shows temperature dependencies of AHpp and a g factor respectively.
From 100 K to about 280 K the spin susceptibility of the quenched sample is about four times smaller than that of the slowly cooled sample. Significant decrease in EPR intensity is explained by the formation of dimers in KC60.
1518 KHAIRULLIN, TSAO, AND HWANG
100 150 200 250 300 350 400
(K?
FIG 4
-
Temperature dependencies of (a) the linewidth, (b) the g factor and (c) the product A H p x ( A g ) - 2 , where Ag=gc-g and g, is a free electron g factor, measured for the slowly cooled sample of KC60 (see text for details).However, BPR does not reach its absolute minimum and shows a weak Curie component (Fig. 5). One may relate this component to the remainder of the monomeric fcc phase since the reduced g factor (1.9996 at 100 K (Fig. 6)) is an attribute of the localized c 6 0 - ions. The possible contribution of the remained K3C60 from the intermediate phase may be much lesser because this stoichiometry
CHARACTERIZATION OF KC,g h 8 -
6
6 -.
3 . 1519 0 0 0 0 l oI
0 II: a w x 2 0 ' ' I " " 100 200 300 400 E T (K) 0FIG 5
-
The spin susceptibility versus temperature (the heating run) for the quenched sample of KC60. In the 100-280 K range KC60 is in the dimer phase characterized by minimal CPR. In the 280-320 K range the dimerized phase isreplaced by the transient monomeric fcc phase, which is followed by the polymeric phase in the 320-380 K range. In the 380-450 K range the polymeric phase changes to the intermediate phase with the phase instability (&c60 + K3C6,,). Above 450 K the sample is in the monomeric fcc phase.
typically exhibits a higher g factor.26 AH,,,, monotonously increases from 1.8 G (100 K) to 4.0 G (280 K) respectively.
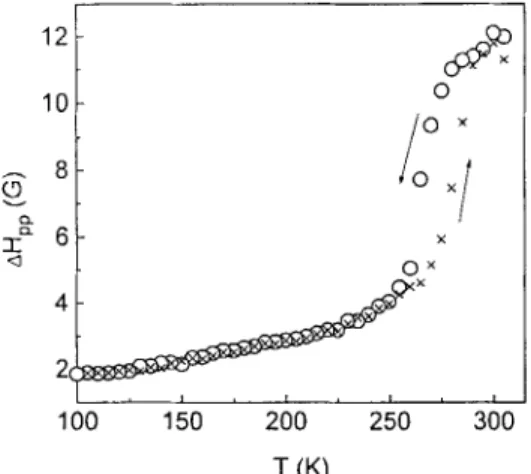
From 280 K to about 320 K, one observes dramatically transformation in EPR parameters which is explained by transition from the dimer phase to the transient monomeric fcc phase. The spin susceptibility becomes 9.8 x10⁴ emumol-' (300 K) and then decreases down to 5.2 x10⁴ emu-mol-' (320 K) (Fig. 5 ) , while the linewidth increases to 12.6 G (300 K) and then decreases to 7.6 G (320 K) (Fig. 6a). The characteristic hysteresis of about 20 K around the temperature of the dimer-to-monomeric fcc phase transition is observed (Fig. 7) in agreement with
1520 KHAIRULLIN, TSAO, AND HWANG
1
o w O' 100 ' 150 ' 200 ' O2; ' 300 ' 350 '400 ' 450 ' 5;)O'
2 . 0 0 1 5 : 0 0, 2.00001
1.9995 100 150 200 250 300 350 400 450 500 T (K)FIG 6
-
The linewidth (a) and g factor (b) plotted versus temperature for thequenched sample of KC60. Characteristic evolution's of these two parameters reflect phase transitions in the following sequence (see Fig. 5 and text): dimer
+
transient monomer fcc 4 polymer+
intermediate (a-C60 + K3C60) i monomer fcc.other works. lo A tentative explanation for the hysteresis quoting sequentially the
lattice constant of the quenched KC60, the shift of transition to higher temperatures in pure c60under hydrostatic pressure and the bulk modulus of C ~ O presented in Ref 10 may be relevant here.
Above 320 K the transient monomeric fcc phase is followed by the polymeric phase, which completely replaces the predecessor at about 360 K. From 360 K to
CHARACTERIZATION OF KC60 1521 12 - 10 - -. a -
2
100 150 200 250 300-r
(K)FIG 7
-
The hysteresis in the linewidth at the transition temperature between the dimer and transient monomer fcc phases of the quenched sample of KCao.380 K the polymeric phase is characterized by g = 2.0006 (Fig. 6b). Above 380 K to 450 K the sample is in the intermediate phase with an equilibrium state a- c60
+
K3C60, where the g factor of 2.0009-2.0014 is a characteristics of K ~ C ~ O . ~ ~The final transition from the intermediate phase to the thermodynamically stable monomer fcc phase occurs at 450 K with another jump in EPR from 2.2
x104 emu.mol-' to 5.6 x1O4 emumol-' (Fig. 5 ) and a drop in a g factor from
2.0006 down to 1.9997 (Fig. 6b). No transitions are observed between 450 and 500 K.
Thus from 100 K to 500 K the phase sequence for the quenched sample can be written as follows: dimer
+
monomer fcc+
polymer+
intermediate (a- c 6 0+
K3C60)+
monomer fcc.1522 KHAIRULLIN, TSAO, AND HWANG No signal of g=2.0025 from c60+ radicals is observed in the room
temperature spectrum (Fig. 3a). Besides, we observed this signal in low temperature spectra (not presented), but it was too weak to make considerable contribution to the temperature-independent X E ~ R of the slowly cooled sample. For the quenched sample, the weak Curie component of DPR might however be partially associated with c60+ radicals.
We suspected that the high temperature treatment of C 6 0 in the presence of
oxygen in the sealed tube might result in C 6 0 0 epoxides and CQOO dimers.
Adopting electrons from neighbor K atoms, such species might contribute into EPR spectra. As mentioned, we did not register signal related to [c600]-. For
[ C 1 2 0 0 ] 2 - , Balch et d.'* have reported a single strong line with g = 2.0016 and AHpp = 1 .I G and doublet satellites centered at g = 2.0030 with spacing 13 G. For
[C1200]4-, they observed a central peak with g = 2.0025 and four satellites centered
at g = 2.0037.18 No such features were found in our EPR spectra either.
3.2. Differential Scanning Calorimetry
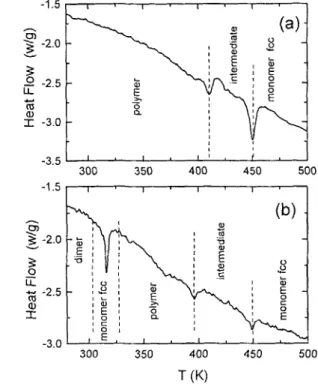
Figure 8a shows the DSC scan taken on the heating run with the rate of 10 Wmin starting from the polymeric phase of the slowly cooled sample. In the 300- 500 K range there are two endothermic and one exothermic peaks. The first endothermic peak at 420 K relates to the depolymerization transition when covalently bonded C60 molecules lose their bonds and become freely r ~ t a t i n g . ~ ' This leads to the formation of the intermediate state where K ions can migrate
CHARACTERIZATION OF KC6o 1523
-1.51
,
-
1 I *,
1I -3.0
-
300 350 400 450 500
300 350 400 450 500
FIG 8
-
DSC thermograms recorded during heating the polymer (a) and dimer (b) phases of KGO. Characteristic phases are indicated. There is a good agreement with EPR data.resulting in instability of the KCso stoichiometry. Due to migration processes, the first endothermic peak is closely followed by the exothermic peak. The second endothermic peak at 450 K is associated with the final transition into the monomer fcc phase. Hence the sequence of phase transitions for the slowly cooled sample at the heating run is: dimer
-+
intermediate (a-C,+
K3&) 3 monomer fcc.Figure 86 shows the DSC scan of the quenched sample in the 280-500 K range with three endothermic peaks. The peak at 317 K is associated with the
1524 KHAIRULLIN, TSAO, AND HWANG decomposition of the dimer phase into the transient monomeric fcc phase which is followed by the polymeric phase. The peak at 396 K relates to the polymeric-to- intermediate phase transition. At 450 K the polymeric phase transforms to the monomeric fcc phase.31 The obtained picture consistently agrees with EPR data.
3.3.
'
'
C
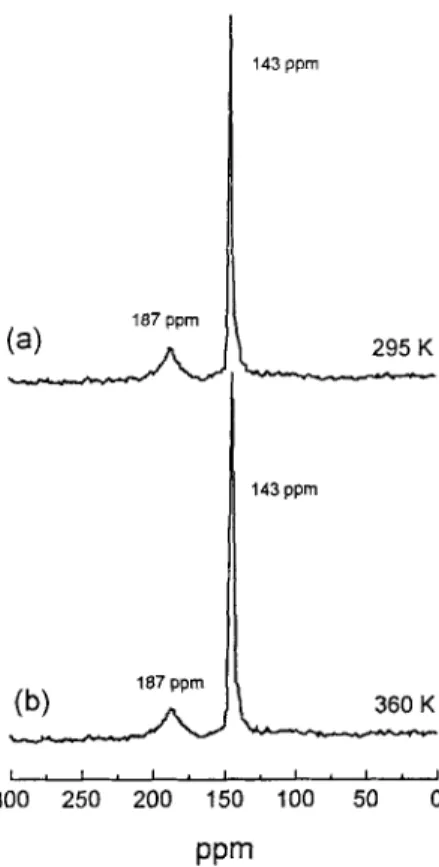
Nuclear Magnetic ResonanceFigure 9 shows 13C
NMR
spectra recorded at 295 K and 360 K for the slowly cooled sample of the polymer phase. That presented spectra are identical in shape seemed to be natural since from EPR and DSC measurements one can not expect the spectral transformation up to 400 K. Spectra demonstrate two peaks with chemical shifts of 187 ppm and 143 ppm respectively. The former value coincides with the chemical shift of K3C6~32 and the latter one relates to ~ 6 0It is possible . ~ ~that some minor part of c60molecules do not form covalent bonds under slow
cooling so that separated areas of & c 6 0 and K3C60 may persist in the bulk at
ambient temperature. Since g = 2.0006 of an EPR spectrum at this temperature
somewhat smaller than a typical g factor of K3C60 one may conclude that such
areas are indeed very small. We do not find a resonance signal which could be referred to the polymeric phase. For covalently bonded c60molecules a chemical
shift anisotropy (CSA) is not averaged out by a reorientation motion. This may result in such broadening that the signal can not be seen in static NMR spectra.
Figure 10 shows t3C N M R spectra of the quenched sample at three characteristic temperatures. At 240 K, the essentially broad asymmetric signal is
CHARACTERIZATION OF KC,, 1525
L . l . I . I . " l ' l
300 250 200 150 100 50 0
PPm
FIG 9
-
13C Nh4R spectra taken at (a) 295 K and (b) 360 K for the slowly cooledKC60. Spectra are identical in lineshape with two peaks at 187 ppm and 143 ppm respectively. The former peak is assigned to K& while the latter one to K&O ( x << 0.1). We do not observe the broader signal which might be assigned to the KCao polymeric phase. Perhaps the large CSA makes it too broad to be observed in static
NMR
spectra.seen in vicinity of the 143 ppm line. One may relate this signal to carbons of dimerized (260 molecules. Since CSA in the dimer phase is likely smaller than that
in the polymeric phase due to the partial motional averaging, the pertinent signal can be detected now. At 300 K the broad signal transfers to the symmetrical peak with a chemical shift of 173 ppm. This peak is assigned to the transient monomeric
1526 KHAIRULLIN, TSAO, AND HWANG
I * I . I ( I . I . I * I
300 250 200 150 100 50 0
PPm
FIG 10 - I3C
N M R
spectra taken at (a) 240 K, (b) 300 K and (c) 360 K for the quenched Kcso. Transformation of spectral shape reflects transitions from the dimer phase (a) to the transient monomeric fcc phase (b) and then t o the polymeric phase (c).CHARACTERIZATION OF KCm 1527
fcc phase which gradually replaces in the dimer phase.33 With decomposition of the dimer phase one observes fbrther transformation in the spectral shape. At 360 K the spectrum with peaks at 187 pprn and 143 ppm (Fig. 1Oc) is very similar to that obtained for the polymeric phase (Fig. 9b). Although our N M R probe could not be set to higher temperatures, we would expect the re-appearance of the 173 ppm line of the monomeric fcc phase in
NMR
spectra above 450 K. In the 240-
360 K range NhfR data satisfactorily confirm those obtained by EPR and DSC methods.G O O and CIZOO imply 13C
NMR
resonances at about 130-160 ppm and 75- 100 ppm.16*” The former resonance would belong to the hllerene skeletal carbons and the latter one would represent twolfour carbons evolved in epoxideNo such lines were observed in our samples, in good agreement with EPR data.
Conclusion
Results obtained in a present study convincingly suggest that by-products of the decomposition of KzCO3 do not affect further polymerization and dimerization processes in KCso. Only a small part of c 6 0 molecules may interact with the
released molecular oxygen bringing about a weak EPR signal with g = 2.0025. No signs of G O O epoxides or C l ~ o O dimers were observed in EPR and NMR spectra. Thus, alkaline carbonates can be used in preparation of &-based polymer materials where c 6 0 molecules are reduced by alkaline atoms.
Acknowledgments
This work was supported by National Science Council of Republic of China under Grant NSC 85-21 13-M-001-039. 1.I.Kh. is grateful to National Science
1528 KHAIRULLIN, TSAO, AND HWANG
Council for fellowship and Institute of Atomic and Molecular Sciences for hospitality.
References
1. Winter, J., and Kuzmany, H., Solid State Commun., 1992,@, 935.
2. Poirier, D., and Weaver, J.H., Phys. Rev. B, 1993,
47,
10959.3. Zhu, Q., Zhou, O., Bykovetz, N., Fischer, J.E., McGhie, A.R., Romanov, W.J., Lin, C.L., Strongin, R.M., Cichy, M., and Smith, A.B. 111, Phys. Rev. B,
1993,47, 13948.
Chauvet, O., Oszlanyi, G., Forro, L., Stephens, P.W., Tegze, M., Faigel, G., and Janossy, A., Phys. Rev. Let., 1994,=, 2721.
Stephens, P.W., Bortel, G., Faigel, G., Tegze, M., Janossy, A., Pekker, S., Oszlanyi, G., and Forro, L., Nature, 1994,370, 636.
Pekker, S., Forro, L., Mihaly, L., and Janossy, A,, Solid State Commun., 1994,90, 349.
Pekker, S., Janossy, A,, Mihaly, L., Chauvet, O., Carrard, M., and Forro, L., Science, 1994,
265,
1077.Oszlanyi, G., Bortel, G., Faigel, G., Tegze, M., Granasy, L., Pekker, S., Stephens, P.W., Bendele, G., Dinnebier, R., Mihaly, G . , Janossy, A., Chauvet, O., Forro, L., Phys. Rev. B, 1995, jJ., 12228.
Tycko, R., Dabbagh, G., Murphy, D.W., Zhu, Q., and Fischer, J.E., Phys. Rev. B., 1993,48,9097. 4. 5. 6 . 7. 8. 9.
10. Petit, P., Robert, J., and Fischer, J.E., Phys. Rev. B, 1995,
a,
11924.CHARACTERIZATION OF KCm 1529
11: Janossy, A,, Chauvet, O., Pekker, S., Cooper, J.R., and Forro, L., Phys. Rev. Lett., 1993,71, 1091.
12. Zhu, Q., Cox, D.E., and Fischer, J.E., Phys. Rev. B., 1995,
u,
3966. 13. Martin, M.C., Koller, D., Du, X., Stephens, P.W., and Mihaly, L., Phys. Rev.B, 1994,49, 10818.
14. Hwang, J.H., Mou, C. Y., Sheu, H.S., Wang, Y., and Wu, M.K., Appl. Phys. Lett., 1994, 65, 2156.
15. Creegan, K.M., Robbins, J.L., Robbins, W.K., Millar, J.M., Shenvood, R.D., Tindall, P.J., and Cox, D.M., J. Am. Chem. Soc., 1992,114, 1103.
16. Smith, A.B. 111, Toyuyarna, H., Strongin, R.M., Furst, G.T., Romanow, W.J., Chait, B.T., Mirza, U.A., Haller, I., J. Am. Chem. SOC., 1995,117, 9359. 17. Balch, A.L., Costa, D.A., Noll, B.C., and Olrnstead, M.M., J. Am. Chem.
SOC., 1995,117,8926.
18. Balch, A.L., Costa, D.A., Fawcett, W.R., and Winkler, K., J. Am. Chem. SOC., 1996,100,4823.
19. Fedurco, M., Costa, D.A., Balch, A.L., and Fawcett, W.R., Angew. Chem. Int. Ed., 1995,
B,
194.20. Koller, D., Martin, M.C., Stephens, P.W., Mihaly, L., Pekker, S., Janossy, A,, Chauvet, O., and Forro, L., Appl. Phys. Lett., 1995,
66,
101 5.21. Kawata, S., Yarnauchi, K., Suzuki, S., Kikuchi, K., Shiromaru, H., Katada, M., Saito, K., Ikemoto, I., and Achiba, Y., Chem. Lett., 1992, 1659.
22. B a d , A,, Dunsch, L., Kirbach, U., and Schandert, B., Synthetic Metals, 1995,
- 70, 1365.
1530 KHAIRULLIN, TSAO, A N D HWANG
2 3 . Pace, M.D., Christidis, T.C., Yin, J.J., and Milliken, J , J. Phys. Chern., 1992,
-
96, 6855.
24. Xiang, B., and Kevan, L., in Fiillereries. Recerif Advatices in the Chemistry
arid Physics of Firllerenes arid Related Materials, Kadish, K.M.; and R u o q
R.S., Eds, American Electrochemical Society Proceedings, 1994, 24, pp. 981- 985.
25. Kato, T., Kodama, T., Oyama, M., Okazaki, S., Shida, T., Nakagawa, T., Matsui, Y., Suzuki, S., Shiromaru, H., Yamauchi, K., and Achiba, Y., Chem. Phys. Lett.,1991,&, 35.
26. Allemand, P.-M., Srdanov, G., Koch, A,, Khemani, K., Wudl, F., Rubin, Y., Diederich, F., Alvarez, M.M., Anz, S.J., and Whetten, R.L., J. Am Chern.
SOC., 1991,113,2780.
27. Dyson, F. J., Phys. Rev., 1955,98, 349. 28. Elliott, R. J . , Phys. Rev., 1954,96, 266. 29. Yafet, Y., Solid State Phys., 1953,
I,
14.30. Kukolich, S.G.; and Huffmann, D.R., Chem. Phys. Lett. 1991,l2,263 31. Granasy, L., Kemeny, T., Oszlanyi, G., Bortel, G., Faigel, G., Tegze, M.,
Pekker, S., Forro, L., and Janossy, A., Solid Ste Comrnun., 1996,$V, 573. 32. Stenger, V.A., Penington, C.H., Bufinger, D.R., and Ziebarth, R.P., Phys.
Rev. Lett., 1995, 74, 1649.
33. Kalber, T., Zimmer, G., and Mehring, M., Phys. Rev. B., 1995,
fi,
16471.(Received June 3, 1997)