國立交通大學
光電工程學系
顯示科技研究所
碩士論文
適用於色序法液晶顯示器之多主頻譜背光
系統
Backlighting with Multiple Primary Spectra
for FSC LCD
研究生:蕭人彰
指導教授:田仲豪 博士
適用於色序法液晶顯示器之多主頻譜背光
系統
Backlighting with Multiple Primary Spectra for
FSC LCD
研 究 生: 蕭人彰
Student: Jen-Chang Hsiao
指導教授: 田仲豪 Advisor: Dr. Chung-Hao Tien
國立交通大學 電機學院
光電工程學系
顯示科技研究所
碩士論文
A Thesis
Submitted to Display Institute & Photonic Department
College of Electrical Engineering Science
National Chiao-Tung University
in Partial Fulfillment of the Requirements
for the Degree of Master
In
Display Institute
October 2008
Hsin-Chu, Taiwan, Republic of China.
適用於色序法液晶顯示器之多主頻譜背光系統
研究生:蕭人彰 指導教授:田仲豪 博士
國立交通大學
光電工程學系 顯示科技研究所
摘 要
傳統色序法背光系統提供一種不需使用彩色濾光片即可達到高效能、高色 彩以及高解析度方法。但由於現今液晶的反應速度仍舊不足,在大尺寸的液晶 顯示器上,等待整塊面板的液晶反應時間會壓縮到背光源點亮的時間,而導致 面板的亮度不足。因此,為了解決此問題,運用掃描式色序法的背光驅動方式 來達到補償等待液晶反應速度上的不足。本篇論文的主要目的就是完成大尺寸 分區掃描式色序法之液晶顯示器背光模組的驅動電路設計。此驅動電路分成2個 部份。ㄧ個是硬體部分;另一個為軟體部分。在硬體部分,是由控制板、LED驅 動IC以及LED light bar所組成。而軟體的部份,是使用C語言去撰寫。Backlighting with Multiple Primary Spectra for FSC LCD
Student: Jen-Chang Hsiao Advisor: Dr.Chung-Hao Tien
Department of Photonics & Display Institute National Chiao-Tung University
Abstract
The field-sequential-color (FSC) system has a lot of advantages such as high efficient, high color gamut and high resolution. However, the duty cycle of the light source is restricted due to the response time of the liquid crystal (LC) is not fast enough. This situation leads to luminance reduction especially in large size LCD. In order to overcome this issue, the scanning FSC backlight system is proposed. In this backlight system, the color state is sequentially scanned from top to bottom for entire backlight module. The aim of this thesis is to accomplish the control circuit of the large scale scanning FSC backlight system. The control circuit is composed of the hardware and software. The hardware consists of the control board, LED driver IC and LED light bars. For the software, the C programming language is utilized.
誌謝
首先要感謝我的指導教授田仲豪博士這幾年來在研究上及英語表達能力上 無私的細心指導,並且提供我良好的研究環境,使我在碩士生涯對於顯示器的背 光系統架構有深入的了解,並順利完成本論文。 在實驗室的日子裡,特別要感謝博士班陸彥行學長、簡銘進學長以及洪健翔 學長在研究方向以及實驗上的建議,以及在各方面的合作與協助,讓我受益良 多。此外,還有鄭璧如學姊、藍子翔學長以及已經畢業的學長們在研究過程中提 供許多寶貴的建議,同時還要感謝其他同學和學弟妹在課業上、生活上以及研究 上的幫助與分享,並陪伴我ㄧ起度過這些快樂的日子。 此外,我要感謝蘇志揚、孫林國楠先生,在研究期間提供我實驗材料以及技 術上的協助,讓我實驗得以順利完成。 最後,對於我的家人以及許多朋友,我要感謝你們多年來的支持與鼓勵,還 有生活上的細心照顧與關懷,使我能夠無後顧之憂的研究與學習,並順利完成碩 士學業。這份喜悅,我將與幫助過我的各位分享。 iiiTable of Contents
Abstract (Chinese)………...i Abstract (English)………...ii Acknowledgement………..…iii Table of Contents……….. iv Figure Caption………..vii Table Caption………...x Chapter 1 Introductions... 11.1 Characteristic of the LEDs...1
1.2 Field-sequential-color (FSC) LCD ...2
1.3 Phenomen of Color Breakup...4
1.4 Scanning FSC Backlight ...5
1.5 Motivation and Objective ...7
1.6 Organization of the Thesis ...8
Chapter 2 Principle and Prior Arts... 9
2.1 Basic Types of LED Circuits ...9
2.1.1 Series Type...10
2.1.2 Parallel Type ...10
2.2 Pulse-width-modulation (PWM)... 11
2.3 Tristimulus Values and Chromaticity Coordinates ...12
2.4 Color Mixing...13
2.5 Summary ...15
Chapter 3 Circuit Design... 16
3.1 Introduction...16
3.2 Specification of the FSC LCD Backlight System...17
3.3 Software for the Circuit of the Scanning FSC BLM...19
3.4 Hardware for the Circuit of the Scanning FSC BLM ...19
3.4.1 Control Board...19
3.4.2 LEDs Light Bar...20
3.4.3 LED Drive IC...22
3.5 Circuit Design for the Hardware of the LEDs ...23
3.5.1 Selection of the External Resister (Rext)...23
3.5.2 Selection of the LED Current Limiting Resistor ...25
3.6 Software Design & Driving Signals for the Scanning FSC Backlight ...26
3.7 Summary ...33
Chapter 4 Experimental Results and Discussions ... 34
4.1 Introduction...34
4.2 Light Source Properties...34
4.3 Optomechanical Setup ...34
4.4 Optical Performances of BLM...36
4.5 Electronic Characterizations of the Control Circuit...40
4.6 Results of the Different Frame Rate ...42
4.7 Summary ...42
Chapter 5 Discussions on Issues of LEDs Backlight ... 44
5.1 Introduction...44
5.2 Issues of the 4-in-1 (RGGB) LEDs Backlight ...44
5.3 Explanation for the Issues of the 4-in-1 (RGGB) LEDs Backlight ...49
5.4 Summary ...53
Chapter 6 Conclusions & Future Works... 54 v
6.1 Conclusions...54 6.2 Future Works ...56 Reference ………58
Figure Captions
Fig. 1-1 (a) LED emission spectra and corresponding color filter spectra (b) CIE
color……….3
Fig. 1-2 Timing chart in FSC LCD with TFT address, LC response time and backlight lighting time……….4
Fig. 1-3 (a) The mechanism of CBU (b) Stationary image in FSC display perceived with CBU by eye motion……….5
Fig. 1-4 (a) Scanning FSC backlight system (b) Time relation on scanning of LC TFT array and LED backlight……….6
Fig. 1-5 Scanning FSC backlight system (a) without partition (b) with partitions…6 Fig. 1-6 (a) Optomechanical setup (b) Tandem light guides combined with optomechanical setup………..8
Fig. 2-1 Basic circuit of the LED………...9
Fig. 2-2 Series circuit of the LED……….10
Fig. 2-3 Parallel circuit of the LED………...11
Fig. 2-4 An example of PWM………...11
Fig. 3-1 Tree diagram of the backlight system...16
Fig. 3-2 (a) Structure of the FSC scanning BLM (b) wedge shaped light guide unit………..18
Fig. 3-3 Circuit of the control system………...20
Fig. 3-4 LEDs Light bar………22
Fig. 3-5 Circuits of the (a) R LEDs light bar (b) G LEDs light bar (c) B LEDs light bar………...22
Fig. 3-6 Resistance of the external resistor, Rext (Ω)………..…23
Fig. 3-7 Terminal function of the IC for the R, G and B LEDs light bar…………..24
Fig. 3-8 Timing chart for multi-flashing method………..27
Fig. 3-9 Timing relation for the duty of the R, G and B LED………...27
Fig. 3-10 Block chart for the scanning FSC backlight………..32
Fig. 3-11 Flow chart of the backlight circuit...33
Fig. 4-1 Angular distribution of LEDs – (a) Red (b) Green (c) Blue………35
Fig. 4-2 (a) Optomechanical setup (b) Tandem light guides combined with optomechanical setup……….36
Fig. 4-3 The uniformity of 2x2 tandem light guide matrix (a) Red (b) Green (c) Blue (d) white state……….………37
Fig. 4-4 Light leakage from operated block to the neighboring blocks………38
Fig. 4-5 Spectra of the BLM (Hold type)………..39
Fig. 4-6 Spectra of the BLM (FSC or FSC with scanning)………...39
Fig. 4-7 Output of the frame rate (CH1) & sub-frame rate of the R, G and B, respectively (CH2)……….40
Fig. 4-8 ON-time of the R, G and B field, respectively………41
Fig. 4-9 Electronic signals of the R field in the 1st and 2nd division………..41
Fig. 5-1 (a) Spectral distribution for the hold type backlight…..………..45
Fig. 5-1 (b) Superposition of the spectral distribution for the ideal R, G and B field (duty cycle = 100%) ………..………46
Fig. 5-2 (a) Spectral distribution for the FSC backlight………...……….47
Fig. 5-2 (b) Superposition of the spectral distribution for the ideal R, G and B field (duty cycle = 1/6) ………...48
Fig. 5-3 Relation of the junction temperature, thermal resistance and slug temperature in the LEDs chip……….50
Fig. 5-4 Peak wavelength as a function of junction temperature for the red, green and blue LEDs……….……...………51 Fig. 5-5 Relative light output of the red, blue and phosphor-converted white LEDs
as a function of the junction temperature………...52 Fig. 6-1 Backlight system of the feedback control………...56 Fig. 6-2 2D scanning FSC backlight ………57
Table Captions
Table 3-1 Specifications and criterions of proposed BLM………...18 Table 3-2 Electro-optical characteristics………..21 Table 3-3 Electro-optical characteristics………..21 Table 3-4 Numbers of the constant current output channel for R, G and B LEDs
light………..24 Table 3-5 Terminal function of the IC for the LEDs light bar………..25 Table 3-6 Truth table for the deductive method of the scanning FSC backlight…..28 Table 3-6-1 Truth table for time domain NO.1~NO.6……….31 Table 3-6-2 Truth table for time domain NO.8~NO.47………...31 Table 3-6-3 Truth table for time domain NO.12~NO.47……….32 Table 4-1 Chromaticity coordinates and brightness for different operating frame
rate………...42 Table 5-1 Results of the peak wavelength, chromaticity coordinates and brightness
where the duty cycle of the LEDs is 100%...45 Table 5-2 Results of the peak wavelength, chromaticity coordinates and brightness
where the duty cycle of the LEDs is 1/6……….47 Table 5-3 Results of the peak wavelength, chromaticity coordinates and brightness
for the different driving method of the backlight………48
- 1 -
Chapter 1
Introduction
1.1 Characteristic of the LEDs
A light-emitting diode, usually called an LED, is a semiconductor diode that emits incoherent narrow-spectrum light when electrically biased in the forward direction of the p-n junction, as in the common LED circuit. This effect is a form of electroluminescence.
The LED is usually a small area light source, often with optics added to the chip to shape its radiation pattern. The LEDs are often used as small indicator lights on electronic devices and increasingly in higher power applications such as flashlights and area lighting. The color of the emitted light depends on the composition and the condition of the semiconducting material used, and can be infrared, visible or ultraviolet. The LEDs can also be used as a regular household light source. Besides lighting, interesting applications include the sterilization of the water, the disinfection of the devices and the backlight module of the display.
Advantages of using LEDs
(1) Long-life : LED bulbs last 10 times as long as compact fluorescents, and 50-100 times longer than typical incandescents in normal everyday use situations.
- 2 -
circumstances when a regular incandescent bulb or compact fluorescents would be broken. Because they are solid, LED bulbs hold up well to jarring and bumping. With compact fluorescents, there is the added problem of mercury toxins spreading on breakage.
(3) Cool : These bulbs do not cause heat build-up. LEDs produce 3.4 B.T.U.s/hour, compared to 85 B.T.U.s/hour for incandescent bulbs (B.T.U.s = British Thermal Units).
(4) Energy-saving : LEDs use a fraction of the wattage of incandescent bulbs. These bulbs last for years, therefore energy is saved in maintenance and replacement costs. This also makes LEDs the best choice for use with alternative energy sources.
1.2 Field-sequential-color (FSC) LCD
In the modern digital multimedia lifestyle, all kinds of information are requested to render high-quality and high-density. Therefore, the high resolution is required to exhibit the vivid image. Displaying color in conventional LCD has been realized by using three kinds of the color filters to lead the Red, Green and Blue (R, G, and B) colors pass through. However, it is difficult to accomplish high-resolution LC panel by means of the conventional color-filters (CFs) type LCD due to the CFs hinder the resolution of the LCD from high-resolution. The other concerned issue is the optical efficiency that CFs absorb about two third of energy. Using CF-free display is one of the solutions to improve the optical efficiency and resolution. Moreover, the FSC can be expected to have three times higher resolution than that of
- 3 -
the same technology applied to conventional CFs type displays [1-4]. However, the switching speed of CCFLs is not fast enough for the pulsed operation, which is required for the field color sequential scheme.
Using LEDs as light source is suitable for FSC backlight application due to the response time is sufficiently rapid to switch the different color state. Moreover, the emission spectra of R, G, and B LEDs are narrower than the color filters, as shown in Fig. 1-1(a). Based on the CIE 1931 chromaticity diagram, shown in Fig. 1-1(b), the area of the triangle matched by the FSC LCD can exceed 120% NTSC (National Television Standards Committee), which is anticipated to be better than that of current CCFL LCD.
However, the trigger time of each pixel in FSC LCD should be driven three times higher than conventional display, because each frame is composed of three sub-frames. Assuming that the frame frequency is 60 Hz, each sub-frame should be less than 1/180 sec (5.56ms) for TFT addressing, waiting for LC rotating, and LED flashing as shown the timing chart of sequential color LCD in Fig. 1-2.
(a) (b)
- 4 -
Fig.1-2 Timing chart in FSC LCD with TFT address, LC response time, and backlight lighting time
1.3 Phenomen of Color Breakup
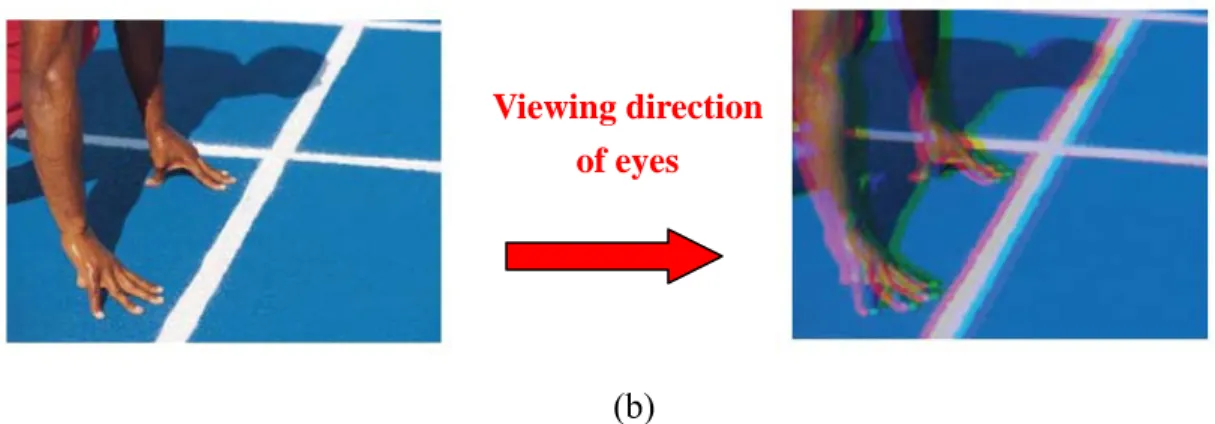
In contrast to the advantages of FSC LCD, however, waiting TFT address and LC response time cause the shorter illumination time and color break-up (CBU) which degrades display quality [5-9]. As resemble in motion blur, if a displayed object is moving on an FSC LCD, the edge of the object will appear rainbow colors. Fig. 1-3 exhibits the mechanism of CBU during eye tracking movement.
- 5 -
(b)
Fig. 1-3 (a) The mechanism of CBU (b) Stationary image in FSC display perceived with CBU by eye motion
1.4 Scanning FSC Backlight
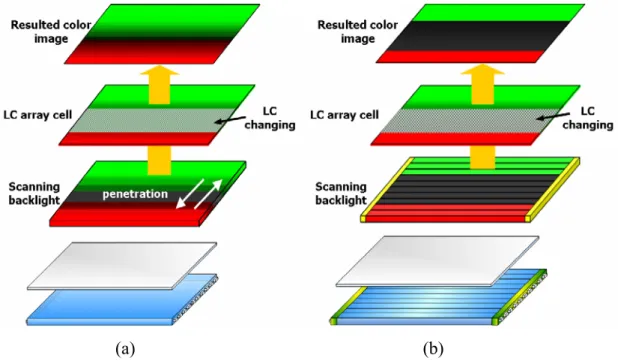
To improve the CBU and decrease the required LC response time, a special configuration of backlight is proposed, i.e., a scanning FSC backlight. The conventional FSC backlight sequentially transforms the color states in order of R, G, and B color in each frame, and the entire screen exhibits the same color state at the same time. Furthermore, the traditional scanning backlight is aimed at motion blur, and the light leakage would not introduce an issue because the color state of edge of moving object does not change. Nevertheless, the scanning FSC backlight, the color state is scanned from up to down for whole BLM. If the whole emitting surface of the light guide is divided into 10 portions to illuminate, and the timing relation between the TFT addressing, LC response, and LED flash is shown in Fig. 1-4 (b) [10]. If we take the instant moment as a dotted line, it will be important to notice that the two different color states appear on the screen simultaneously. It is obvious that light penetration will occur inside light guide, and that will cause the image color distortion as shown in Fig. 1-5 (a).
Viewing direction of eyes
- 6 -
(a) (b)
Fig. 1-4 (a) Scanning FSC backlight system (b) Time relation on scanning of LC TFT array and LED backlight
(a) (b)
Fig. 1-5 Scanning FSC backlight system (a) without partition (b) with partitions
In view of this, each scanning partition of the scanning FSC backlight application should be divided into isolating segments to avoid the color mixing error as shown in Fig. 1-5 (b). Because the sharp discontinuity between divisions may lead to the unacceptable image, the control of light leakage between each partition is necessary.Accordingly, light exiting from each partition should be highly directed in
- 7 -
order to ensure possibly smallest interference to neighboring divisions.
1.5 Motivation and Objective
Conventional LCD (hold-type mode of display) renders three primary colors by using the color filter which absorbs the two thirds energy from the backlight illumination. This issue is concerned specially. Thus, using color filter-free display is proposed, i.e. FSC LCD. The color filter-free display can improve the optical efficiency and resolution. However, the frequency of the FSC LCD should be driven three times higher than conventional display, because each frame is composed of three sub-frames. To improve the LC response time, a special configuration of backlight module is proposed, i.e. partitioned scanning FSC LCD [11-14].
In this thesis, a 32-inch backlight circuit consisting of a system control board, LEDs light bars and LED driver ICs is developed with serial full-color LEDs as light sources for a field-sequential-color liquid-crystal display (FSC-LCD) system. The backlight module shown in Fig. 1-6 is based on the prior work in our lab [15]. Moreover, the backlight module can define each partition without shields as well as reduce the mixing color space. For the backlight system, three kinds of the driving method are utilized. The driving methods consist of the hold type backlight, FSC backlight, and scanning FSC backlight. The optical performances and electronic signals will be measured for operating different driving methods. Compared with the different frame rate of the FSC backlight, the spectral distributions and chromaticity coordinates will be obtained.
The RGB LEDs backlight does not popularly apply due to a lack of stability to cause some issues. Finally, the issues of the RGB LEDs backlight will be described in detail.
- 8 -
(a) (b) Fig. 1-6 (a) Optomechanical setup (b)Tandem light guides combined with
optomechanical setup
1.6 Organization of the Thesis
The thesis is organized as following: in Charter 2, the principle of the components, the driving theory of the LEDs, and the principle of the colorimetry will be given. In Chapter 3, the hardware and the software of the backlight control system will be presented. Furthermore, the driving principle of the scanning FSC backlight will be described. In Chapter 4, the optical performances and electronic characterizations will be obtained for operating different driving methods. In Chapter 5, the issues of RGB LEDs backlight will be described. Finally, the conclusions and the future works will be described in Chapter 6.
- 9 -
Chapter 2
Principle and Prior Arts
2.1 Basic Types of LED Circuits
In the electronics, the basic LED circuit consists of three components connected in series: a voltage source, a current limiting resistor and a LED, as shown in fig. 2-1.
Fig. 2-1 Basic circuit of the LED
The formula is used to calculate the correct resistor:
LED LED S I V -V ) ( resistance Ω = (2.1)
where Vs is the voltage of the power supply, VLED is the forward voltage of the LED, and ILED is the driving current of the LED.
- 10 -
2.1.1 Series Type
If two or more circuit components are connected end to end like a daisy chain, it is said they are connected in series. A series circuit is a single path for electric current through all of its components which have the same electric current. The series circuit of the LED is shown in Fig. 2-2
Fig. 2-2 Series circuit of the LED
2.1.2 Parallel Type
If two or more circuit components are connected like the rungs of a ladder it is said they are connected in parallel. A parallel circuit is a different path for current through each of its components. A parallel circuit provides the same voltage across all of its components. The parallel circuit of the LED is shown in Fig. 2-3.
- 11 -
Fig. 2-3 Parallel circuit of the LED
2.2 Pulse Width Modulation
Pulse width modulation (PWM) is a powerful technique for controlling analog circuits with a processor's digital outputs. PWM is employed in a wide variety of applications, ranging from measurement and communications to power control and conversion. Fig. 2-4 shows an example of PWM: the supply voltage (blue) modulated as a series of pulses results in a sine-like flux density waveform (red) in a magnetic circuit of electromagnetic actuator. The smoothness of the resultant waveform can be controlled by the width and number of modulated impulses (per given cycle). In this research, the PWM method is used to control the LED and modify the LED lighting period and intensity.
- 12 -
2.3 Tristimulus Values and Chromaticity Coordinates
The tristimulus values X, Y and Z of a color stimulus Φ(λ) can be obtained by first calculating tristimulus values R, G and B by equation (2.2) [16], and then converting them into the tristimulus values X, Y and Z using equation (2.3).
λ λ λ λ λ λ λ λ λ d ) b( ) P( B d ) g( ) P( G d ) r( ) P( R vis vis vis
∫
∫
∫
= = = (2.2)where P(λ) is the spectral distribution of the illuminating light, r(λ) g(λ) b(λ) are called color matching functions, and the integral is taken in the visible wavelength region. ⎥ ⎥ ⎥ ⎦ ⎤ ⎢ ⎢ ⎢ ⎣ ⎡ ⎥ ⎥ ⎥ ⎦ ⎤ ⎢ ⎢ ⎢ ⎣ ⎡ = ⎥ ⎥ ⎥ ⎦ ⎤ ⎢ ⎢ ⎢ ⎣ ⎡ B G R 5.5943 0.0565 0.0000 0.0601 4.5907 1.0000 1.1302 1.7517 2.7689 Z Y X (2.3)
However, in general, they are obtained directly using the color matching functions x(λ), y(λ) and z(λ) according to equations (2.4).
λ λ λ κ λ λ λ κ λ λ λ κ d ) z( ) ( Z d ) y( ) ( Y d ) x( ) ( X vis vis vis
∫
∫
∫
Φ = Φ = Φ = (2.4)where κ(λ) is a constant, and the integral is taken in the visible wavelength region. For a reflecting object, the color stimulus is Φ(λ) = R(λ) P(λ), and for the transparent object it is Φ(λ) = T(λ) P(λ), where R(λ) is the spectral reflectance of the reflecting object, and T(λ) is the spectral transmittance of the transmitting object. For example, the tristimulus values X, Y and Z of a reflecting object can be expressed as
λ λ λ λ κ λ λ λ λ κ λ λ λ λ κ d ) z( ) P( ) R( Z d ) y( ) P( ) R( Y d ) x( ) P( ) R( X vis vis vis
∫
∫
∫
= = = (2.5)- 13 -
where the constant κ is
λ λ λ
κ=100 /
∫
visP( )y( )d (2.6) The constant κ is selected such that the tristimulus values Y yields a value of 100 for a perfect reflecting object. In general, R(λ) < 1 for any real object color, and Y is therefore < 100.As with the RGB system, the chromaticity coordinates x and y are established by the intersection of the color vector (X, Y, Z) with the unit plane X + Y + Z = 1 as follows Z) Y (X / Y y Z) Y (X / X x + + = + + = (2.7) A two-dimensional xy chromaticity diagram is often used to plot colors. However, since three pieces of information are needed to specify color, a third must be added to x and y for a complete specification. Any of the tristimulus values X, Y and Z could be used, but in general, the photometric quantity Y is chosen and colors are expressed by (x, y, Y).
2.4 Color Mixing
The phenomenon of generating a new color stimulus through the interaction of multiple other color stimuli is called color mixing. Color mixing can be either additive or subtractive. Additive mixing occurs when the component color stimuli are simultaneously incident on the eye. The stimuli may be superimposed optically, they may occur in rapid temporal alternation (flicker), or they may be interlaced in a spatial pattern not visible to the eye. Because the physical intensity of the color stimulus that results from the mixture is obtained as the sum of the components, the mixture is called ‘additive’ color mixture.
- 14 -
Let us consider the case of three-stimulus mixture. The tristimulus values for unit amount (for example, 1W) of the color stimuli are given by (XR, YR, ZR), (XG, YG, ZG), and (XB, YB, ZB) respectively, and the chromaticity coordinates are given by (xR, yR), (xG, yG), and (xB, yB) respectively. The tristimulus values (XF, YF, ZF) of the color stimulus [F] obtained by additive mixing of amounts R, G, and B of these three color stimuli are expressed by the following equations according to Grassmann’s Laws.
B G R F B G R F B G R F BZ GZ RZ Z BY GY RY Y BX GX RX X + + = + + = + + = (2.8)
These equations can be expressed in matrix form:
⎥ ⎥ ⎥ ⎦ ⎤ ⎢ ⎢ ⎢ ⎣ ⎡ ⎥ ⎥ ⎥ ⎦ ⎤ ⎢ ⎢ ⎢ ⎣ ⎡ = ⎥ ⎥ ⎥ ⎦ ⎤ ⎢ ⎢ ⎢ ⎣ ⎡ B G R Z Z Z Y Y Y X X X Z Y X B G R B G R B G R F F F (2.9)
The three component stimuli that used are for the additive mixing are called additive primaries, and in order to achieve a large gamut, are most often red [R], green [G], and blue [B].
For example, the tristimulus values and chromaticity coordinates of color stimuli [R], [G] and [B] are measured, as shown in equation (2.10).
0.040 y 0.141 x 204.750 Z 10.000 Y 35.250 X 0.701 y 0.221 x 1.113 Z 10.000 Y 3.153 X 0.340 y 0.659 x 0.030 Z 10.000 Y 19.380 X B B B B B G G G G G R R R R R = = = = = = = = = = = = = = = (2.10)
A stimulus having the same chromaticity coordinates as those of standard illuminant D65 with a luminance of YD = 10 can be calculated as an additive mixture of [R], [G], and [B]. Such a stimulus will be metameric to D65. Because D65 has chromaticity coordinates xD and yD given by
- 15 - 0.3290 y 0.3127 xD = D = (2.11) XD and ZD are obtained by
10.890 3290 0.3290)/0. -0.3127 -(1 10 )/y y -x -(1 Y Z 9.5046 290 0.3127/0.3 10 /y x Y X D D D D D D D D D = × = = = × = = (2.12)
From equation (2.9), the following is obtained
⎥ ⎥ ⎥ ⎦ ⎤ ⎢ ⎢ ⎢ ⎣ ⎡ ⎥ ⎥ ⎥ ⎦ ⎤ ⎢ ⎢ ⎢ ⎣ ⎡ = ⎥ ⎥ ⎥ ⎦ ⎤ ⎢ ⎢ ⎢ ⎣ ⎡ = ⎥ ⎥ ⎥ ⎦ ⎤ ⎢ ⎢ ⎢ ⎣ ⎡ B G R 75 . 204 113 . 1 03 . 0 10 10 10 25 . 5 3 153 . 3 38 . 19 10.8906 10.0000 9.5046 Z Y X F F F (2.13)
By multiplying both sides of the equation by the inverse of the first matrix of the left-hand side, the following can be obtained
⎥ ⎥ ⎥ ⎦ ⎤ ⎢ ⎢ ⎢ ⎣ ⎡ = ⎥ ⎥ ⎥ ⎦ ⎤ ⎢ ⎢ ⎢ ⎣ ⎡ ⎥ ⎥ ⎥ ⎦ ⎤ ⎢ ⎢ ⎢ ⎣ ⎡ = ⎥ ⎥ ⎥ ⎦ ⎤ ⎢ ⎢ ⎢ ⎣ ⎡ 0.0496 0.6571 0.2934 10.8906 10.0000 9.5046 75 . 204 113 . 1 03 . 0 10 10 10 25 . 5 3 153 . 3 38 . 19 B G R -1 (2.14)
Thus, 0.2934, 0.6571 and 0.0496 are the desired amounts of [R], [G], and [B] respectively. In the unit plane (R + G + B = 1), the luminance of the color obtained by additive mixing is intermediate between the luminances of the primaries. The actual luminance of any color within the RGB triangle depends on its position in the triangle or on its chromaticity coordinates.
2.5 Summary
The driving methods of the LEDs circuit and the principle of the colorimetry are presented in this chapter. In the following chapter, we will use the hardware combining with the software to accomplish the control circuit of the backlight system.
- 16 -
Chapter 3
Circuit Design
3.1 Introduction
In this chapter, the main stress will fall on the control circuit of the backlight system. The backlight system consists of the optomechanical setup and the control circuit. The optomechanical setup is designed by the condisciple. The BLM is proposed for a scanning field-sequential-color liquid-crystal display (FSC LCD). The specification of the backlight system will be briefly introduced. Moreover, the design of the circuit combines the software with the hardware will be described in detail. The tree diagram of the backlight system is shown in Fig. 3-1.
- 17 -
3.2 Specification of the FSC LCD Backlight System
Coupling with the optically-compensated-bend (OCB) mode LC and full color LEDs, a FSC LCD can be realized without the color filter. However, due to the response time of the LC is slow, the duty cycle of the LEDs is restricted. The backlight will be not bright enough. In order to improve the issue of the LC response time in FSC LCD application, a specific configuration of the backlight system is required: spatial-temporal partitioned scanning backlight driven by the FSC method.
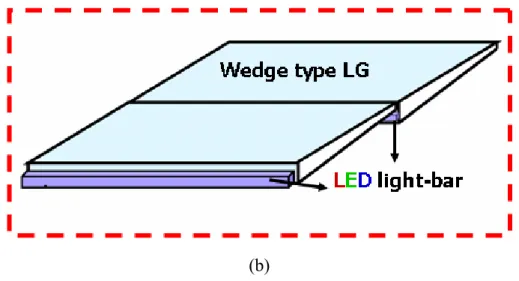
The structure of the spatial-temporal scanning backlight for an OCB-mode FSC-LCD is shown in Fig. 3-2 (a). The backlight consists of
(1) Tandem wedge shaped light guides have prismatic micro-bump structures over the bottom, as shown in Fig. 3-2 (b). The light guides control the direction of the light extraction as well as the uniformity and efficiency.
(2) 4-in-1 full color LEDs light bar is setin front of the incident surface of the corresponding LG and under the end of the previous one.
(3) A diffuser on the top of the wedge shaped light guides that diffuses light and illuminates local dim regions.
(4) A brightness enhanced film (BEF) with a saw-tooth cross-section guide light toward the front direction in order to increase the normal component of the light toward the LCD.
- 18 -
(b)
Fig. 3-2 (a) Structure of the FSC scanning BLM (b) wedge shaped light guide unit
Table 3-1 Specifications and criterions of proposed BLM
The specification of the developed prototype OCB mode FSC LCD is shown in Table 3-1. The tandem wedge shaped light guides are assembled into 32-inch diagonal panel size with aspect ratio 16:9. The entire BLM is divided into 12 horizontal blocks in several considerations such as LC response time, optical efficiency and the panel resolution. The vertical pixel numbers should be divided into an integer by scanning divisions. Otherwise, the pixel will be located across the boundary of two isolated LG plates. Moreover, if we try to increase the numbers of the scanning blocks, the optical performance of LG unit is difficult to be maintained,
- 19 -
and some technical problems may occur during fabrication process. Therefore, the 12 scanning divisions is an adequate choice for our model.
The criterions of the uniformity for full panel and efficiency per light guide unit are 80% and 70%, respectively. The thickness of theoverall BLM is less than 30mm without any shields.
3.3 Software for the Circuit of the Scanning FSC BLM
The C programming language is the most popular programming language in the control signals of the circuit, so we use the C programming language to implement the control signals and download the contral signals in the micro controller chip.
3.4 Hardware for the Circuit of the Scanning FSC BLM
The hardware of the backlight module consists of the control board, the 4-in-1 full color LEDs light bar, and the LED drive IC. The details of the hardware will be depicted.
3.4.1 Control Board
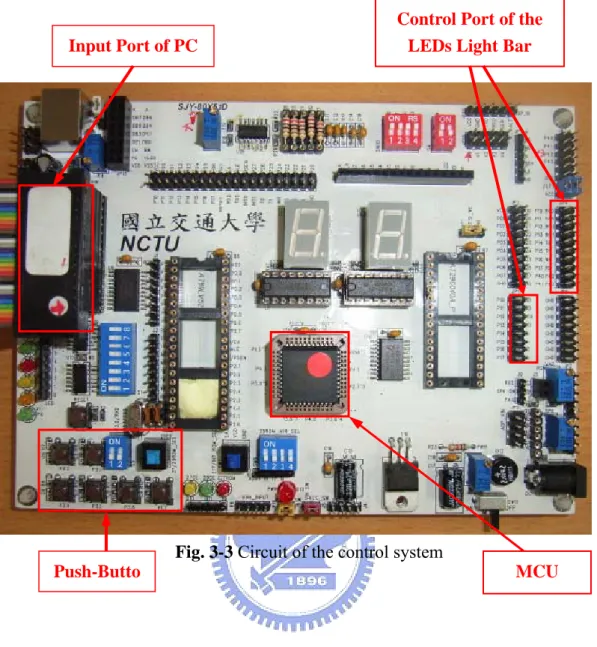
Fig. 3-3 presents the control board which is designed by Chih-Yang Su. In this control board, the MCU (micro controller unit) is principal control center, and the signals of the LEDs light bar is transmitted by the control port of the LEDs light bar.
- 20 -
Fig. 3-3 Circuit of the control system
3.4.2 LEDs Light Bar
Using LEDs as light source is suitable for FSC backlight application due to the response time is sufficiently rapid to switch the different color state. Moreover, the emission spectra of R, G and B LEDs are narrower than the color filters. In this experiment, the LEDs are provided by EVERLIGHT ELECTRONICS CO., LTD. The features of the LED are introduced as follow:
(A) Features
1. High efficiency, high luminosity. 2. Viewing angle: 120°
MCU Control Port of the
LEDs Light Bar Input Port of PC
- 21 -
3. Long operating life 4. Full color
5. Lead free
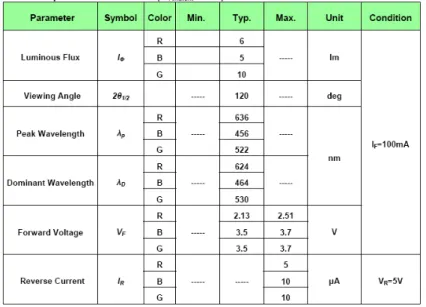
6. Soldering methods: SMT type (B) Electro-optical characteristics
The electro-optical characteristics of the LED are shown in Table 3-2 and Table 3-3.
Table 3-2 Electro-optical characteristics
- 22 -
The LEDs light-bar are adopted as the light source, as shown in Fig. 3-4. The circuits of the R, G and B LEDs light bar are shown in Fig. 3-5 (a) (b) (c), respectively.
Fig. 3-4 LEDs light bar
VLED Rdrop RLED Rdrop Rdrop VLED GLED Rdrop Rdrop Rdrop (a) (b) (c)
Fig. 3-5 Circuit of the (a) R LEDs light bar (b) G LEDs light bar (c) B LEDs light bar
3.4.3 LED Drive IC
There are many features of the LED drive IC which is produced by MACROBLOCK INC. The features are composed of
1. 16 constant-current output channels
2. Output current adjustable through an external resistor 3. Constant output current range: 5-90mA
- 23 -
4. Programmable output current gain for white balance 5. Constant output current invariant to load voltage change
3.5 Circuit Design for the Hardware of the LED
The VR, VG and VB represent the forward voltage of the R, G and B LEDs, respectively. In chapter 2, the principle of the mixing color was presented. In this experiment, the driving current are 294mA, 343mA, and 147mA in the red, green and blue LEDs light bar, respectively. Based on this condition, the voltage of the R, G and B LEDs light bar is shown in equation (3.1).
v 15.75 5 x 3.15 V v 15.5 5 x 3.1 V v 10.65 5 x 2.13 V bar ligrt -B bar ligrt -G bar ligrt -R = = = = = = (3.1)
3.5.1 Selection of the External Resister (Rext)
The output current of each channel (Iout) is set by an external resistor (Rext). After a power-on status, the relationship between Iout and Rext is shown in the following figure.
Fig. 3-6 Resistance of the external resistor, Rext (Ω)
The output current in milliamps can be calculated from the equation: 15
Rext) / (V
- 24 -
where the VRext is the initial value which is 1.4027 V (volt) approximately in the IC. The constant output current of the driving IC is 49 mA in this experiment. The Rext is obtained by Ω ≅ × =(1.4027 15) / 49mA 429 Rext (3.3)
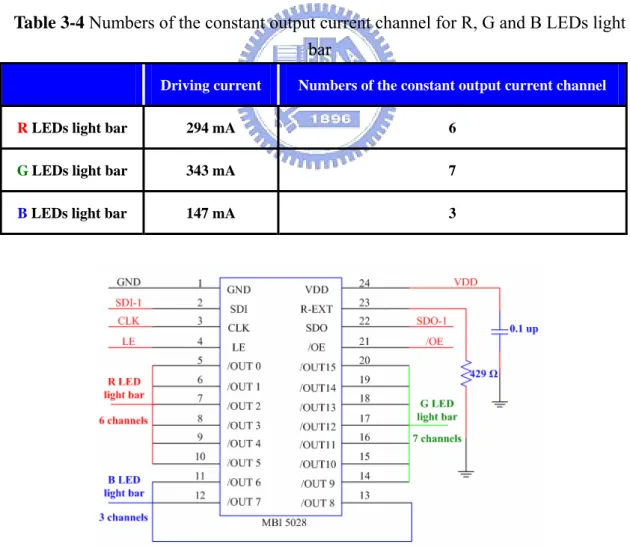
Table 3-4 shows the numbers of the constant output current channel which are computed for R, G and B LEDs light bar, respectively. The IC has 16 constant-current output channels, and the total numbers of the constant current output channel for the R, G and B LEDs light bar are 16 (6 + 7 + 3 = 16). The one horizontal block of the backlight is controlled by one driver IC. Therefore, 12 pieces of the LED driver IC is needed for the backlight module.
Table 3-4 Numbers of the constant output current channel for R, G and B LEDs light bar
Driving current Numbers of the constant output current channel
R LEDs light bar 294 mA 6
G LEDs light bar 343 mA 7
B LEDs light bar 147 mA 3
- 25 -
The terminal function of the IC is described in Fig.3-7 and Table 3-5. The current output channels in the R, G and B LEDs light bar are 6, 7 and 3, respectively.
Table 3-5 Terminal function of the IC for the LEDs light bar
Pin No. Pin name Function
1 GND Ground terminal for control logic and current sink
2 SDI Serial-data input to the Shift Register
3 CLK Clock input terminal for data shift on rising edge
4 LE Serial data is transferred to the respective latch when LE (CA1)
is high. The data is latched when LE (CA1) goes low.
5~10 Output 0~5 Provide current for R LEDs light bar
11~13 Output 6~8 Provide current for G LEDs light bar
14~20 Output 9~15 Provide current for B LEDs light bar
21 /OE When (active) low, the output drivers are enabled; when high,
all output drivers are turned OFF (blanked).
22 SDO Serial-data output to the following SDI of next driver IC
23 Rext Input terminal used to connect an external resister for setting up
all output current
24 VDD 5V supply voltage terminal
3.5.2 Selection of the LED Current Limiting Resistor
The current limiting resistor can be calculated by the Kirchhoff’s Voltage law (KVL) circuit equation: DS bar light drop S I R V V V = × + + (3.4) where Rdrop is the current limiting resistor, Vlight bar is the forward voltage of the LED
- 26 -
light bar, VS is the supply voltage, I is the driving current and VDS is the output voltage of the IC.
The values of the VDS, VS, I and Vlight bar are shown in equation (3.5).
V 15.75 V V 15.5 V V 10.65 V mA 147 I mA 343 I mA 294 I V 17 V V 1 V bar light B bar light G bar light R B G R S DS = = = = = = = = (3.5)
Rdrop is computed by equation (3.4) for R, G and B LEDs light bar, as shown in equation (3.6). Ω ≅ = Ω ≅ = Ω ≅ = 1.7 147mA 15.75V -16V (B) R 1.46 343mA 15.5V -16V (G) R 18.2 294mA 10.65V -16V (R) R drop drop drop (3.6)
3.6 Software Design & Driving Signals for the Scanning FSC Backlight
Each color sub-frame takes about 1/180 sec. The duty cycle of the illumination pulse is limited to about 50%. From the specification, the total number of gate lines is 768. If a BLM is divided into 12 scanning partitions, each single block has 64 gate lines of the TFT pixel array correspondingly, and the scanning duration over those lines is about 0.13 ms, which is the acceptable tolerance for the LC response time. Fig. 3-8 shows the simple timing relation on the scanning of LC, the TFT-array cell and the LED flash time. Moreover, the time can be calculated by the following equation:
- 27 - time flashing LED crystal liquid of time response blocks scanning lines gate whole the of time scanning time frame -sub 1 + + ≥ (3.7)
Fig. 3-8 Timing chart for multi-flashing method
- 28 -
Fig. 3-9 presents the timing relation for the duty cycle of the R, G and B LEDs. The horizontal axis is time scales, and the vertical axis is the position of the LED light bar in the backlight module. There are 12 time scales in every sub-frame, and the interval between the two time scales is 0.463 ms approximately.
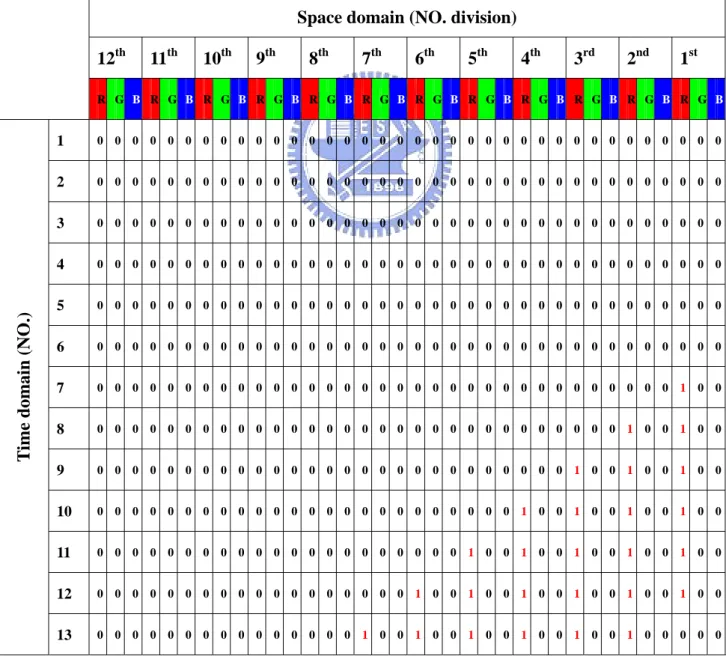
The truth table is designed by the space and time domain from Fig. 3-9, as shown in Table 3-6. “0” represents to turn on the LED, and “1” represents to turn off.
Table 3-6 Truth table for the deductive method of the scanning FSC backlight
Space domain (NO. division)
12th 11th 10th 9th 8th 7th 6th 5th 4th 3rd 2nd 1st R G B R G B R G B R G B R G B R G B R G B R G B R G B R G B R G B R G B 1 0 0 0 0 0 0 0 0 0 0 0 0 0 0 0 0 0 0 0 0 0 0 0 0 0 0 0 0 0 0 0 0 0 0 0 0 2 0 0 0 0 0 0 0 0 0 0 0 0 0 0 0 0 0 0 0 0 0 0 0 0 0 0 0 0 0 0 0 0 0 0 0 0 3 0 0 0 0 0 0 0 0 0 0 0 0 0 0 0 0 0 0 0 0 0 0 0 0 0 0 0 0 0 0 0 0 0 0 0 0 4 0 0 0 0 0 0 0 0 0 0 0 0 0 0 0 0 0 0 0 0 0 0 0 0 0 0 0 0 0 0 0 0 0 0 0 0 5 0 0 0 0 0 0 0 0 0 0 0 0 0 0 0 0 0 0 0 0 0 0 0 0 0 0 0 0 0 0 0 0 0 0 0 0 6 0 0 0 0 0 0 0 0 0 0 0 0 0 0 0 0 0 0 0 0 0 0 0 0 0 0 0 0 0 0 0 0 0 0 0 0 7 0 0 0 0 0 0 0 0 0 0 0 0 0 0 0 0 0 0 0 0 0 0 0 0 0 0 0 0 0 0 0 0 0 1 0 0 8 0 0 0 0 0 0 0 0 0 0 0 0 0 0 0 0 0 0 0 0 0 0 0 0 0 0 0 0 0 0 1 0 0 1 0 0 9 0 0 0 0 0 0 0 0 0 0 0 0 0 0 0 0 0 0 0 0 0 0 0 0 0 0 0 1 0 0 1 0 0 1 0 0 10 0 0 0 0 0 0 0 0 0 0 0 0 0 0 0 0 0 0 0 0 0 0 0 0 1 0 0 1 0 0 1 0 0 1 0 0 11 0 0 0 0 0 0 0 0 0 0 0 0 0 0 0 0 0 0 0 0 0 1 0 0 1 0 0 1 0 0 1 0 0 1 0 0 12 0 0 0 0 0 0 0 0 0 0 0 0 0 0 0 0 0 0 1 0 0 1 0 0 1 0 0 1 0 0 1 0 0 1 0 0 T
ime domain (NO.)
- 29 - 14 0 0 0 0 0 0 0 0 0 0 0 0 1 0 0 1 0 0 1 0 0 1 0 0 1 0 0 1 0 0 0 0 0 0 0 0 15 0 0 0 0 0 0 0 0 0 1 0 0 1 0 0 1 0 0 1 0 0 1 0 0 1 0 0 0 0 0 0 0 0 0 0 0 16 0 0 0 0 0 0 1 0 0 1 0 0 1 0 0 1 0 0 1 0 0 1 0 0 0 0 0 0 0 0 0 0 0 0 0 0 17 0 0 0 1 0 0 1 0 0 1 0 0 1 0 0 1 0 0 1 0 0 0 0 0 0 0 0 0 0 0 0 0 0 0 0 0 18 1 0 0 1 0 0 1 0 0 1 0 0 1 0 0 1 0 0 0 0 0 0 0 0 0 0 0 0 0 0 0 0 0 0 0 0 19 1 0 0 1 0 0 1 0 0 1 0 0 1 0 0 0 0 0 0 0 0 0 0 0 0 0 0 0 0 0 0 0 0 0 1 0 20 1 0 0 1 0 0 1 0 0 1 0 0 0 0 0 0 0 0 0 0 0 0 0 0 0 0 0 0 0 0 0 1 0 0 1 0 21 1 0 0 1 0 0 1 0 0 0 0 0 0 0 0 0 0 0 0 0 0 0 0 0 0 0 0 0 1 0 0 1 0 0 1 0 22 1 0 0 1 0 0 0 0 0 0 0 0 0 0 0 0 0 0 0 0 0 0 0 0 0 1 0 0 1 0 0 1 0 0 1 0 23 1 0 0 0 0 0 0 0 0 0 0 0 0 0 0 0 0 0 0 0 0 0 1 0 0 1 0 0 1 0 0 1 0 0 1 0 24 0 0 0 0 0 0 0 0 0 0 0 0 0 0 0 0 0 0 0 1 0 0 1 0 0 1 0 0 1 0 0 1 0 0 1 0 25 0 0 0 0 0 0 0 0 0 0 0 0 0 0 0 0 1 0 0 1 0 0 1 0 0 1 0 0 1 0 0 1 0 0 0 0 26 0 0 0 0 0 0 0 0 0 0 0 0 0 1 0 0 1 0 0 1 0 0 1 0 0 1 0 0 1 0 0 0 0 0 0 0 27 0 0 0 0 0 0 0 0 0 0 1 0 0 1 0 0 1 0 0 1 0 0 1 0 0 1 0 0 0 0 0 0 0 0 0 0 28 0 0 0 0 0 0 0 1 0 0 1 0 0 1 0 0 1 0 0 1 0 0 1 0 0 0 0 0 0 0 0 0 0 0 0 0 29 0 0 0 0 1 0 0 1 0 0 1 0 0 1 0 0 1 0 0 1 0 0 0 0 0 0 0 0 0 0 0 0 0 0 0 0 30 0 1 0 0 1 0 0 1 0 0 1 0 0 1 0 0 1 0 0 0 0 0 0 0 0 0 0 0 0 0 0 0 0 0 0 0 31 0 1 0 0 1 0 0 1 0 0 1 0 0 1 0 0 0 0 0 0 0 0 0 0 0 0 0 0 0 0 0 0 0 0 0 1 32 0 1 0 0 1 0 0 1 0 0 1 0 0 0 0 0 0 0 0 0 0 0 0 0 0 0 0 0 0 0 0 0 1 0 0 1 33 0 1 0 0 1 0 0 1 0 0 0 0 0 0 0 0 0 0 0 0 0 0 0 0 0 0 0 0 0 1 0 0 1 0 0 1 34 0 1 0 0 1 0 0 0 0 0 0 0 0 0 0 0 0 0 0 0 0 0 0 0 0 0 1 0 0 1 0 0 1 0 0 1 35 0 1 0 0 0 0 0 0 0 0 0 0 0 0 0 0 0 0 0 0 0 0 0 1 0 0 1 0 0 1 0 0 1 0 0 1 36 0 0 0 0 0 0 0 0 0 0 0 0 0 0 0 0 0 0 0 0 1 0 0 1 0 0 1 0 0 1 0 0 1 0 0 1 37 0 0 0 0 0 0 0 0 0 0 0 0 0 0 0 0 0 1 0 0 1 0 0 1 0 0 1 0 0 1 0 0 1 0 0 0 38 0 0 0 0 0 0 0 0 0 0 0 0 0 0 1 0 0 1 0 0 1 0 0 1 0 0 1 0 0 1 0 0 0 0 0 0
- 30 - 39 0 0 0 0 0 0 0 0 0 0 0 1 0 0 1 0 0 1 0 0 1 0 0 1 0 0 1 0 0 0 0 0 0 0 0 0 40 0 0 0 0 0 0 0 0 1 0 0 1 0 0 1 0 0 1 0 0 1 0 0 1 0 0 0 0 0 0 0 0 0 0 0 0 41 0 0 0 0 0 1 0 0 1 0 0 1 0 0 1 0 0 1 0 0 1 0 0 0 0 0 0 0 0 0 0 0 0 0 0 0 42 0 0 1 0 0 1 0 0 1 0 0 1 0 0 1 0 0 1 0 0 0 0 0 0 0 0 0 0 0 0 0 0 0 0 0 0 43 0 0 1 0 0 1 0 0 1 0 0 1 0 0 1 0 0 0 0 0 0 0 0 0 0 0 0 0 0 0 0 0 0 1 0 0 44 0 0 1 0 0 1 0 0 1 0 0 1 0 0 0 0 0 0 0 0 0 0 0 0 0 0 0 0 0 0 1 0 0 1 0 0 45 0 0 1 0 0 1 0 0 1 0 0 0 0 0 0 0 0 0 0 0 0 0 0 0 0 0 0 1 0 0 1 0 0 1 0 0 46 0 0 1 0 0 1 0 0 0 0 0 0 0 0 0 0 0 0 0 0 0 0 0 0 1 0 0 1 0 0 1 0 0 1 0 0 47 0 0 1 0 0 0 0 0 0 0 0 0 0 0 0 0 0 0 0 0 0 1 0 0 1 0 0 1 0 0 1 0 0 1 0 0
At the beginning, the LEDs (consist of R, G and B LED) aren’t turned on because the time domain NO.1~NO.6 consist of the TFT addressing time and the LC response time in the 1st division of the backlight. At NO.7, the R LED is turned on in the 1st division, the others LEDs are turned off, as shown in Table 3-6-1. At NO.8, the R LEDs are turned on in the 1st and 2nd division, the others LEDs are turned off. And so on, as shown in Table 3-6-2. When the action is completely finished at NO.47, the next action makes a fresh start at NO.12. Then, the action repeats the foregoing actions between NO.12 with NO.47, as shown in Table 3-6-3. Fig. 3-10 presents the block chart for the scanning FSC backlight.
- 31 -
Table 3-6-1 Truth table for time domain NO.1~NO.6
Space domain (NO. division)
12th 11th 10th 9th 8th 7th 6th 5th 4th 3rd 2nd 1st R G B R G B R G B R G B R G B R G B R G B R G B R G B R G B R G B R G B 1 0 0 0 0 0 0 0 0 0 0 0 0 0 0 0 0 0 0 0 0 0 0 0 0 0 0 0 0 0 0 0 0 0 0 0 0 2 0 0 0 0 0 0 0 0 0 0 0 0 0 0 0 0 0 0 0 0 0 0 0 0 0 0 0 0 0 0 0 0 0 0 0 0 3 0 0 0 0 0 0 0 0 0 0 0 0 0 0 0 0 0 0 0 0 0 0 0 0 0 0 0 0 0 0 0 0 0 0 0 0 4 0 0 0 0 0 0 0 0 0 0 0 0 0 0 0 0 0 0 0 0 0 0 0 0 0 0 0 0 0 0 0 0 0 0 0 0 5 0 0 0 0 0 0 0 0 0 0 0 0 0 0 0 0 0 0 0 0 0 0 0 0 0 0 0 0 0 0 0 0 0 0 0 0 6 0 0 0 0 0 0 0 0 0 0 0 0 0 0 0 0 0 0 0 0 0 0 0 0 0 0 0 0 0 0 0 0 0 0 0 0 T ime domain (NO.) 7 0 0 0 0 0 0 0 0 0 0 0 0 0 0 0 0 0 0 0 0 0 0 0 0 0 0 0 0 0 0 0 0 0 1 0 0
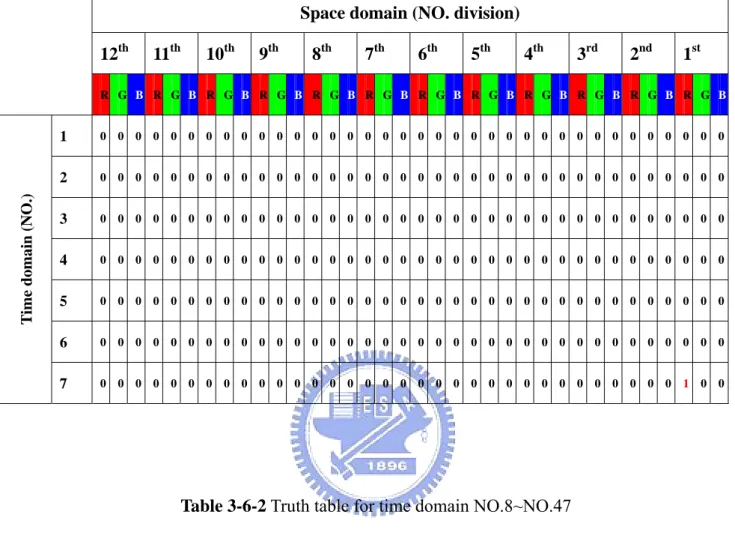
Table 3-6-2 Truth table for time domain NO.8~NO.47
Space domain (NO. division)
12th 11th 10th 9th 8th 7th 6th 5th 4th 3rd 2nd 1st R G B R G B R G B R G B R G B R G B R G B R G B R G B R G B R G B R G B 8 0 0 0 0 0 0 0 0 0 0 0 0 0 0 0 0 0 0 0 0 0 0 0 0 0 0 0 0 0 0 1 0 0 1 0 0
…
Ti m e d o m a in 47 0 0 1 0 0 0 0 0 0 0 0 0 0 0 0 0 0 0 0 0 0 1 0 0 1 0 0 1 0 0 1 0 0 1 0 0- 32 -
Table 3-6-3 Truth table for time domain NO.12~NO.47
Space domain (NO. division)
12th 11th 10th 9th 8th 7th 6th 5th 4th 3rd 2nd 1st R G B R G B R G B R G B R G B R G B R G B R G B R G B R G B R G B R G B 12 0 0 0 0 0 0 0 0 0 0 0 0 0 0 0 0 0 0 1 0 0 1 0 0 1 0 0 1 0 0 1 0 0 1 0 0
…
Ti m e d o m a in 47 0 0 1 0 0 0 0 0 0 0 0 0 0 0 0 0 0 0 0 0 0 1 0 0 1 0 0 1 0 0 1 0 0 1 0 0- 33 -
3.7 Summary
Coupling with the software and the hardware, the backlight of the scanning FSC LCD can be realized. The flow chart of the backlight circuit is shown in Fig. 3-11. At the beginning, the target color is selected. Then, we use the programming language (C language) to implement the control signals and download the control signals to the control board. The control board communicates control signals to the LED driver ICs. Finally, the output channels of the LED driver ICs provide driving current for the light bar of the backlight module.
- 34 -
Chapter 4
Experimental Results and Discussions
4.1 Introduction
In this chapter, the optical performances of BLM and the electronic characteristics of the control circuit will be given. Then, the spectral distributions and chromaticity coordinates for the different frame rate of the FSC backlight will be measured and discussed.
4.2 Light Source Properties
The package of 4-in-1 (RGGB) LEDs was used as light source. The angular distribution directly affected the whole property of the BLM. In the experiment, the performance of LEDs was measured by an integrating sphere as shown in Fig. 4-1. When current was fixed to 100mA, the voltage on green, blue and red color states were driven by 3.3V, 3.4V and 2.2V, respectively. The luminous flux for green, blue and red were 8.2lm, 2.2lm and 5.2lm, respectively.
4.3 Optomechanical Setup
The optomechanical setup composed of LED light bars, holder mechanism, and light guide units were used to demonstrate the simulation. Each light-bar PCB contained 15 packages of 4-in-1 RGGB LEDs with 3 input / output port. Furthermore, the heat sinks and holder mechanism were implemented due to the thermal and light
- 35 -
guide tilt issues as shown in Fig. 4-2.
(a)
(b)
(c)
- 36 -
(a) (b) Fig. 4-2 (a) Optomechanical setup (b) Tandem light guides combined with
optomechanical setup
4.4 Optical Performances of BLM (A) Uniformity
After measuring the light source property, the uniformity of the 2x2 tandem light guide matrix on different color states were captured and analyzed by the PM-1600 CCD camera as shown in Fig. 4-3. The uniformity by 9 points of the LG were 89%, 86%, 84%, and 85% on R, G, B, and the white color states associated with a brightness enhance film and a diffuser. In addition, according to the measurement and calculation, the optical efficiency of BLM was 63%. The lumen per watt in terms of R, G, and B color states were 33 lm/w, 37 lm/w and 9.1 lm/w, respectively. Furthermore, the discontinuity of the boundary between LGs was undistinguishable.
- 37 -
(b)
(c)
(d)
Fig. 4-3 The uniformity of 2x2 tandem light guide matrix – (a) Red (b) Green (c) Blue (d) white state
(B) Light Leakage
The light leakage from operating block penetrates to the adjacent divisions well suppressed to below the 11.86%. Beyond one division of the operating block, the leaky light is suppressed near to zero. However, because the entire light guide and driving program are still in progress,the effect of the light leakage can not be defined
- 38 -
very well. Therefore, the influence of the light leakage on the image quality with LC panel will be further evaluated in the future.
Fig. 4-4 Light leakage from operated block to the neighboring blocks
(C) Spectral Distribution
In the experiment, there were 3 kinds of the driving methods for backlight system; one was the hold type backlight, one was the FSC backlight, and the last was the scanning FSC backlight. For the FSC backlight, the duty cycle of the LED was the same to scanning FSC backlight. In such condition, the chromaticity coordinates and spectral distributions of them were the same.
(1) Hold Type
The spectral distribution of the backlight is measured by the SR-UL1R spectrometer, and the result was shown in Fig. 4-5. There were three peaks in the measurements because the light sources were 4 in 1 (RGGB) LEDs. Moreover, the positions of the spectral peak were located in the 462nm, 532nm and 650nm, respectively.
- 39 -
Fig. 4-5 Spectra of the BLM (Hold type)
(2) FSC and Scanning FSC (60Hz frame rate)
The spectral distribution of the backlight was measured and the result was shown in Fig. 4-6. The positions of the spectral peak were located in the 458nm, 529nm and 637nm, respectively.
Fig. 4-6 Spectra of the BLM (FSC or FSC with scanning)
Compared with the different driving method of the backlight (hold type backlight, FSC backlight and FSC with scanning backlight), the spectral distributions
462 532 650 458 529 637
- 40 -
of the hold type were different from the others driving type.
4.5 Electronic Characterizations of the Control Circuit
In this section, the electric signals will be verified. Fig. 4-7 presented the frame rate and the sub-frame rate in every division, and the results were measured by an TDS2024B oscilloscope. The results were used to demonstrate the operating frequency and ON-time of the R, G and B LEDs. The frame rate and sub-frame rate were operated at 16.67ms (60Hz) and 5.56ms (180Hz), respectively. Furthermore, the results were identical with the ideal signals of the FSC backlight circuit.
Fig. 4-7 Output of the frame rate (CH1) & sub-frame rate of the R, G and B, respectively (CH2)
The ON-time of the R, G and B LED were measured as shown in Fig. 4-8. For the R, G and B LEDs, the duty cycle of the sub-frame was 0.5, and the ON-time was 2.78ms approximately (5.56 / 2 = 2.78 ms) in the sub-frame. “K” represented the OFF-time of the R, G and B LED and included the TFT addressing time and LC response time.
R G B
Frame Interval
- 41 -
Fig. 4-8 ON-time of the R, G and B field, respectively
The signals of the R field were compared between the 1st and 2nd division. These signals were not triggered at the same time, and the interval of the trigger time was 0.463 ms, as shown in Fig. 4-9. The results were satisfied by the scanning FSC backlight.
- 42 -
4.6 Results of the Different Frame Rate
In this experiment, the operating frame rate of the FSC backlight (scanning FSC backlight) includes 60Hz, 80Hz, 100Hz and 120Hz (avoid the flicker). Compared with the different operating frame rate, the results were presented in Table 4-1.
Table 4-1 Chromaticity coordinates and brightness for different operating frame rate
For the different operating frame rate, the maximum deviations of the brightness were 100 nits, and the deviations of the chromaticity coordinates were 0.0005 to 0.0032, and the maximum color difference was 1.0722. The deviations are insignificant in FSC driving scheme.
4.7 Summary
The electric control system for partitioned scanning field-sequential-color LCD backlight is realized.
For the Optical performances of BLM, the uniformities on R, G and B color states exhibit 89%, 86% and 89%, respectively. The light leakage can avoid the
- 43 -
occurrence of color dependence for adjacent portions of the light guide because the partition down to 11.86% light leakage to the neighboring divisions without any shields or gaps. For the electronic characterizations of the backlight circuit, the results are identical with the ideal signals of the scanning FSC backlight.
Compared with the dynamic driving method of the backlight (FSC backlight and scanning FSC backlight), the spectral distributions of the hold type has an obviously deviation. The deviations of the peak wavelength are 4nm, 3nm and 13nm at the R, G and B field, respectively.
For the different frame rate of the FSC backlight, the maximum deviations of the brightness are 100 nits, and the deviations of the chromaticity coordinates are 0.0005 to 0.0032, and then the maximum color difference is 1.0722. The deviations are insignificant in FSC driving scheme.
- 44 -
Chapter 5
Discussions on Issues of the LEDs Backlight
5.1 Introduction
All the technologies related to the development of the LED have been rapidly evolved for the applications both in the general lighting and the display technology. However, there are still some critical concerns to be considered.
For the FSC display, the backlight is operated sequentially by individual R, G and B LEDs. In such condition, the stability of the LEDs is very important. The RGB LEDs backlight does not popularly apply due to a lack of stability to cause some issues. In this chapter, the issues of the RGB LEDs backlight will be described in detail.
5.2 Issues of the 4-in-1 (RGGB) LEDs Backlight
For the different driving methods of the backlight, the deviations of spectral distribution and chromaticity coordinate can be observed.
The results of the hold type backlight are different from the superposition of the R, G and B field in the positions of the spectral peak, maximum spectral radiance (SR) and brightness. The hold type backlight is composed of R, G and B field where the LEDs are always turned on. Compared with the superposition of the ideal R, G and B field, the hold type backlight has different spectral distributions, chromaticity coordinates and brightness. The results are shown in Table5-1. Fig. 5-1 (a) shows spectral distribution for the hold type backlight. Fig. 5-1 (b) shows superposition of
- 45 -
the spectral distribution for the ideal R, G and B field where the duty cycle of the LEDs is 100%.
Table 5-1 Results of the peak wavelength, chromaticity coordinates and brightness where the duty cycle of the LEDs is 100%
Driving type Peak (nm) Max SR L (nits)
R 650 0.9285 G 532 0.4296 15896 Hold type B 462 0.6266 R 639 1.3524 G 530 0.4686 17735 Superposition duty cycle = 100% B 459 0.7718
- 46 -
Fig. 5-1 (b) Superposition of the spectral distribution for the ideal R, G and B field (duty cycle = 100%)
On the other hand, the characteristics of the spectral distribution of the FSC backlight are similar to the superposition of the ideal R, G and B field. The FSC backlight is composed of R, G and B field where the LEDs use PWM method. The duty cycle of the R, G and B LEDs is 50 % in the sub-frame, in other words, the duty cycle of the R, G and B LEDs is 1/6 in the frame (e.g., ON-time of the LEDs is 2.78ms approximately if the frame rate is operated at 60Hz). Compared with the superposition of the ideal R, G and B field where the duty cycle of the LEDs is 1/6, the FSC backlight has the same spectral distributions, chromaticity coordinates and brightness. The results are shown in Table 5-2. Fig. 5-2 (a) shows spectral distribution for the FSC backlight, and Fig. 5-2 (b) shows superposition of the spectral distribution for the ideal R, G and B field where the duty cycle of the LEDs is 1/6.
- 47 -
Table 5-2 Results of the peak wavelength, chromaticity coordinates and brightness where the duty cycle of the LEDs is 1/6
Driving type Peak (nm) Max SR L (nits)
R 637 0.2292 G 529 0.0815 2934 FSC (60Hz) B 458 0.1300 R 635 0.2347 G 529 0.0812 2934 Superposition duty cycle = 1/6 B 458 0.1320