Urbanization and childhood leukaemia
in Taiwan
Chung-Yi Li,
aRuey S I i n
band Chuan-Hsiung I i n
cBackground In the 1980s socioeconomic development was dramatically rapid in the urbanized
municipalities of Taiwan due to a prospering economy. This study addressed the
question: Could differences in the incidence of childhood leukaemia (age <15)
be demonstrated between urban and rural communities in Taiwan between 1981
and 1990?
Methods The log-linear regression model was used to assess the effects of age, level of
urban-ization, and calendar year on the variation of childhood leukaemia incidence
rates between 1981 and 1990.
Results Between 1981 and 1990, the overall incidence rate of childhood leukaemia
in-creased by 20% (rate ratio (RR) = 1.2, 95% CI: 1.0-1.5). As compared to rural
areas, metropolitan regions showed a significandy higher incidence rate during
the study period (RR = 1.3, 95% CI: 1.1-1.6). This urban-rural difference was
particularly notable among children <5 years old (RR = 1.5, 95% CI: 1.2-1.9).
Dose-response analysis further indicated that risk of childhood leukaemia was
monotonically associated with levels of urbanization. The significant gradient in
the risk of childhood leukaemia with urbanization was contributed solely by
children in the 0-4 years age group.
Conclusions We noticed a relationship between urbanization and risk of leukaemia in
chil-dren. Because of a dramatic influx of people into metropolitan areas during the
1980s, our findings may have provided support for the putative association
be-tween 'population mixing' or 'population density' and risk of childhood leukaemia.
Whether such association can be attributable to virus infection or other
aetio-logically related leukemogens warrants further investigations.
Keywords Childhood leukaemia, population density, population mixing, infection, relative
risk, urbanization
Accepted 21 November 1997
Taiwan has experienced rapid socioeconomic development
resulting in changes in many aspects of lifestyle and disease
patterns in the past 30 years. In the 1950s infectious diseases
were the predominant cause of deaths in children. Today,
accid-ents and malignancies are the leading causes of death for
chil-dren below the age of 15. Among childhood cancers, leukaemia
is the most common one.
Childhood leukaemia incidence rate has shown a global
varia-tion in which African countries generally experience a lower
risk.' Competing causes of death and underdiagnosis of cancer
" Department of Public Health, College of Medicine, Fu Jen Catholic University, 510 Chung Cheng Rd., Hsinchuang, Taipei Hsiea 24205, Taiwan.
b Institute of Epidemiology, College of Public Health, National Taiwan
University, Taipei. Taiwan.
c Department of Hospital and Health Care Administration, Chung Tai Junior College, Taichung, Taiwan.
have been suggested to account for such variation. Nonetheless, factors associated with modernization could have contributed to a higher childhood leukaemia incidence rate in the developed world as well. Epidemiological studies have shown that risk of childhood leukaemia is associated with socioeconomic status as measured by residential area and paternal occupation.2'3 Because
modernization, urbanization, and socioeconomic status are known to be highly interrelated, these epidemiological findings may suggest that factors associated with urbanization have played a role in the causation of childhood leukaemia. Between 1980 and 1990 Taiwan has experienced a remarkably dramatic advancement in economic development resulting in rapid urban-ization and enormous lifestyle changes. The purpose of the present study is to investigate whether such a rapid economic development in Taiwan, along with urbanization and lifestyle changes, has affected the occurrence of childhood leukaemia. We used the data of incident childhood leukaemia cases reported 587
5 8 8 INTERNATIONAL JOURNAL OF EPIDEMIOLOGY
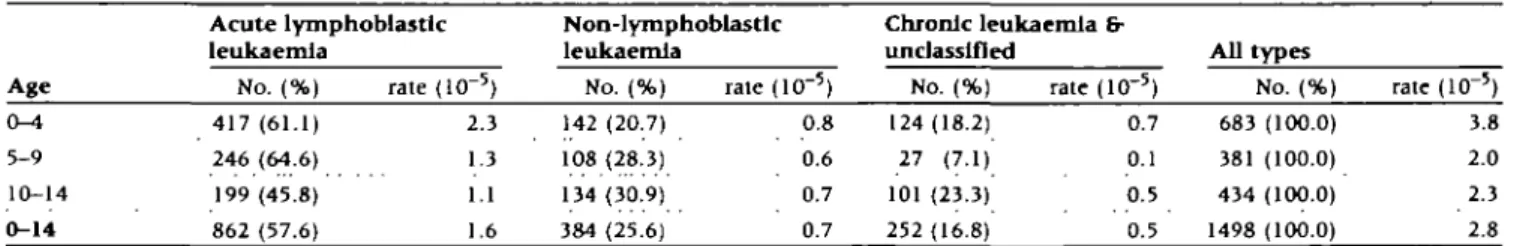
Table 1 Age-specific distribution of types of childhood leukaemia in Taiwan, 1981-1990 Acute lymphoblastic
leukaemia
Non-lymphoblastlc leukaemia
Chronic leukaemia fr
unclassified All types
A g e 0-4 5-9 10-14 0-14 No. (%) 417 (61.1) 246 (64.6) 199 (45.8) 862 (57.6) rate (10~5) 2.3 1.3 1.1 1.6 No. (%) 142 (20.7) 108 (28.3) 134 (30.9) 384 (25.6) rate (10~5) 0.8 0.6 0.7 0.7 No. (%) 124 (18.2) 27 (7.1) 101 (23.3) 252 (16.8) rate (10~5) 0.7 0.1 0.5 0.5 No. (%) 683 (100.0) 381 (100.0) 434 (100.0) 1498 (100.0) rate (10~5) 3.8 2.0 2.3 2.8
to Taiwan's Cancer Registry Center between 1981 and 1990 to explore time trends and geographical variations of childhood leukaemia incidence rates.
Materials and Methods
Study subjects and base population
All childhood leukaemia cases (International Classification of
Diseases for Oncology (ICD-O) codes 980-994) diagnosed between
1979 and 1990 in Taiwan were retrieved from the national cancer registry. For each case, sex, age at diagnosis, type of leuk-aemia, and district of residence were collected for analysis. The accuracy and completeness of cancer registry were evaluated elsewhere.4 It suggested that the registration for the first 2 years
is less complete. To avoid a false sense of rising secular trend in childhood leukaemia, the 1979 and 1980 data were excluded from the analyses. The annual district-age-specific (0-4, 5-9, 10-14 years) population sizes between 1981 and 1990 were derived from the national annual census statistics published by Ministry of the Interior of Taiwan. With the above information, we were able to calculate annual district-age specific incidence rates of childhood leukaemia.
Classification of urban/rural districts
Each district in Taiwan (a total of 361 districts) is given an index of one to eight according to its degree of urbanization. The level of urbanization was determined using the urban-rural classifica-tion of Tzeng and Wu, in which populaclassifica-tion density, age composi-tion, mobility, economic activity and family income, educational level, and health and sanitation facilities were integrated into a single index.5 The district with the highest degree of
urbaniza-tion, such as the Taipei metropolitan area, was given an index of one, while the mountainous areas with the least degree of urbanization were indexed as eight. For the purpose of study, we redassified the districts into four levels of urbanization with urbanization indices of one or two combined into the category 'metropolitan', three or four into the category 'city', five or six into the category 'town', and seven or eight into the category 'rural area'.
Statistical analysis
Childhood leukaemia incidence rates were calculated for five 2-year periods i.e. 1981-1982, 1983-1984, 1985-1986, 1987-1988 and 1989-1990, for the age groups 0-4 , 5-9 and 10-14 years, respectively. The log-linear model, with the natural loga-rithm of incidence rates as the dependent variable, was used to fit grouped data from three age groups (0-4, 5-9, 10-14), five 2-year periods (1981-1982 to 1989-1990), and four levels
of urbanization (metropolitan, city, town, and rural areas). The log-linear model was fitted with standard Poisson distribution assumption and was used to assess the effects of age, period, and urbanization on the variation of childhood leukaemia incidence rates.6 The ratio of two incidence rates was calculated using the
formula em, where m is the regression coefficient. The statistical
significance for the effect of childhood leukaemia incidence rates by age, period, and level of urbanization individually or combined was tested using analyses of deviance for the log-linear model. The analysis of deviance was also used to test for secular trend of incidence rates and for dose-response relation-ship between risk of childhood leukaemia and levels of urban-ization by fitting a model with a term for period coded 1 to 5 and a term for levels of urbanization coded 1 to 4, respectively. We used GLIM computer package to fit the log-linear regression model.7
Results
Descriptive epidemiology
A total of 1498 cases of childhood leukaemia (<15 years old) diagnosed between 1981 and 1990 were reported to the Cancer Registry Center of Taiwan. Among them, 57.6% were acute lym-phoblastic leukaemia, 25.6% were non-lymlym-phoblastic leukaemia, and the other 16.8% were chronic leukaemia and those unclas-sified. The distributions of types of childhood leukaemia were not similar across age groups. Acute lymphoblastic leukaemia was the commonest subtype in all age groups with a pronounced peak at age 0-4, whereas the incidence rate of non-lymphoblastic leukaemia was rather similar in all age groups (Table 1).
The annual variation in age-specific incidence rates showed a significant increase of 20% (rate ratio (RR) = 1.2, 95% CI : 1.0-1.4) from 2.3 per 105 in 1981-1982 to 2.7 per 105 in
1989-1990 (Table 2). The incidence rate in children aged 0-4 was consistently higher than those of older ages over the study period (data not shown). Although variable, the incidence rates among children of different ages all showed a moderate but non-significantly rising trend in the 1980s.
Prediction of incidence rates by age,
period and urbanization
We fitted separate models to assess the crude and adjusted effects of age, year of diagnosis (calendar year or period), and level of urbanization on the variation of childhood leukaemia incidence rates (Table 3). The model fitted with age or level of urbanization was significantly better than that fitted with the constant term alone, indicating that the variation in childhood leukaemia incidence rates can be significantly explained by age
Table 2 Age-specific relative risk estimates and 95% confidence interval (CI) of childhood leukaemia, using '1981-1982' as reference, In Taiwan, 1981-1990 Calendar year Age N° RR" CIa N RR CI N RR CI N RR CI 1981-1982 142 1.0 59 1.0 64 1.0 265 1.0 1983-1984 147 1.0 0.8-1.3 86 1.4 1.0-1.9 98 1.6 1.1-2.1 331 1.2 1.0-1.4 1985-1986 130 1.0 0.8-1.3 72 1.1 0.8-1.6 87 1.4 1.0-1.9 289 1.1 0.9-1.4 1987-198S 124 1.0 0.8-1.3 80 1.2 0.9-1.7 112 1.7 1.3-2.4 316 1.2 1.0-1.4 1989-1990 140 1.2 1.0-1.5 84 1.4 1.0-1.9 73 1.1 0.8-1.5 297 1.2 1.0-1.4
Test for trend in the rate of childhood leukaemia incidence
Deviance difference DF" difference
0-4 5-9 10-14 0-14 2.09 1.68 0.46 3.32 1 >0.05 1 >0.05 1 >0.05 1 >0.05
* DF = degree of freedom; RR = rate ratio.
b Statistical significance based on f} Jest. c Number of cases.
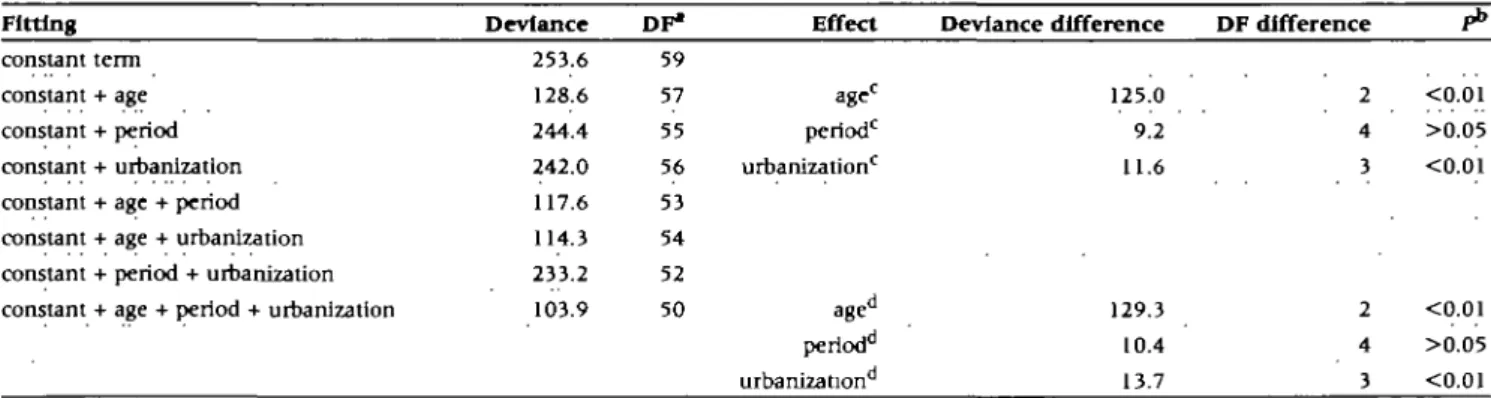
Table 3 Analysis of deviance for log-linear model, assessing the effect of age, calendar year (period), and urbanization level on the childhood leukaemia incidence in Taiwan, 1981-1990
Fitting Deviance DF1 Effect Deviance difference DF difference
constant term constant + age constant + period constant + urbanization constant + age + period constant + age + urbanization constant + period + urbanization constant + age + period + urbanization
253.6 128.6 244.4 242.0 117.6 114.3 233.2 103.9 59 57 55 56 53 54 52 50 age0 period0 urbanization0 age" periodd urbanization 125.0 9.2 11.6 2 4 3 <0.01 >0.05 <0.01 129.3 10.4 13.7 2 4 3 <0.01 >0.05 <0.01 ' DF = degree of freedom. b Significance based on x2 test.
c Crude effect. d Adjusted eflect.
and level of urbanization individually. On the other hand, the crude effect of period on the variation in childhood leukaemia incidence rates was compared to null. In the assessment of adjusted effects, the addition of age to the period-urbanization model gave the most significant improvement. The adjusted effect of level of urbanization was statistically significant as well. Although the addition of period to the age-urbanization model gave some further improvement, such improvement was not statistically significant. The analysis of deviance indicated that both age and level of urbanization were able to significantly predict the variation in childhood leukaemia incidence rates.
Time trend of Incidence rates by ages
Table 2 shows the secular trend of age-spedfic relative risk es-timates, using the incidence rate of 1981-1982 as reference, of childhood leukaemia between 1981 and 1990. Over the 10-year
period, the overall incidence rate of childhood leukaemia in-creased by 20% (RR = 1.2, 95% CI: 1.0-1.4). The increase was particularly evident in children between 5 and 9 (RR = 1.4, 95% CI: 1.0-1.9). Nonetheless, the rising trends for the overall and for the three age-specific incidence rates were all compared to null statistically, suggesting again that the secular change of risks of childhood leukaemia was not significant.
Age-specific incidence rates by level of urbanization
Table 4 shows the overall and the age-specific relative risk estimates, using the incidence rate of rural areas as reference, of childhood leukaemia with increasing levels of urbanization. The metropolitan children experienced a 1.3 fold (RR = 1.3, 95% CI: 1.1-1.6) higher incidence rate than that of children in rural areas (2.9 per 105 versus 2.2 per 105). Further age-specific
5 9 0 INTERNATIONAL JOURNAL OF EPIDEMIOLOGY
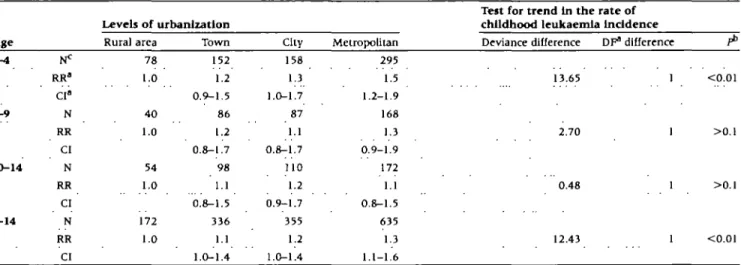
Table 4 Trend of relative risk estimates of childhood leukaemia with increasing level of urbanization, using 'rural area' as reference, by age in Taiwan, 1981-1990
A g e
Levels of urbanization
Rural area Town City Metropolitan
Test for trend In the rate of childhood leukaemia Incidence Deviance difference DF" difference
0 - 4 5 - 9 10-14 0-14 RR* CI« N RR CI N RR CI N RR CI 78 1.0 40 1.0 54 1.0 172 1.0 152 1.2 0.9-1.5 86 1.2 0.8-1.7 98 1.1 0.8-1.5 336 1.1 1.0-1.4 158 1.3 1.0-1.7 87 1.1 0.8-1.7 110 1.2 0.9-1.7 355 1.2 1.0-1.4 295 1.5 1.2-1.9 168 1.3 0.9-1.9 172 1.1 0.8-1.5 635 1.3 1.1-1.6 13.65 2.70 0.48 12.43 <0.01 1 >0.1 1 >0.1 1 <0.01
" DF = degree of freedom; RR «. rate rauo; CI = 95% confidence Interval.
b Statistical significance based on %2 test.
c Number of cases.
mostly noted in children of 0—4 years old (4.4 per 105 versus 2.9
per 105, RR= 1.5, 95% CI : 1.2-1.9), and that the rate ratios for
the other ages were only moderately and non-significantly elevated (Table 4). The trend analysis also suggested that the overall incidence rates showed a statistically significant urban-ization gradient (P for trend test < 0.01), and the urbanurban-ization gradient was solely evident (P for trend test < 0.01) in children below 5 years old.
Discussion
Between 1981 and 1990 the incidence rate of leukaemia sig-nificantly increased by 20% in Taiwan's children under 15 years old. Although a slightly rising trend in the incidence rates was observed, this did not reach statistical significance. In addition, the overall incidence rate was significantly higher in metro-politan than in rural areas. Such metrometro-politan/rural difference was mostly notable in children aged < 5 years. The dose-response analysis further showed a significant gradient in the incidence rates with levels of urbanization, in particular among children under ages of 5. The main results from the study may imply that factors related to modernization or urbanization could be asso-ciated with the occurrence of childhood leukaemia. These factors may include lifestyle changes, sodoeconomlc improvement, and growing diversity and the amount of environmental and industrial hazards.
One may reasonably postulate that improvements in cancer diagnosis, access to medical care, and registration completeness may account for a higher incidence rate of childhood leukaemia in Taiwan's urban regions. Because the significant urbanization-childhood leukaemia association was observed only in children less than 5years old, the association found between level of urbanization and incidence rates would not be merely an artefeact. Moreover, assessment of Taiwan's cancer registry also showed no urban/rural difference in registration completeness.4
Although improvements in cancer diagnosis, access to medical
care, and registration completeness made little contribution to the observed urbanization-childhood leukaemia association, they were likely to be responsible for the moderate secular increase in the incidence rates.
Similar findings have been reported in some previous studies. Two British studies concluded that there was evidence of a general tendency for lymphoid leukaemia to cluster in areas of higher socioeconomic status, in particular for those aged under 5.8'9 A review of other studies in the US, UK, and
Aust-ralia also indicated higher risks of childhood leukaemia associated with higher socioeconomic status.1 Because some indicators
used in our study to determine levels of urbanization, such as family income, educational level, and health and sanitation facilities were highly related to socioeconomic status, our results may also suggest a possible relation of childhood leukaemia to higher socioeconomic status. Moreover, the similarity of age ranges (i.e. <5 years old) at which socioeconomic status most significantly associated with childhood leukaemia as reported in the British study and in this study was of particular interest. This may have an implication that a common aetiologic factor manifested in different ways.
Childhood leukaemia has frequently been proposed as asso-ciated with exposure to infection as a result of population mix-ing.8 A recent study in the US showed a 40% higher risk in
areas of high population density than in low population-density areas.10 One latest study of Chinese child population in Hong
Kong also indicated significant evidence of clustering of acute lymphoblastic leukaemia in areas with extreme population mix-ing.11 Taiwan's economy developed very rapidly in the 1980s.
During this period there was a dramatic increase in population mixing arising from influxes of the rural population into metro-politan areas for better employment opportunities, and child-hood leukaemia might have increased as a consequence of population mixing. As shown in Table 5, the population of all ages increased by 24.2% over the study period in metropolitan regions, and the metropolitan childhood population (<15 years)
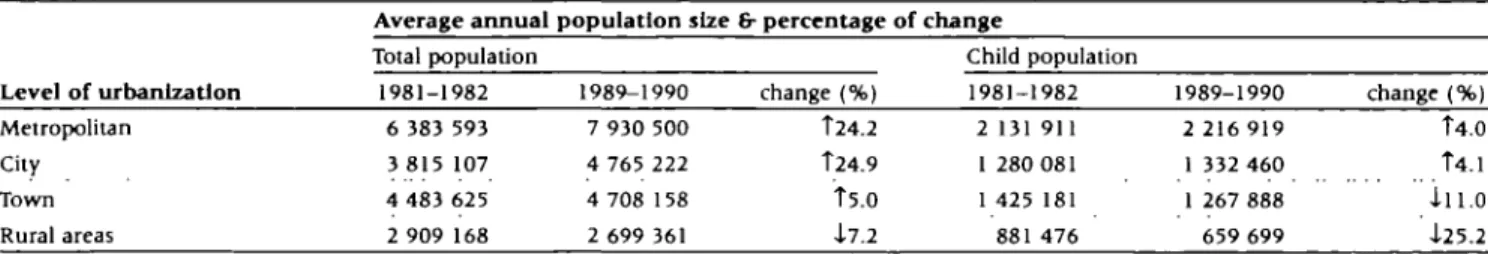
Table 5 Changes in average population size between '1981-1982' and 1989-1990' by level of urbanization
Average annual population size 8- percentage of change Level of urbanization Total population 1981-1982 6 383 593 3 815 107 4 483 625 2 909 168 1989-1990 7 930 500 4 765 222 4 708 158 2 699 361 change (%) T24.2 T24.9 T5.0 4-7.2 Child population 1981-1982 2 131 911 1 280 081 1 425 181 881 476 1989-1990 2 216 919 1 332 460 1 267 888 659 699 change (%) T4.0 T4.1 4.H.0 4-25.2 Metropolitan City Town Rural areas
also increased by 4.0% within the same period. On the other hand, the total and childhood populations in rural areas de-creased by 7.2% and 25.2%, respectively. Given the sustained decline in birth rates since the early 1960s in Taiwan, the in-crease in population in urban regions was largely due to the migration of people from rural parts of the island. From the above information, our study seems able to provide support for the putative association between population mixing and risk of childhood leukaemia. Whether the possible association between population mixing and risk of childhood leukaemia has been due to infection, however, cannot be substantiated in our study. In summary, there was a general tendency for childhood leukaemia incidence to be higher in urban regions of Taiwan between 1981 and 1990. The association found between urban-ization and risk of childhood leukaemia can be interpreted in two ways. Firstly, because population density was an integral element of urbanization and there was a notable population mixing in the 1980s, our result may provide empirical support for the hypothesis that population mixing may account for higher risks of childhood leukaemia possibly due to increased susceptibility to infeaion in children. Secondly, although our data are sup-portive of the 'infeaion' hypothesis for childhood leukaemia, our findings would not preclude the possibility that certain en-vironmental hazards and/or urbanization-related lifestyle changes may have played important roles in causing the urbanization-leukaemia association in children. We therefore suggest that further research is desirable to examine whether the association between urbanization and childhood leukaemia can be attri-butable to an individual's exposure to virus infeaion or other urbanization-related hazards.
References
1 Greenberg RS, Shuster JL. Epidemiology of cancer in children. Epidemiol Rev 1985:7:22-48.
2 Browning D, Gross S. Epidemiological studies of acute childhood
leuk-emia. A survey of Guyahoga, Ohio. Am J Dis Child 1968,116:576-85.
3 Mcwhirter WR. The relationship of incidence of childhood
lympho-blastic leukaemia to sodal class. Br J Cancer 1982;46:640-45.
4Yauo RH. Quality Assessment of Cancer Registry in Taiwan. MSc Dissertation, National Taiwan University Taipei, Taiwan, 1992 (in Chinese with English Abstract).
5 Tseng KH, Wu TY. Characteristics of urbanization level in Taiwan
Districts. Geographical Res 1986,12:287-323.
6 Holford TR. The estimation of age, period and cohort effects for vital
rates. Biometrics 1983:39:311-24.
7 Baker RG, Nelder JA (eds). The GLIM System. Release 3. Oxford,
Numerical Algorithms Group, 1978.
8Kinlen LJ, Clarke K, Hudson C. Evidence from population mixing
in British new towns 1946-85 of an infective basis for childhood leukaemia. Lancet 1990:336:577-32.
'Draper GJ (ed.). The geographical epidemiology of childhood leukaemia and non-Hodgkin lymphomas in Great Britain, 1966-83. Studies on Medical and Population Subjects. No. 53 London, UK, HMSO, 1991.
l 0Muirhead CR. Childhood leukemia in metropolitan regions in the
United States: a possible relation to population density. Cancer Cause
Control 1995:6:383-88.
1' Alexander FE, Chan LC, Lam TH el al. Clustering of childhood
leukaemia in Hong Kong: association with the childhood peak and common acute lymphoblastic leukaemia and with population mixing.