How Can Teleostean Inner Ear Hair
Cells Maintain the Proper Association
with the Accreting Otolith?
JEN-CHIEH SHIAO,1 LI-YIH LIN,2 JIUN-LIN HORNG,1 PUNG-PUNG HWANG,1*
AND TOYOJI KANEKO3
1Institute of Zoology, Academia Sinica, Taipei 11529, Taiwan
2Department of Physical Therapy, Shu-Zen College of Medicine and Management, 821 Kaohsiung, Taiwan
3Department of Aquatic Bioscience, Graduate School of Agricultural and Life Sciences, University of Tokyo, 113– 8657 Tokyo Japan
ABSTRACT
The perception of equilibrium and sound in fish depends on the deflection of hair bundles of hair cell by the otolith. However, the accreting nature of teleostean otoliths poses a problem for maintenance of proper contact between the hair bundle and the otolith surface. Immu-nocytochemical staining localizes abundant proton-secreting H⫹-ATPase in the apical mem-brane of the hair cells. The H⫹-ATPase-mediated proton secretion into the endolymph causes an approximately 0.4-unit pH decrease, which was quantified by an H⫹-selective microelec-trode. Thus, the hair cells maintain the proper distance from the otolith by neutralizing the alkaline endolymph to retard CaCO3deposition on the otolith opposite the sensory macula. Carbonic anhydrase, which hydrolyses CO2and produces HCO3
–and H⫹, was also localized in the hair cells. Ionocytes showed prominent immunostaining of carbonic anhydrase and Na⫹-K⫹-ATPase, indicating its role in transepithelial transport of HCO3
–across the mem-branous labyrinth into the endolymph. Ionocytes form a ring closely surrounding the sensory macula. HCO3
–secreted from the ionocytes may serve as a barrier to neutralize H⫹diffused from the sensory macula while keeping the endolymph alkaline outside the sensory macula. The ingenious arrangement of ionocytes and hair cells results in a unique sculptured groove, which is a common feature on the proximal surface of all teleostean otoliths. J. Comp. Neurol. 488:331–341, 2005. ©2005 Wiley-Liss, Inc.
Indexing terms: labyrinth; auditory system; Hⴙ-ATPase; Hⴙ-selective microelectrode; hearing; vestibule
The sense of equilibrium depends on mechanosensory hair cells, which detect the acceleration and tilt of the head relative to gravity (Hudspeth, 1989). Hair cells pos-sess hair bundles consisting of many stereocilia and a kinocilium protruding into the endolymph-filled membra-nous labyrinth. In the mammalian vestibular apparatus, the hair bundle is embedded within a gelatinous otoconial membrane that contains thousands of microscopic otoco-nia, averaging 10m in length (Lim, 1984). Relative mo-tion between the hair cell and the otoconial membrane results in deflection of the hair bundle and initiates a nerve impulse that is transmitted to the vestibulocochlear nerve (Hudspeth, 1989).
The teleostean inner ear differs structurally from that of mammals. Mammals have two otolith organs, the utricle and the saccule, whereas teleosts have an additional
oto-lith organ, the lagena. Furthermore, the hair bundles of teleostean inner ear hair cells directly contact the otolith surface (Schellart and Wubbels, 1998). Moreover, the size and morphology of mammalian otoconia are stable after the individual matures, but the teleostean otolith grows
Grant sponsor: National Science Council of Republic of China; Grant number: NSC 92-2811-B-001-068.
The first two authors contributed equally to this work.
*Correspondence to: Pung-Pung Hwang, Institute of Zoology, Academia Sinica, No. 128, Sec. 2, Academia Rd., Nankang, Taipei, Taiwan, Republic of China 11529. E-mail: pphwang@gate.sinica.edu.tw
Received 6 September 2004; Revised 30 November 2004; Accepted 17 February 2005
DOI 10.1002/cne.20578
Published online in Wiley InterScience (www.interscience.wiley.com). THE JOURNAL OF COMPARATIVE NEUROLOGY 488:331–341 (2005)
continually throughout a fish’s life (Campana and Neilson, 1985). However, an accreting otolith takes more and more space, posing a problem for maintenance of the proper contact between hair cells and otoliths. Without a protec-tive mechanism, the growing otolith would eventually crush the hair cells, impairing equilibrium and hearing functions. It is not clear how the hair cells can simulta-neously maintain close contact with the otolith and avoid being compressed by the accreting otolith onto the bony auditory capsule. All teleostean otoliths grow much more slowly at the sulcus, a sculptured groove along the medial face of the proximal surface of the otolith (Dunkelberger et al., 1980). Facing the sulcus is the sensory macula, which contains numerous hair cells. This suggests that the hair cells can somehow regulate otolith growth to keep the proper association with the otolith surface.
The teleostean otolith grows by adding mainly CaCO3 and a few protein fibers to the otolith surface in a daily cycle (Pannella, 1971; Campana and Neilson, 1985). In teleosts, the alkaline endolymph favors the combination of Ca2⫹ and HCO3
– to form CaCO
3 (Payan et al., 1997). Thus, we hypothesize that the hair cell may retard CaCO3 biomineralization by acidifying the regional endolymph near the sensory macula. Acidification of the intra- and extracellular compartment is usually carried out by proton-secreting ion transporters in specialized cells (Brown and Breton, 1996). In this study, we localize the vacuolar H⫹-ATPase in the apical membrane of hair cells by immunocytochemical staining. H⫹activity (pH) medi-ated by H⫹-ATPase at apical sides of the hair cell was evaluated by H⫹-selective microelectrode technique.
MATERIALS AND METHODS
Labyrinth extraction
Adult zebrafish, Danio rerio, approximately 0.2 g in wet weight and 3 cm in total length, were obtained from lab-oratory stock. All fish handling complied with the protocol of “Animal care and utilization of Academia Sinica” for experiments on animals. Fish were maintained at a den-sity of three to six individuals per liter at 26 –29°C, pH 7.7. To obtain the inner ear tissue, fish were anesthetized with 0.1 mg ml–1MS 222 solution (3-aminobenzoic acid ethyl ester; Sigma, St. Louis, MO), then decapitated, and their skulls were opened with small scissors under a stereomi-croscope. The brain was removed forward to expose the otoliths. The posterior cranium containing the bony audi-tory capsules was cut off and placed in a petri dish con-taining phosphate-buffered saline (PBS). The lagena and saccule containing the otoliths were extracted by forceps from the bony capsules. The process from decapitation to lagena and saccule removal was completed within 5 min-utes. The extracted lagena and saccule were used for im-munocytochemical staining and immunoblotting. At least 100 fish were examined for the presence of Na⫹-K⫹ -ATPase, carbonic anhydrase, and H⫹-ATPase in the lag-enar and saccular epithelial cells.
Antibodies
Antibodies against Na⫹-K⫹-ATPase, carbonic anhy-drase and H⫹-ATPase were used as the primary antibod-ies. Mouse anti-chicken Na⫹-K⫹-ATPase␣-subunit mono-clonal antibody was purchased from the Developmental Studies Hybridoma Bank, Iowa University. Rabbit
anti-flounder gill carbonic anhydrase polyclonal antibody was provided by Sender et al. (1999). The polyclonal antibody against the H⫹-ATPase was raised against the␣-subunit of killifish H⫹-ATPase (Katoh et al., 2003). The secondary antibody for immunofluorescent staining was fluorescein isothiocyanate (FITC)- or Cy5-conjugated goat anti-rabbit IgG and Texas red- or FITC-conjugated goat anti-mouse IgG (Jackson Immunoresearch, West Grove, PA). TRITC-conjugated phalloidin (Sigma) was used to stain the actin-rich hair bundle of the hair cells. The secondary antibody for immunoblotting was alkaline phosphatase-conjugated goat anti-mouse or goat anti-rabbit IgG (Jackson Immu-noresearch).
Immunofluorescent staining
Extracted lagena and saccules were immediately fixed in 4% paraformaldehyde in 0.1 M phosphate buffer (PB; pH 7.4) for approximately 20 minutes at 4°C. After being washed in PBS for 10 minutes, fixed tissues were treated with 100% ethanol for 10 minutes at –20°C and washed again in PBS. Tissues were immersed in 3% bovine serum albumin (BSA) at room temperature for 30 minutes to block nonspecific binding, then incubated in PBS-diluted primary antibody (1:100 –1:500) for 2 hours at room tem-perature or overnight at 4°C. To label the hair bundle, lagena and saccules were incubated in 30 nM TRITC-conjugated phalloidin solution for 5 minutes at room tem-perature. Samples were washed in PBS for 10 minutes twice and incubated with PBS diluted secondary antibody (1:100) for 1 hour at room temperature. Images were ac-quired with a confocal laser scanning microscope after washing twice in PBS for 10 minutes. Control tissues were processed in parallel without a primary antibody. Some otolith chambers were fixed and stained without removing otoliths so that all the epithelial cell types could be ob-served in their original position relative to the otolith.
Confocal laser scanning microscope
Stained lagena and saccules were observed with a Leica TCS NT confocal laser scanning microscope equipped with an argon laser (488 and 514 nm) for excitation, with a Leica DMRE microscope attached. The stained images of Na⫹-K⫹-ATPase, carbonic anhydrase, and H⫹-ATPase were obtained with the use of a FITC/Texas red/Cy5 filter set, and stained images of actin were obtained with a TRITC filter set controlled by Leica TSC NT software. With the filter set, the emission wavelengths of TRITC-conjugated phalloidin or FITC-, Texas red-, or Cy5-conjugated antibodies were separated and transmitted to different photomultipliers. The images from each photo multiplier were subsequently merged to visualize the la-bels simultaneously.
Immunoblotting
The membranous labyrinths were collected and pooled from 50 zebrafish. Approximately 15–30g of labyrinth protein was heated at 37°C (for Na⫹-K⫹-ATPase) for 10 minutes or 95°C (for carbonic anhydrase and H⫹-ATPase) for 3 minutes and fractionated with prestained molecular weight standards (Bio-Rad) and mouse kidney (positive control) by electrophoresis on sodium dodecyl sulfate (SDS)-containing 8% polyacrylamide gels. Separated pro-teins were transferred from unstained gels to polyvinyli-dene difluoride membranes (PVDF-Plus; MSI) by using a tank transfer system (Electrotransfer, TE22; Hoefer).
Blots were preincubated for 30 minutes in PBST buffer [137 mM NaCl, 3 mM KCl, 10 mM Na2HPO4, 2 mM KH2PO4, 0.2% (v/v), Tween 20, pH 7.4] containing 5% (wt/v) nonfat dried milk to minimize nonspecific binding, then incubated overnight with the same primary antibody used in the immunofluorescent staining diluted in PBST (1:5,000). The blot was washed in PBST, followed by 1 hour of incubation with secondary antibody diluted ⫻4,000 in PBST. Blots were visualized after incubation with 0.015% nitroblue tetrazolium and 0.07% bromo-chloroindolyl phosphate in a reaction buffer (100 mM Tris, 100 mM NaCl, 5 mM MgCl2, pH 9.5).
H
ⴙ-selective microelectrode technique
An H⫹-selective microelectrode technique was used to measure H⫹activity (pH) at apical sides of the hair cell. Microelectrodes with a tip diameter of 3– 4m were pulled from glass capillary tubes (World Precision Instruments, Sarasota, FL; TW 150-4, with 1.12 and 1.5 mm inner and outer diameters, respectively) by using a Sutter P-97 Flaming Brown pipette puller (Sutter Instruments, San Rafael, CA). These were then baked in covered dishes at 200°C overnight and the covers were removed before fur-ther baking at 200°C for at least 1 hour.
Microelectrodes were constructed as follows. The capil-laries were back-filled with a 1 cm column of 100 mM KCl/H2PO4 (pH 7.0) and then front loaded with a 20 – 30-m column of liquid ion exchanger (LIX) cocktail (Hy-drogen Ionophore I-cocktail B; Fluka). The H⫹-selective microelectrode connected with an operational amplifier (IP Amp, Ion Polarographic Amplifier; Applicable Elec-tronics, East Falmouth, MA) via an Ag/AgCl wire elec-trode holder (World Precision Instruments), and the cir-cuit was completed by placing a salt bridge (3 M potassium acetate, 10 mM KCl, in 3% agarose connected to a Ag/AgCl wire).
Microelectrode positioning was achieved with a stepper motor-driven three-dimensional (3D) positioner (Applica-ble Electronics). Data acquisition, preliminary processing, and control of the 3D electrode positioner were performed with ASET software (Science Wares, East Falmouth, MA). The electrode system was attached to an Olympus upright microscope (BX-50WI; Olympus, Tokyo, Japan). A ⫻10 dry and a ⫻40 (working distance 3.3 mm) water-immersion objective lens under a differential interference contrast (DIC) device were used. The microscope equipped with a CCD camera allowed images to be visualized on a color monitor and recorded with frame grabber and ASET software. The entire assembly on a 1/4-inch steel plate was located inside a Faraday cage suspended on an air table for vibration suppression.
Prior to the collection of biological data, the microelec-trodes were calibrated with standard solutions (pH 6, 7, and 8). The Nernstian property of each electrode was measured by placing the electrode in a series of standard pH solutions (pH 6, 7, and 8). By plotting the voltage output of the probe against log H⫹activity, a linear re-gression yielded a Nernstian slope of 57.8⫾ 2.3 (n ⫽ 10).
Chemicals
When we measued the proton activity at the apical side of the hair cells, the lagenar chamber was open to remove otolith (asteriscus) and was immersed in modified Ringer solution as follows: 115 mmol l–1NaCl, 30 mmol l–1KCl, 0.5 mmol l–1MgCl 2, 0.5 mmol l –1NaH 2PO4, 0.5 mmol l –1 KH2PO4, 1 mmol l –1 CaCl
2, buffered with 1 mmol l –1 NaHCO3. The pH value was adjusted to approximately 8.0. The solution also contained freshly added glucose (1 g l–1) and was aerated before use. The vacuolar H⫹ -ATPase-mediated proton secretion was evaluated via N-ethylmaleimide (NEM; Sigma), which was added to the Ringer solution to make final concentrations of 0.1, 0.01, and 0.001 mM.
Observation of otolith topology and daily
growth increments
To observe the otolith topology, the largest otoliths (as-teriscus) were removed, dried in the oven, and gold coated for SEM observation. To examine the otolith daily growth increments, the otoliths were embedded in Epofix resin, ground, and polished along the transverse plan until the primordium of the otolith was exposed. The polished oto-lith was etched with 0.05 M HCl to reveal the daily growth increments, dried in the oven, and coated with a layer of gold for SEM observation.
RESULTS
Immunocytochemical localization of
Na
ⴙ-K
ⴙ-ATPase
The cells showing the strongest Na⫹-K⫹-ATPase immu-noreactivity (ir) appeared at the periphery of the sensory macula in both the lagena and the saccule (Fig. 1). For convenience, the term ionocytes was used to represent these Na⫹-K⫹-ATPase-ir cells thereafter for the sake of the specific function in ion transportation. Ionocytes have a well-developed tubular system, which is an Na⫹-K⫹ -ATPase-rich organelle (Pisam et al., 1998). Lagenar iono-cytes are relatively large (10 –30m in length) and have varied morphology, whereas saccular ionocytes are usu-ally oval and relatively small (5–10m in length). Lag-enar ionocytes were usually loosely inlaid in an arrange-ment of numerous transitional cells, and few ionocytes were connected to each other. In some individuals, the lagenar ionocytes were abundant and were densely con-nected by their cellular processes or pseudopods (Figs. 1, 2). The zebrafish used were of the same strain, but the size of fish was varied. Therefore, the variability in staining pattern of the ionocytes might be related to individual difference, such as inconsistency of growth and age. The saccular ionocytes usually formed several rows in tight arrangement at the posterior end of the sac. The sensory macula of the otolith organ consists of numerous hair cells, which are characterized by stereocilia at their apical surface. The red bundle demonstrated actin-rich stereo-cilia on each hair cell after being stained with TRITC-conjugated phalloidin. Hair cells also showed strong Na⫹ -K⫹-ATPase-ir in the plasma membrane (Fig. 2f,i).
Immunocytochemical localization of
carbonic anhydrase
The lagenar chamber demonstrated intense immunore-activity for carbonic anhydrase (Fig. 2) in many cell types. These cells included ionocytes, transitional cells, and some squamous cell and granular cells between ionocytes and the sensory macula. Hair cells and supporting cells within the sensory macula also demonstrate intense immunore-activity for carbonic anhydrase (Fig. 2). Immunofluoresent staining in these cells apparently had a cytoplasmic
dis-333 HAIR CELLS RETARD OTOLITH BIOMINERALIZATION
tribution. However, ionocytes show relatively stronger staining of carbonic anhydrase in the plasma membrane than in the cytoplasm. It is worth noting that carbonic anhydrase is aggregated in the cytoplasm close to the apical membrane of hair cell and in some hair bundles
(Fig. 2d,g–i). The staining of carbonic anhydrase is not ubiquitous in all hair bundles, but usually appears in the hair bundles of the hair cells at the edge of the sensory macula (Fig. 2d,g–i). Immunohistochemical staining of carbonic anhydrase usually does not appear in the hair
Fig. 1. Basolateral view of the confocal images (a– c) showing the immunocytochemical staining of Na⫹-K⫹-ATPase (green) in the intact saccular and lagenar chambers, which contain an otolith in each chamber. Saccular ionocytes (SIC) and lagenar ionocytes (LIC) show strong Na⫹-K⫹-ATPase staining and are distributed on the periphery of the sensory macula. The sensory maculae, covered by the hearing nerves (Nv), are not visible in the basolateral view. Arrowheads
indicate the ridge-like thickened ring surrounding the sulcus of the otoilth. The proximal surface of same otolith is clearly illustrated in the SEM image (d) after removal of the otolith chamber. Sensory macula consisted of hair cells and supporting cells facing the rough sulcus, whereas ionocytes face the smooth otolith surface outside the sulcus. A, anterior; D, dorsal; P, posterior; V, ventral. Scale bars⫽ 100 m.
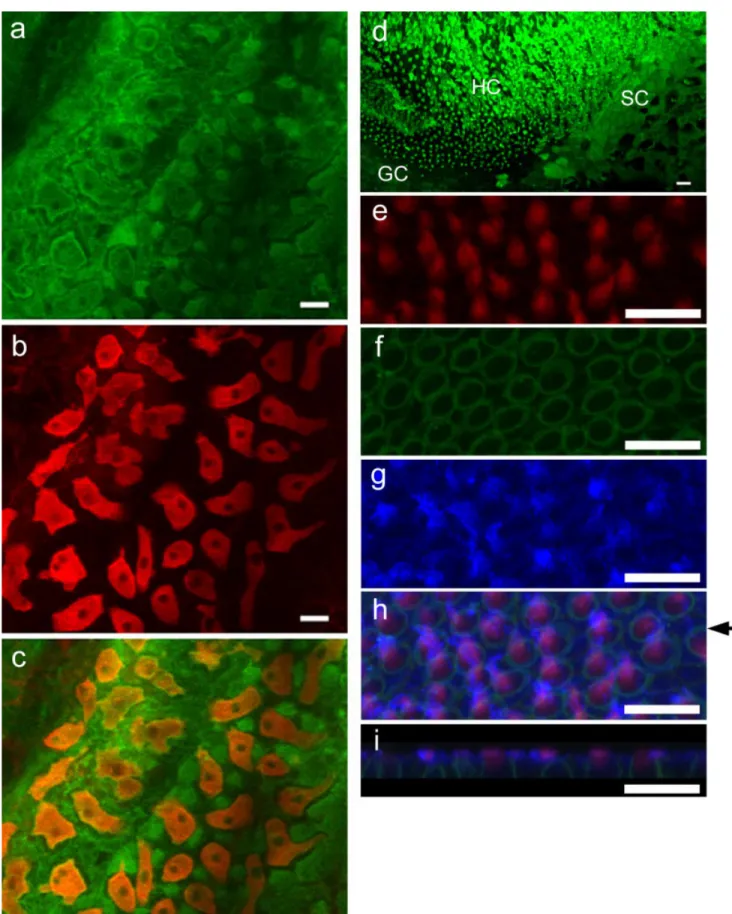
Fig. 2. Carbonic anhydrase (green, a) and Na⫹-K⫹-ATPase (red, b) double staining is shown in the lagenar chamber. Na⫹-K⫹-ATPase and carbonic anhydrase are colocolized in the ionocytes (orange, c), which are surrounded by many transitional cells (green, a,c) that are carbonic anhydrase-immunoreactive but Na⫹-K⫹-ATPase-negative cells. d: Staining of carbonic anhydrase (green) in the cytoplasm of granular cells (GC), squamous cells (SC), hair cells (HC), and hair
bundles. e–i: Staining of carbonic anhydrase (blue, g–i), actin-rich hair bundles (red, e,h,i), and Na⫹-K⫹-ATPase (green, f,h,i) in the hair cells. i: X-Z plane of h as indicated by the arrow shows the distribution of carbonic anhydrase close to the apical membrane (blue) and in the hair bundle (pink). Na⫹-K⫹-ATPase (green, f,h,i) is distributed in the plasma membrane of hair cells. Scale bars⫽ 10 m.
bundle of the hair cells distributed at the inner area of the sensory macula. This may indicate a heterogeneity and developmental difference among hair cells, as was found by Bang et al. (2001).
Immunocytochemical localization of
H
ⴙ-ATPase
The H⫹-ATPase-ir cells were found only in the apical side of the labyrinth within the sensory macula (Fig. 3a). Actin-rich hair bundles bound by phalloidin always ap-peared in these H⫹-ATPase-ir cells. This indicated that H⫹-ATPase was located in the hair cells (Fig. 3b), not in the supporting cells. The hair cells showed the strongest staining of H⫹-ATPase in the apical membrane surround-ing the hair bundle (Fig. 3b,c). There was no H⫹-ATPase immunoreactivity found in other cell types, suggesting that H⫹-ATPase was specifically expressed in the hair cells. The hair cells showed differential H⫹-ATPase immunostain-ing, with the strongest staining at the distinctive patch near the anterior sensory macula and at the edge of the sensory macula. The weakest staining of H⫹-ATPase appeared at the central area of the sensory macula (Fig. 3a). H⫹-ATPase was
expressed in the hair cells of zebrafish larva at least as early as 3 day postfertilization (Fig. 3d).
Control experiments
Negative control of the whole-mount sample obtained by omitting the primary antibody from the staining protocol demonstrated absence of staining on the labyrinth epithe-lium (data not shown). This indicated that the secondary antibodies used exhibited minimal cross-reactivity with the labyrinth tissues of zebrafish.
Immunoblotting
Labyrinth homogenate was subjected to immunoblotting to identify the presence of Na⫹-K⫹-ATPase, carbonic anhy-drase, and H⫹-ATPase in the saccular epithelial cells. The immunoblot of Na⫹-K⫹-ATPase, carbonic anhydrase, and H⫹-ATPase showed clear bands at molecular masses of ap-proximately 110, 30, and 75 kDa, respectively (Fig. 4).
Proton activities (pH) at hair cells
To evaluate proton secretion from the hair cell, we use H⫹-selective microelectrodes to measure H⫹activity (pH)
Fig. 3. Immunocytochemical staining of Na⫹-K⫹-ATPase and H⫹ -ATPase in the lagenar chamber. a: Prominent staining of H⫹-ATPase (green) in the sensory macula, surrounded by several rows of iono-cytes, which show intense staining of Na⫹-K⫹-ATPase (red). b: H⫹ -ATPase (green) is densely distributed in the apical membrane of hair cells and surrounds the hair bundle, which is stained by phalloidin
conjugated with TRITC (red). c: X-Z plane of b as indicated by the arrow. Red indicates the hair bundle, and green indicates the H⫹ -ATPase. d: Staining of H⫹-ATPase (green) in the hair cells, which are
characterized by the hair bundle stained by phalloidin-conjugated with TRITC (red) in zebrafish larva at 3 days postfertilization. Scale bars⫽ 100 m in a; 10 m in b–d.
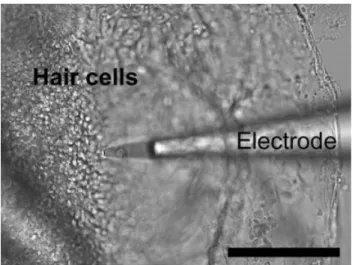
at the surface of hair cells. The extracted lagena was immersed in Ringer solution, and otolith was removed to expose the hair cells. The hair cells were easily identified from their unique morphology and distribution at a mag-nification of⫻400 under a DIC microscope (Fig. 5). H⫹ activity was immediately measured by the H⫹-selective microelectrode technique. When the electrode moved very close to the hair cells (about 2– 4m above hair cells), the measured pH value dropped from approximately 8 in the background (more than 500m away from the sample) to approximately 7.6 near the hair cell (Fig. 6). The strongest proton activity was detected near the apical membrane of hair cells, and proton activity gradually decreased when the electrode was moved away from the hair cells. The
inhibitory effect of proton secretion was evaluated by us-ing different concentrations of NEM. After addition of the H⫹-ATPase inhibitor NEM at 0.1 and 0.01 mM to the hair cells, the pH value quickly increased to more than 7.9 and approximately 7.7, respectively (Fig. 6). However, 0.001 mM NEM or Ringer solution alone has no influence on pH value. Vacuolar H⫹-ATPase is sensitive to low concentra-tions of NEM. The complete inhibition of proton secretion from hair cells by applying 0.1 mM NEM and partial inhibition by 0.01 mM NEM indicates that the proton gradient generated by the hair cells is mediated by the vacuolar H⫹-ATPase. In addition, the dose-dependent in-hibitory effect of different concentrations of NEM suggests that the inhibition of H⫹-ATPase by NEM is not a phar-macological effect.
Otolith morphology
The otolith (asteriscus) of zebrafish is an ovate structure with regular wave-like curves on the margin. The sulcus in the proximal surface forms an oval groove opening to the anterior margin (Fig. 7a). The convex distal surface of the otolith has no distinctive features (Fig. 7b). The grooved sulcus is very similar in shape to the pattern of hair cell distribution in the sensory macula (Fig. 3a). Fur-thermore, the sulcus surface is smooth at the central area and becomes rough at the edge. High magnification shows many cracks within the small granular CaCO3structure at the edge of the sulcus. Many granular structures are connected and fused to form larger ones toward the center of the sulcus (Fig. 7c), and a ridge-like thickened ring surrounds the sulcus, indicating rapid CaCO3deposition. Outside the sulcus, the otolith surface is very smooth, and no cracks or granular structure are observed. This area outside the sulcus of the otolith faces the otolith chamber where ionocytes are distributed. The daily growth incre-ments were faster dorsoventrally than distally-proximally and were merged in the proximal surface of the otolith from first ring formation (Fig. 7d). This indicates that CaCO3deposition is inhibited in the proximal surface of the otolith beginning at the early stage of the fish.
Fig. 4. Immunoblotting of Na⫹-K⫹-ATPase (a), carbonic anhy-drase (b), and H⫹-ATPase (c) extracted from the labyrinths of ze-brafish (lane 1) and rat kidney as positive control (lane 2). The anti-body against Na⫹-K⫹-ATPase, carbonic anhydrase, and H⫹-ATPase
recognized a clear band at molecular masses of approximately 110, 30, and 75 kDa, respectively. Positions of the molecular markers (kDa) are indicated at left.
Fig. 5. Measurement of proton activity at the apical side of hair cells by the H⫹-selective microelectrode technique. Scale bar⫽ 100
m.
Fig. 6. H⫹activity (pH) at the apical side of hair cells. During the experiment, the electrode was moved from a background region (more than 500m away from the tissue) to the apical side of hair cells (about 2– 4m above hair cells). The measured pH value dropped from approximately 8 in the background to approximately 7.6 near t h e h a i r c e l l . T h e a r r o w s i n d i c a t e d t h e t i m e a t w h i c h N-ethylmaleimide (NEM) was added. NEM at 0.1 and 0.01 mM can disrupt the H⫹gradient, but 0.001 mM NEM or Ringer solution alone (data not shown) has no influence on proton secretion.
337 HAIR CELLS RETARD OTOLITH BIOMINERALIZATION
DISCUSSION
Specificity of the primary antibodies
The protein molecular weights evaluated by Western blot confirmed the specificity of the antibodies to Na⫹-K⫹ -ATPase, carbonic anhydrase, and H⫹-ATPase in the lab-yrinth of zebrafish. The molecular weights of Na⫹-K⫹ -ATPase, carbonic anhydrase, and H⫹-ATPase were approximately 110, 30, and 75 kDa, respectively. The mo-lecular weight of each protein is consistent with data from other species (Sender et al., 1999; Katoh et al., 2003). The molecular sizes of approximately 110, 30, and 75 kDa also agree with the expected size of the zebrafish Na⫹-K⫹ -ATPase␣-subunit (Rajarao et al., 2001), carbonic anhy-drase II (Peterson et al., 1997), and H⫹-ATPase␣-subunit (Gene Bank accession No. BC055130). Accordingly, the Western blot supports the reliability of the immunoreac-tivity of carbonic anhydrase, Na⫹-K⫹-ATPase, and H⫹ -ATPase to each primary antibody.
Function of ionocytes
The staining of Na⫹-K⫹-ATPase, H⫹-ATPase, and car-bonic anhydrase in ionocytes and hair cells suggests their participation in endolymphatic pH regulation and ion transportation. Na⫹-K⫹-ATPase ␣- and -subunit genes were abundantly and differentially expressed throughout the otic epithelium in the early developmental stage (1–5 dpf) of zebrafish (Blasiole et al., 2003). This indicates that different Na⫹-K⫹-ATPase subunits are involved in the formation of inner ear at the early developmental stage as well as the ion regulation of endolymph at the later stages. The cellular and molecular mechanisms of zebrafish inner ear development were described in detail by Haddon and Lewis (1996) and Whitfield et al. (2002). However, the expression patterns of carbonic anhydrase and H⫹ -ATPase genes in fish inner ear are still unclear. Carbonic anhydrase in the ionocytes hydrolyzes CO2and generates HCO3–and H⫹. HCO3–is presumably secreted into the endolymph by a Cl–/HCO
3–exchanger and combines with Ca2⫹to form CaCO3aragonite crystals. Na⫹-K⫹-ATPase on the basolateral membrane creates a sodium gradient that drives the Na⫹/H⫹exchanger to pump H⫹out of the cell (Payan et al., 1997; Tohse and Mugiya, 2001). The formation of a ring of ionocytes around the sensory macula is consistent with the observations of Mayer-Gostan et al. (1997). Their distribution coincidentally faces the proxi-mal convex surface of the otolith. This is the area where CaCO3 biomineralizes rapidly. This collective evidence indicates that ionocytes are the cells responsible for the transepithial transport of HCO3–and subsequent otolith growth. The transitional cells are also densely inter-spersed among the ionocytes. This arrangement differs from that in mammals, whose transitional cells occur be-tween the sensory epithelium and the dark-cell area
func-tionally equivalent to teleostean ionocytes (Hunter-Duvar and Hinojosa 1984). However, the prominent staining of carbonic anhydrase in the transitional cells is consistent with that in the mammalian inner ear (Hsu, 1991). Davis et al. (1995) and Takagi (2000) have pointed out that transitional cells are responsible for the production of otolith protein matrix. The close association of transi-tional cells and ionocytes results in the secretion of or-ganic protein matrix and inoror-ganic ions (HCO3
–) in the same area and produces rapid CaCO3biomineralization outside the sulcus. Both ionocytes and transitional cells are found only in the proximal side of the otolith chamber. The distal side of the otolith is surrounded only by the squamous cells and has the slowest growth (Fig. 7d). Squamous cells are unlikely to provide calcium, bicarbonic ions, or organic matrix, insofar as ion transportation and protein secretion are not found in these cells. The only supply of calcium, bicarbonic ions, and organic matrix is probably from diffusion from the proximal side to the distal side. The diffusion is a passive and slow process that may account this slow growth in the distal side of the otolith.
Function of H
ⴙ-ATPase in hair cells
Payan et al. (1999) observed low pH values of the en-dolymph around the sensory macula and hypothesized that the concentrated H⫹around the sensory macula had diffused from its production site, where CaCO3was depos-ited quickly. This is very hypothetical, in that ionic diffu-sion typically occurs from high to low concentration. Proton-secreting H⫹-ATPase is widely found in various tissues, e.g., kidney, gill, skin, and osteoclasts (Brown and Breton, 1996). H⫹-ATPase in the osteoclasts is involved in bone remodelling by acidifying the osteoclasts-bony inter-face (Blair et al., 1989; Vaananen et al., 1990). The proton secretion by the hair cells causes pH values of the en-dolymph to decrease by approximately 0.4 units within the sensory macula (Fig. 6). The neutralized microenvi-ronment facing the sensory macula does not favor CaCO3 formation and thus causes slow otolith growth in the sul-cus. There are numerous cracks and granular CaCO3 structures on the sulcus that coincidently face the hair cells, which has the strongest H⫹-ATPase immunostain-ing (Figs. 3, 7). There was relatively less stainimmunostain-ing of the hair cells facing the smooth central surface of the sulcus. These results indicate that H⫹-ATPase in the apical mem-brane of hair cells functions to secrete H⫹into endolymph and to retard CaCO3 biomineralization or even dissolve the partial CaCO3 within the sensory macula. Carbonic anhydrase, which shows prominent staining in the cyto-plasm close to the apical membrane of hair cells and in the hair bundle, can provide the H⫹source by catalyzing H2O and CO2(Fig. 2). The apical proton secretion results in the generation of HCO3
–inside the hair cell, which can exit from the basolateral membrane through a Cl–/HCO
3 – ex-changer. Chloride then exits via a basolateral chloride channel as described for the “A-type” intercalated cell of the kidney collecting tubule (Gluck and Nelson, 1992). Figure 8 depicts the relative position between otolith and different epithelial cells. The ion transporters that may be involved in the pH regulation of the endolymph are also illustrated in the hair cell and the ionocyte (Fig. 8b).
The teleostean hair cell is virtually the same as that found in the inner ears of other vertebrates (Chang et al., 1992). Stankovic et al. (1997) also demonstrated the apical
Fig. 7. Topology and microstructure of the zebrafish asteriscus. SEM photos showing the rough and granular structure in the otolith sulcus (a) and the smooth surface in other areas of the otolith (b,c). Higher magnification of the boxed area in a is shown in c. d: Ground and etched otolith, demonstrating rapid daily growth along the dorsal-ventral axis and retarded growth along the distal-proximal axis. Arrows indicate the merge of the daily growth increments in the proximal surface. A, anterior; D, dorsal; Dis, distal; P, posterior; Pro, proximal; S, sulcus; V, ventral. Scale bars⫽ 50 m.
339 HAIR CELLS RETARD OTOLITH BIOMINERALIZATION
distribution of H⫹-ATPase in strial marginal cells in mammalian cochlea. Hair cells of the utricle, the saccule, and the cristae ampullaris also expressed H⫹-ATPase and the Cl–/HCO
3– exchanger. Stankovic et al. (1997) sug-gested that these cells were involved in the regulation of endolymphic pH within normal values. The hair bundles of mammalian hair cells are embedded and protected by the otoconial membrane. However, the hair bundles of teleostean hair cells are exposed in the endolymph and are in direct contact with a fast-growing otolith. A protective device must be adopted to maintain a proper working distance between the fish otolith and the hair cells. Oth-erwise, the quickly accreting otolith would crush the hair cells and eventually cause dysfunction of the receptor organs. The proton-secreting H⫹-ATPase on the apical surface of hair cells evidently neutralizes or acidifies the microenvironment and retards or dissolves CaCO3 depo-sition. Hair cells are developed in the 24 hpf embryo stage, before otolith formation (Whitfield et al. 2002). We ob-served that H⫹-ATPase is expressed in the hair cell of zebrafish at 3 day postfertilization. Furthermore, otolith formation is also inhibited on the proximal surface start-ing from the formation of the first daily growth increment. All the evidence indicates that H⫹-ATPase plays an im-portant role in protecting hair cells starting from the early developing stage.
Hair cells and ionocytes control otolith
morphology
From immunoblotting, immunocytochemical staining, electrophysiological evidence, and observation of otolith topology and microstructure, the hair cells in teleostean otolith organs were determined to have a vacuolar H⫹ -ATPase in their apical membrane. The close association between mechanosensory hair cells and the accreting
oto-lith can be maintained by the proton-secreting H⫹ -ATPase, which neutralizes or acidifies the microenviron-ment to dissolve CaCO3or retard otolith growth on the surface facing the sensory macula. The ionocytes sur-rounding the sensory macula secrete quantities of HCO3
– to sustain otolith growth. The unique distribution of iono-cytes also acts as a barrier to maintain the alkaline en-dolymph outside the sensory macula. The enen-dolymphic microenvironment within the sensory macula does not favor otolith growth whereas ionocytes promote otolith growth outside the sulcus, resulting in a sculptured groove along the proximal medial face of all otoliths.
ACKNOWLEDGMENTS
We extend our full gratitude to S.C. Chen and T.L. Lin for assistance with the experiment and to B. Jessop for suggestions on the article.
LITERATURE CITED
Bang PI, Sewell WF, Malicki JJ. 2001. Morphology and cell type hetero-geneities of the inner ear epithelia in adult and juvenile zebrafish (Danio rerio). J Comp Neurol 438:173–190.
Blair HC, Teitelbaum SL, Ghiselli R, Gluck S. 1989. Osteoclastic bone resorption by a polarized vacuolar proton pump. Science 245:855– 857. Blasiole B, Degrave A, Canfield V, Boehmler W, Thisse C, Thisse B, Mohideen MPK, Levenson R. 2003. Differential expression of Na, K-ATPase-␣ and - subunit genes in the developing zebrafish inner ear. Dev Dyn 228:386 –392.
Brown D, Breton S. 1996. Mitochondria-rich, proton-secreting epithelial cells. J Exp Biol 199:2345–2358.
Campana SE, Neilson JD. 1985. Microstructure of fish otoliths. Can J Fish Aquat Sci 42:1014 –1032.
Chang JSY, Popper AN, Saidel WM. 1992. Heterogeneity of sensory hair cells in a fish ear. J Comp Neurol 324:621– 640.
Davis JG, Oberholtzer JC, Burns FR, Greene MI. 1995. Molecular cloning and characterization of an inner ear-specific structural protein. Science 267:1031–1034.
Dunkelberger DA, Dean JM, Watabe N. 1980. The ultrastructure of the otolithic membrane and otolith in the juvenile mummichog, Fundulus
heteroclitus. J Morphol 163:367–377.
Gluck S, Nelson R. 1992. The role of the V-ATPase in renal epithelial H⫹ transport. J Exp Biol 172:205–218.
Haddon C, Lewis J. 1996. Early ear development in the embryo of the zebrafish, Danio rerio. J Comp Neurol 365:113–128.
Hsu CJ. 1991. Ultrastructural study of cytochemical localization of car-bonic anhydrase in the inner ear. Acta Otolaryngol 111:75– 84. Hudspeth AJ. 1989. How the ear’s works work. Nature 341:397– 404. Hunter-Duvar IM, Hinojosa R. 1984. Vestibule: sensory epithelia. In:
Friedmann I, Ballantyne J, editors. Ultrastructural atlas of the inner ear. London: Butterworths. p 211–244.
Katoh F, Hyodo S, Kaneko T. 2003. Vacuolar-type proton pump in the basolateral plasma membrane energizes ion uptake in branchial mitochondria-rich cells of killifish Fundulus heteroclitus, adapted to a low ion environment. J Exp Biol 206:793– 803.
Lim DJ. 1984. The development and structure of the otoconia. In: Fried-mann I, Ballantyne J, editors. Ultrastructural atlas of the inner ear. London: Butterworths. p 245–269.
Mayer-Gostan N, Kossmann H, Watrin A, Payan P, Boeuf G. 1997. Distri-bution of ionocytes in the saccular epithelium of the inner ear of two teleosts Oncorhynchus mykiss and Scophthalmus maximus. Cell Tissue Res 289:53– 61.
Pannella G. 1971. Fish otoliths: daily growth layers and periodical pat-terns. Science 173:1124 –1127.
Payan P, Kossmann H, Watrin A, Mayer-Gostan N, Boeuf G. 1997. Ionic composition of endolymph in teleosts: origin and importance of en-dolymph alkalinity. J Exp Biol 200:1905–1912.
Payan P, Edeyer A, De Pontual H, Borelli G, Boeuf G, Mayer-Gostan N. 1999. Chemical composition of saccular endolymph and otolith in fish
Fig. 8. a: Schematic diagram of different epithelial cell types in the lagenar chamber of zebrafish and their positions relative to the otolith. b: Hypothetical model demonstrates the ion transporters and channels, which may participate in regulating endolymphic pH value. CA, carbonic anhydrase; GC, granular cell; HC, hair cell; LIC, lagenar ionocytes; NE, nerve ending; SC, supporting cell; SQC, squamous cell; TC, transitional cell. These diagrams are not drawn to scale.
inner ear: lack of spatial uniformity. Am J Physiol Regul Integr Comp Physiol 46:123–131.
Peterson RE, Tu CK, Linser PJ. 1997. Isolation and characterization of a carbonic anhydrase homologue from the zebrafish (Danio rerio). J Mol Evol 44:432– 439.
Pisam M, Payan P, LeMoal C, Edeyer A, Boeuf G, Mayer-Gostan N. 1998. Ultrastructural study of the saccular epithelium of the inner ear of two teleosts, Oncorhynchus mykiss and Psetta maxima. Cell Tissue Res 294:261–270.
Rajarao SJR, Canfield VA, Mohideen MPK, Yan YL, Postlethwait JH, Cheng KC Levenson R. 2001. The repertoire of Na, K-ATPase␣ and  subunit genes expressed in the zebrafish, Danio rerio. Genome Res 11:1211–1220.
Schellart NAM, Wubbels RJ. 1998. The auditory and mechanosensory lateral line system. In: Evans DH, editor. The physiology of fishes. New York: Academic Press. p 283–312.
Sender S, Bottcher K, Cetin Y, Gross G. 1999. Carbonic anhydrase in the gills of seawater- and freshwater-acclimated flounders Platicchthys
flesus: purification, characterization, and immunohistochemical
local-ization. J Histochem Cytochem 47:43–50.
Stankovic KM, Brown D, Alper SL, Adams JC. 1997. Localization of pH regulating proteins H⫹-ATPase and Cl–/HCO
3– exchanger in the guinea pig inner ear. Hear Res 114:21–34.
Takagi Y. 2000. Ultrastructural immunolocalization of the otolith water-soluble-matrix in the inner ear of rainbow trout just-hatched fry. Fish Sci 66:71–77.
Tohse H, Mugiya Y. 2001. Effects of enzyme and anion transport inhibitors on in vitro incorporation of inorganic carbon and calcium into en-dolymph and otoliths in salmon Oncorhynchus masou. Comp Biochem Physiol 128A:177–184.
Vaananen HK, Karhukorpi EK, Sundquist K, Wallmark B, Roininen I, Hentunen T Tuukkanen J, Lakkakorpi P. 1990. Evidence for the pres-ence of a proton pump of the vacuolar H⫹-ATPase type in the ruffled borders of osteoclasts. J Cell Biol 111:1305–1311.
Whitfield TT, Riley BB, Chiang MY, Phillips B. 2002. Development of the zebrafish inner ear. Dev Dyn 223:427– 458.
341 HAIR CELLS RETARD OTOLITH BIOMINERALIZATION