Diabetologia (1992) 35:973-979
Diabetologia
9 Springer-Verlag 1992Trends in mortality from diabetes mellitus in Taiwan, 1960-1988
R. S. Lin and W. C. LeeInstitute of Public Health, College of Medicine, National Taiwan University, Taipei, Taiwan
Summary. The increasing trends of mortality from diabetes
mellitus in Taiwan are becoming a public health concern. The age-adjusted death rate for diabetes was 3.7 per 100,000 population in 1960, which increased to 23.2 per 100,000 in 1988, a 6.3-fold increase over the past 30 years. The mortality data for diabetes in Taiwan from 1960 to 1988 for both sexes are presented and analysed using an age-period-cohort model in order to gain a better understanding of the possible determinants of the time trends of this disease. Steeply in- creasing trends which are particularly prominent in the elder-
ly are found in the periods studied. Females and urban dwel- lers demonstrated greater risks for developing the disease. Significant cohort effects were found which peaked in the birth:cohort 1910-1917. This declined thereafter for females but ha s levelled since then for males. Further study is neces- sary to assess the aetiological implications of diet and urbani- zation on time trends of diabetes.
Key words: Diabetes mellitus, mortality trends, age-period-
cohort analysis, urbanization.
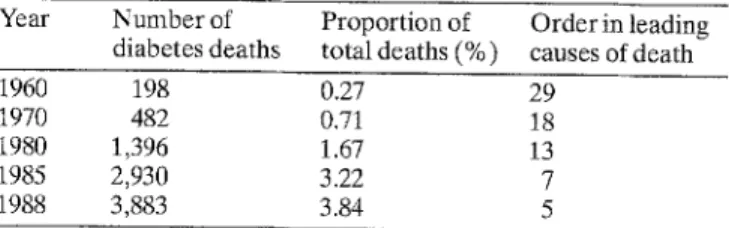
O v e r the past 30 years, Taiwan has experienced a rapid socioeconomic d e v e l o p m e n t that is reflected in changes of m a n y aspects of life-style and dietary habits and to a large extent also in disease patterns. Chronic diseases, e. g. cerebral and cardiovascular diseases and diabetes melli- tus have e m e r g e d as m a j o r diseases threatening the lives of the inhabitants on this island. While the leading cause of death was previously cerebrovascular disease, cancer has b e e n responsible for most deaths since 1982. H o w - ever, the m o s t r e m a r k a N e increase in chronic disease mortality in the past 30 years has b e e n due to diabetes. In 1960, diabetes was responsible for less than 0.3 To of total deaths, while this figure increased r e m a r k a b l y to 3.8 %, accounting for m o r e than 3,800 deaths in 1988, D i a b e t e s is now the fifth leading cause of death in Taiwan next to cancer, cerebrovascular disease, accident and c o r o n a r y heart disease (Table 1).
In addition to being a significant cause of mortality, dia- betes is believed to be a m a j o r cause of disability in the el- derly including blindness, renal failure, and lower limb amputations. Cardiovascular and peripheral vascular con- ditions a p p e a r to be a b o u t two times as c o m m o n in diabe- tic patients as in non-diabetic subjects [1]. D i a b e t e s clearly represents an i m p o r t a n t public health p r o b l e m in Taiwan as well as in other d e v e l o p e d countries. A l t h o u g h it is well-known that genetic factors are involved in the aetio- logy of diabetes, the t r e m e n d o u s increase in diabetic m o r -
tality in Taiwan over the past 20 years denotes the fact that e n v i r o n m e n t a l factors play an i m p o r t a n t role in the causa- tion of Type 2 (non-insulin-dependent) diabetes. In this study, mortality data f r o m diabetes in Taiwan were analy- sed and presented in order to better understand the way dietary as well as urbanizational factors affect the secular trends.
Subjects and methods
Subjects
Information on diabetes mortality and the data of mid-year popula- tion in Taiwan from 1960 to 1970 were taken from the "Vital statis- tics" published annually by the Taiwan Provincial Department of
Table 1. Number of deaths from diabetes mellitus in Taiwan, 1960-
1988, by year
Year Number of Proportion of Orderinleading diabetesdeaths total deaths(%) causes ofdeath
1960 198 0.27 29
1970 482 0.71 18
1980 1,396 1.67 13
1985 2,930 3.22 7
o o o o o S E & < 30 20 10 / . / ... ... ... / i . . . . i , , J , i , i , , I I , , , I i i i i I i i , 1960 1965 1970 1975 1980 1985 Y e a r
Fig.1. Trends of diabetes mellitus mortality in Taiwan, 1960-1988, by sex. M a l e - - , Female . . .
Health, R. O. C. [2] where they were tabulated by sex and 5-year age group. The individual health records of all reported cases as well as population data for each township and district in Taiwan be- tween 1971 and 1988 were generated directly from computerized government data sets. The contributing causes of death were not available in either the annual report or the computer file. Thus, mortality from diabetes, in this study, was defined as code number 250 in both International Classification of Diseases (ICD)-8 and (ICD)-9 listed in the death certificates as the underlying cause of death.
The degree of urbanization of each township and district in Taiwan was given an index of 1 to 8 in the study of urban-rural classification by Tzeng and Wu [3], in which variables of popula- tion density, age composition, mobility, economic activity and family income, educational level, and health and sanitation facili- ties were used to estimate the urbanization score. Metropolitan areas, in this study, are defined as those with index 1-2, and cities, index 3-4, towns, index 5~6, and rural areas, index 7-8, respecti- vely.
Data of annual per capita income and of calorie, protein, and fat consumption in Taiwan between 1960 and 1988 were taken from "Taiwan Statistical Data Book" published by the Council for Eco- nomic Planning and Development, R. O. C. [4].
Statistical analysis
In order to minimize the effect of different age compositions for dif- ferent periods and different areas, the secular trends of diabetes mortality rates for the whole population between 1960 and 1988 and the trends of diabetes mortality rates by urbanization in Taiwan were age-adjusted [5] to the 1976 world standard population [6].
The statistical age-period-cohort analysis ( A P C Model), which adopted the "individual record" method of Robertson and Boyle [7] to circumvent the problem of non-identifiability, was performed using the data between 1971 and 1988.
The mortality of diabetes mellitus in a particular group (age-peri- od-cohort) is assumed to follow a Poisson distribution, with a mean g = N- r, where N is person-years at risk in a particular group, and r is the mortality rate from diabetes in that group. The mortality rate r is modelled as a log-linear function of age, period and cohort separate- ly for males and females. The baseline groups are ages 40-44, calen- dar year 1971-1973, and birth year 1887-1893 for age, period, and cohort factors, respectively. The maximum likelihood estimation was used to fit the models through the statistical package Egret [8]. The significance of the factors (age, period, and cohort), were assessed by means of a likelihood ratio test. Other methodological details can be found elsewhere [9].
R e s u l t s
Figure i shows the trends for age-adjusted mortality rates of diabetes for males and females in Taiwan between 1960 and 1988. The increasing trends in mortality rates from diabetes are large. For males, the annual age-adjusted mortality rate increased from 3.32 per 100,000 population in 1960 to 17.84 per 100,000 population in 1988, a 5.4-fold increase, and for females, 4.05 per 100,000 population in 1960 to 30.01 per 100,000 in 1988, a 7.4-fold increase. The secular trends in Figure i also show that the increases in
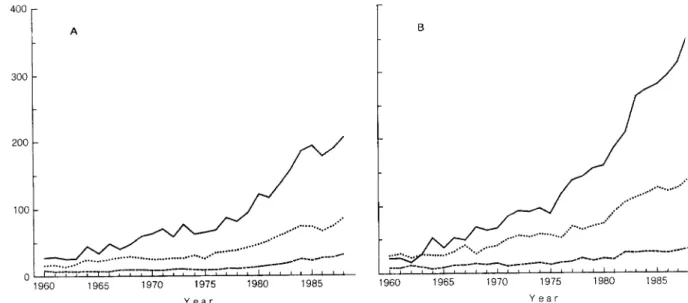
o o 3 L ?. 4 0 0 3 0 0 200 1 0 0 0 1960 I - - - - ~ - - - T - I ; - - T - - T - - T " - T - ' T " I ' T ' ~ - - T , , , i , , i , I , I I I I I I I 1 9 6 5 1 9 7 0 1 9 7 5 1 9 8 0 1 9 8 5 Y e a r B 1 9 6 0 1 9 6 5 1 9 7 0 1 9 7 5 1 9 8 0 1 9 8 5 Y e a r
Fig. 2 A, B. Secular trends of age-specific mortality from diabetes mellitus in Taiwan, 1960-1988, by sex. A Male 70 + - - , 60~59 . . . ,50-59 - - -. B Female 70 + - - , 60-69 . . . ,50-59 - - -.
R. S. Lin and W. C. Lee: Diabetes mellitus mortality in Taiwan 0 o o 0 o 1 0 0 0 - A 100 10 1 / . . . 1 J I I I [ I I I I 25-29 30-34 35-39 40-44 45-49 50-54 55-59 60-64 65-69 70-74 75-79 80-84 85+ A g e (years) 975
J~ s sss~sssslsls/ssss
s/" i
~'~
, .4"'." , , , 25-29 30-34 35-39 40-44 45-49 50-54 55-59 60-64 65-69 70-74 75-79 80-84 85+ A g e (years) F i g . 3 A , B . A g e - s p e c i f i c m o r t a l i t y r a t e f r o m d i a b e t e s m e l l i t u s i n T a i w a n , f o r t h e p e r i o d s o f 1 9 7 1 - i 9 7 6 , 1 9 7 7 - 1 9 8 2 a n d 1983 1988, b y sex. A M a l e 1 9 8 3 - 1 9 8 8 - - -, 1 9 7 7 - 1 9 8 2 - - , 1 9 7 1 - 1 9 7 6 . . . . B F e - m a l e 1 9 8 3 - 1 9 8 8 - - -, 1 9 7 7 - 1 9 8 2 - - , 1 9 7 1 - 1 9 7 6 . . . . M o r t a l i t y r a t e is e x p r e s s e d o n a l o g a r i t h m i c s c a l emortality from diabetes were particulary remarkable in the last 10 years for both sexes.
Further analysis of the age-specific mortality rates of three different age groups were plotted in Figure 2 for males and females. It can be seen that the oldest age group of 70 and over in both sexes showed the most dra- matic secular trends, especially females (15.8-fold in- crease).
Depicted in Figure 3 are the cross-sectional age distri- butions of mortality from diabetes for three consecutive periods of 1971-1976, 1977-1982 and 1983-1988 for both sexes. It can be seen that the mortality rates increased pro- gressively with age for males but showed a downward cur- vature after age 75 years for females.
The separate effects due to age, cohort and period in- dices, respectively (Fig. 4-6) were estimated from the A P C model [7] and were all statistically significant (p < 0.01) as judged by the likelihood ratio test (Table 2 ) The oldest age group, (80-84 years) had 46.8 and 60.1
times the risk of dying from diabetes as compared to the youngest age group of 40-44 years for males and females, respectively. The downward curvature after ages 75 years for females observed in the cross-sectional age distribu- tions (Fig. 3) disappeared in this birth-cohort analysis (Fig. 4). As regards cohort effects, females born between 1910-1917 achieved the highest risk among the birth cohorts studied (the relative risk is 2.04 as compared to the 1887-1893 birth cohort) and the effect declined in the recent cohorts. For males, the birth-cohort effect was less conspicuous. It was increasing before the year 1909, reached a peak in 1910-1917 and remained at about the same level of risk thereafter (1.5 times the risk as com- pared to the 1887-1893 birth cohort). We also analy- sed the cohort effects using finer grouping in the age, period, cohort indices and the results were essentially the same.
The age-adjusted diabetes mortality rates by the de- gree of urbanization between 1971-1988 for males and re-
80 7O
4o5~
i'"'"'""
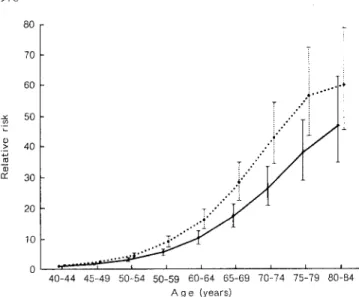
9 ~ ..'" 3 0 2 0 T.'" 10 .,'" 0 ,L , , , 4 0 - 4 4 45-49 50-54 50-59 60-64 65-69 70-74 75-79 80-84 A g e (years)Fig.4. Age effect (with 95 % confidence interval) in diabetes melli- tus mortality in Taiwan, 1971-1988, by sex. Male . - - . , Female 9 . . . o, re
T
T
0 , I I i I I | I I 1887 1894 1902 1910 1 9 1 8 1926 1 9 3 4 1942 i 1 I / I I I I 1893 1901 1909 1917 1925 1933 1941 1 9 4 8 Y e a rFig. 5. Cohort effect (with 95 % confidence interval) in diabetes mel- litus mortality among birth cohorts of 1887-1948 in Taiwan, by sex. M 1 a e 9 F ema 9 le ... . 9 T .~..' . . , r . . . 0 I I I I I I 1 9 7 1 - 7 3 7 4 - 7 6 7 7 - 7 9 8 0 - 8 2 8 3 - 8 5 8 6 - 8 8 Y e a r
Fig. 6. Period effect (with 95 % confidence interval) in diabetes mel- litus mortality in Taiwan, 1971-1988, by sex. Male . - - . , Female
that residents in rural areas will reach diabetes mortality rates as high as the m e t r o p o l i t a n figures in a b o u t 6 years.
Figure 8 shows the trends of annual p e r capita income and of calorie, protein, and fat consumption in Taiwan be- tween 1960 and 1988. The increasing trends of fat con- sumption and calorie intake s e e m very similar to the trends of diabetes mortality (Pearson correlation coeffi- cients, 0.97 and 0.82, respectively).
Discussion
In the absence of comprehensive incidence and prevalen- ce data a b o u t diabetes, studies b a s e d u p o n vital statistics compiled f r o m death certificates seemed a reasonable first step in estimating trends of diabetic risk. However, several studies h a v e d e m o n s t r a t e d that diabetes was re- ported as the underlying cause in only about 7 % and as a contributing or " o t h e r " cause in about one-third of all death certificates [10-12]. U n d e r e s t i m a t i o n of mortality rates f r o m diabetes was, therefore, inevitable, if vital sta- tistic data were used. It should be k e p t in mind that even in complete ascertainment f r o m d e a t h certificates, f r o m b o t h underlying and contributing causes, using mortality data to study trends in diabetes had the drawback of sepa- rating the effects of i m p r o v e m e n t in medical care accessi- bility and the reduction in case fatality rate due to b e t t e r t r e a t m e n t from true incidence change. Thus, studies ba- sed u p o n vital statistics give only an imprecise picture of trends in diabetes.
T h e dramatic increase in mortality f r o m diabetes in Taiwan b e t w e e n 1960 and 1988 as revealed in our study, did, however, provide some clues about the risk factors for the disease. It was unlikely that i m p r o v e d case ascer- tainment or b e t t e r diagnosis f r o m the i m p r o v e m e n t in medical care facilities account for all of the increases, W h e n these trends did occur, they often started at a y o u n g e r age, and shifted to the elderly. However, our ob- servations show that the mortality rates in the young are stable, while those in the elderly increase dramatically. T h e results of the prevalence survey of diabetes conduct- ed in Taipei City (the largest city in Taiwan) which also
Table 2. Variable selection in age-period-cohort models of diabetes
mellitus mortality in Taiwan, 1971-1988
Model df Deviance Likelihood
ratio statistic (dr) ~
Male
Age 85 1713.7 14764.6 (8) u
Age, period 80 104.9 1608.8 ( 5 ) b Age, period, cohort 73 84.6 20.3 (7) b
Female
Age 85 2401.9 25047.8 (8) b
Age, period 80 238.7 2163.0 (5) b
Age, period, cohort 73 114.7 123.9 (7) u males are presented in Figure 7. Generally, m e t r o p o l i t a n
residents had a 1.5-fold higher diabetes mortality rate than those in rural areas. T h e comparisons of time trends for diabetes mortality rates by urbanization also revealed
a Each likelihood ratio statistic refers to the last term entered into the model and has an approximate chi-square distribution with the ap- propriate degree of freedom (dr).
R. S. Lin and W. C. Lee: Diabetes mellitus mortality in Taiwan 25 A oo 2o o s 15 ." ... >" ~ / 9 s " .f / / ; 7
... ..:::2_
0 I I . I I / I I I I 1971-72 73-74 75-76 77-78 79-80 81-82 83-84 85-86 87-88 Y e a r/ ...'?'i..J
,/.,Cf
f
,.: / / , -
/ ...'"/ : /
j
... . / i , "
o . ~ s f / . . . . "_2 .. . . " . " 9 9 jsz /~---i. g m I I I I I L I I I 1971-72 73-74 75-76 77-78 79-80 81-82 83-84 85-86 87-88 Y e a r 977Fig.7A, B. Secular trends of diabetes mellitus mortality in Taiwan, 1971-1988 by urbanization and sex. A Male Metropolitan - - , City ... , Town - - -, Rural . . . . B Female Metropolitan--, City ... , Town - - -, Rural ...
gm or % 160 140 120 100 80 60 40 20 Calorie Y ] 3,100 ~ -
13,000
/ ... 2,900 2,800 " 2,700 2,600 / / - ... 1 2,500 ... [ ... i' 2,400 \ / L . / L i l i i 1 I-g. i i I i i I i I I i I i ] i i i I I I i i 1960 1965 1970 1975 1980 1985 2,300 T O Y e a rFig. 8. Secular trends of per capita income, and of calorie, protein, and fat consumption in Taiwan, 1960-1988. Fat (g) - - , Protein (g) ---, Calorie . . . , Income ... . Index year for per capita income is 1981 as 100 (US$ 2, 443)
support o u r contention, showed that the age-adjusted prevalence rates for those aged 40 years or o v e r in Taipei City w e r e 5.05 %, 7.10 %, 8.17 % for 1970, 1979, and 1986, respectively [13]. As well as this, our analysis, which by means of the age-period-cohort m o d e l revealed that, in addition to age and period effects, birth-cohort effect al- so played a significant role in the trends, which might ac- count for part of this p h e n o m e n o n because the elderly represent an earlier generation w h e n the risk of dying from diabetes increased in successive birth-cohorts, whe- reas the young live in a generation w h e n rising trends have levelled off. Alternatively, the elderly who expe- rienced or accumulated sufficient amounts of diabetic risk factors in their lifetime, and received additional trig- gers f r o m the current affluent environment, would be
most likely to develop the disease, and therefore, show the most conspicuous rising mortality trends 9 Increasing fat consumption and calorie intake as well as less physical activity associated with urbanization might account for the dramatic increase in diabetes mortality in Taiwan which deserves further study.
T h e significant birth-cohort effects for diabetes found in this study imply that some important determinants of the disease might occur early in life, but not show their effects until s o m e time later. F o r example, vocational preferences, dietary habits and the nutritional status of a birth cohort m a y be d e t e r m i n e d in early life. But we must also consider possible generation-related reproductive experiences or age-specific exposures such as war, epide- mics or lifestyle changes, which might enhance or be de-
t r i m e n t a l to s o m e d e v e l o p m e n t a l stages of diabetes. It is of interest to n o t e after the 1910-1917 birth c o h o r t a con- tinuously declining risk in the r e c e n t birth c o h o r t s f o r fe- males. It raises a possible suggestion t h a t e n v i r o n m e n t a l factors, regardless of w h a t t h e y were, h a d diminished the intensity in later birth c o h o r t s for females but n o t for m a - les. T h e declining p a r i t y of w o m e n is t h o u g h t to be asso- ciated with this birth c o h o r t effect for females as the ge- neral fertility rate in Taiwan has s h o w n a declining t r e n d after 1952. T h e p r e s e n t findings can also be c o m p a r e d to o u r p r e v i o u s study of p a n c r e a t i c c a n c e r [9] w h e r e m o r t a - lity was s h o w n to h a v e increasing c o h o r t effects up to the 1917-1926 b i r t h - c o h o r t and declined t h e r e a f t e r for b o t h sexes. It is worthwhile, to f u r t h e r explore what, besides the r e p r o d u c t i v e factors, differentiates the patterns of c o h o r t effects f o r diabetes b e t w e e n males a n d females and those b e t w e e n diabetes a n d p a n c r e a t i c c a n c e r in Taiwan.
Excess risk for diabetes in u r b a n areas, r e p e a t e d l y de- m o n s t r a t e d in studies c o n d u c t e d in almost all parts of the w o r l d [14-16], a p r e v i o u s study in T a i w a n [17], and again in this s t u d y s e e m consistent with the h y p o t h e s i s o f an u r b a n i z a t i o n f a c t o r in the a e t i o l o g y of diabetes. O b e s i t y [13, 18-20], physical activity [21-24], diet [25-27], psy- chosocial stress d u e to m o d e r n i z a t i o n [28, 29], and o t h e r variables [30-32] h a v e b e e n p r o p o s e d as risk factors for diabetes which are associated with urbanization. H o w - ever, o t h e r possible factors in an u r b a n e n v i r o n m e n t o p e r a t i n g i n d e p e n d e n t l y of the a b o v e r e m a i n to be ex- plored.
While diabetic incidence studies d e m o n s t r a t e no clear evidence that g e n d e r influences the risk for t h e d e v e l o p - m e n t of diabetes [31], high m o r t a l i t y rates in females h a v e b e e n r e p e a t e d l y s h o w n in mortality statistics f r o m various countries [33, 34]. This a p p a r e n t p a r a d o x m a y be attribu- table to the h i g h e r fatality rate f o r f e m a l e diabetic patients [33]. U s i n g p r e v a l e n c e data, which m a y be c o n f o u n d e d b y the d u r a t i o n of disease, f u r t h e r complicates t h e aetiolo- gical inference. T h e r e f o r e , a c o m p r e h e n s i v e m o d e l [35] with which to describe p r e v a l e n c e , mortality, a n d inciden- ce of diabetes in the general p o p u l a t i o n is clearly war- ranted.
Acknowledgements. The authors are indebted to Ms. H-WLin and
Mr. S-C Hung for their excellent secretarial assistance.
References
1. National diabetes data group (1983) Harris M, Hammon R (eds) Diabetes in America. NIH Pub, No. 85-1468. Government Print- ing Office, Washington
2.Taiwan Provincial Department of Health (1971-1988) Vital statistics. Chung-Hsin New Village, Provincial Department of Health, Taiwan, ROC
3.Tzeng GH, Wu TY (1986) Characteristics of urbanizational levels in Taiwan districts. Geograph Res 12:287-323
4. Council for economic planning and development, ROC (1991) Taiwan statistical data book. Taipei, Taiwan. ROC
5.Breslow NE, Day NE (1987) Statistical methods in cancer re- search, vol. II.International Agency for Research on Cancer Scientific Publications, Lyon
6.Waterhouse RJ, Muir C, Correa R Powell J (1976) Cancer in- cidence in five continents, vol III. International Agency for Re- search on Cancer Scientific Publications, Lyon
7. Robertson C, Boyle P (1986) Age, period, and cohort models: the use of individual records. Stat Med 5:527-538
8.Statistics and epidemiology research corporation (1988) Egret user's manual, copyright 1985-1988. Washington
9. Lee WC, Lin RS (1990) Age-period-cohort analysis of pancreatic cancer mortality in Taiwan, 1971-1986. Int J Epidemiol 19: 839- 847
10.Palumbo PJ, Elveback LR, Chu CR Connolly DC, Kurland LT (1976) Diabetes mellitus: incidence, prevalence, survivorship, and causes of death in Rochester, Minnesota 1945-1970. Diabetes 25:566-569
11. Tokuhata GH, Miller W, Digon E, Hartnab T (1975) Diabetes mellitus: an underestimated public health problem. J Chron Dis 28:23-35
12.Fuller JH, Elford J, Goldblatt R Adelstein AM (1983) Diabetes mortality: new light on an underestimated public health prob- lem. Diabetologia 24:336-341
13.Tai TY, Yang CL, Chang CJ et ai. (1987) Epidemiology of diabetes mellitus among adults in Taiwan, ROC. J Med Ass Thai- land 70 [SuppI 2]: 42-48
14.Zimmet P, Taylor R, Ram Pet al. (1983) Prevalence of diabetes and impaired glucose tolerance in the biracial (Melanesian and Indian) population of Fiji: a rural-urban comparison. Am J Epi- demiol 118:673-688
15. King H, Zimmet R Raper LR, Baldau B (1984) Risk factors for diabetes in three Pacific populations. Am J Epidemiol 119: 396- 409
16. Papoz L, Khalifa B, Eschwege E, Ayed HB (1988) Diabetes mel- litus in Tunisia: description in urban and rural populations. Int J Epidemio] 17:419-422
17.Tai TY, Yang CL, Chang CJ et al. (1987) Epidemiology of diabetes mellitus in Taiwan, ROC: comparison between urban and rural areas. J Med Ass Thailand 70 [Suppl 2]: 49-53 18. Knowler WC, Pettitt D J, Savage P J, Bennett PH (1981) Diabetes
incidence in Pima Indians: contributions of obesity and parental diabetes. Am J Epidemio1113:144-156
19. Ohlson LO, Larsson B, Svardsudd K et al. (1985) The influence of body fat distribution on the incidence of diabetes mellitus: 13.5 years of follow up of the participants in the study of men born in 1913. Diabetes 34:1055-1058
20.Modan M, Karasik A, Halkin H et al. (1986) Effect of past and concurrent body mass index on prevalence of glucose intolerance and type 2 (non-insulin-dependent) diabetes and on insulin re- sponse: the Israel study of glucose intolerance, obesity and hypertension. Diabetologia 29:82-89
21. Lipman RL, Raskin R Love T et al. (1972) Glucose intolerance during decreased physical activity in man. Diabetes 21:101-107 22. Bogardus C, Ravussin E, Robbins DC, Wolfe RR, Horton ES,
Sims EAH (1984) Effects of physical training and diet therapy on carbohydrate metabolism in patients with glucose intolerance and non-insulin-dependent diabetes mellitus. Diabetes 33: 311- 318
23. Taylor R, Ram R Zimmet R Raper LR, Ringrose H (1984) Physi- cal activity and prevalence of diabetes in Melanesian and Indian men in Fiji. Diabetologia 27:578-582
24. Frisch RE, Wyshak G, Albright TE, Albright NL, Schiff I (1986) Lower prevalence of diabetes in female former college athletes compared with nonathletes. Diabetes 35:1101-1105
25.Trowell H (1975) Dietary-fiber hypothesis of the etiology of diabetes mellitus. Diabetes 24:762-765
26. West KM (1978) Epidemiology of diabetes and its vascular com- plications. Elsevier, New York
27. Kawate R, Yamakido M, Nishimoto Y. (1979) Diabetes mellitus and its complications in Japanese migrants on the island of Hawaii. Diabetes Care 2:161-170
28.Porte D Jr, Berthoud HR, Jeanrenaud B, Woods SC (1981) Diabetes and the nervous system. Diabetologia 20 [Suppl]: 305 313
R. S. Lin and W. C. Lee: Diabetes mellitus mortality in Taiwan 29. Taylor R, Zimmet P (1983) Migrant studies in diabetes epidemi-
ology. In: Mann JI, Pyorala K, Teuscher A (eds): Diabetes in epi- demiological perspective. Churchill Livingstone
30. Zimmet P (1982) Type 2 (non-insulin-dependent) diabetes - a n epidemiological overview. Diabetologia 22:399411
31.Nelson RG, Everhart JE, Knowler WC, Bennett PH (1988) In- cidence, prevalence and risk factors for non-insulin-dependent diabetes mellitus. Primary Care 15:227-250
32. Taylor R (1989) Aetiology of non-insulin dependent diabetes. Br Med Bull 45:73-91
33.Hamman RF (1983) Diabetes in affluent societies. In: Mann JI, Pyorala K, Teuscher A (eds) Diabetes in epidemiologicat per- spective. Churchill Livingstone
34. Entmacher PS, Krall LP, Kranczer SN (1985) Diabetes mortality from vital statistics. In: Marble A, Krall LP, Bradley RE Christ- lieb AR, Soeldner JS (eds) Joslin's diabetes mellitus, 12th ed. Lea & Febiger, Philadelphia
979 35.Herman WH, Sinnock R Brenner E (1984) An epidemiologic
model for diabetes mellitus: incidence, prevalence, and mor- tality. Diabetes Care 7:367-371
Received: 10 April 1992 and in revised form: 10 June 1992
Dr.R.S.Lin
Institute of Public Health College of Medicine National Taiwan University 1 Jen-Ai Rd. 1st Sec. Taipei
Taiwan ROC