BioMed Central
Page 1 of 9 (page number not for citation purposes)
BMC Genetics
Open Access
Research article
Segregation analysis of apolipoprotein A1 levels in families of
adolescents: A community-based study in Taiwan
Kuo-Liong Chien
1,2, Wei J Chen
3, Hsiu-Ching Hsu
2, Ta-Chen Su
2,
Ming-Fong Chen
2and Yuan-Teh Lee*
2Address: 1Institute of Preventive Medicine, School of Public Health, National Taiwan University, Taipei, Taiwan, 2Department of Internal
Medicine, National Taiwan University Hospital, Taipei, Taiwan and 3Institute of Epidemiology, College of Public Health, National Taiwan
University, Taipei, Taiwan, Department of Psychiatry, National Taiwan University Hospital, Taipei, Taiwan
Email: Kuo-Liong Chien - [email protected]; Wei J Chen - [email protected]; Hsiu-Ching Hsu - [email protected]; Ta-Chen Su - [email protected]; Ming-Fong Chen - [email protected]; Yuan-Teh Lee* - [email protected]
* Corresponding author
Background: Apolipoprotein (Apo) A1 is a protective factor for cardiovascular events. This study
aimed to perform complex segregation analyses of Apo A1 levels in families of adolescents systematically ascertained from the junior high school students in a rural community. Both siblings and parents of the adolescent probands were recruited for the study. Apo A1 concentrations were measured by turbidimetric immunoassay methods. After adjustment for gender, age, body mass index, smoking and drinking status, residual values of Apo A1 were subjected to subsequent analyses.
Results: Significant mother-father and parent-offspring correlations were found. Commingling
analyses indicated that a four-component distribution model was needed to account for the Apo A1 variation. Segregation analysis using regressive models revealed that the best-fit model of Apo A1 was a model of environmental effect plus familial correlation (heritability = 23.9%), in which a significant mother-father correlation existed. Models containing major gene effect could be rejected.
Conclusion: These results suggest that variations of Apo A1 levels in the normal range, especially
during adolescence, are likely to be influenced by multiple factors without significant contribution from major genes.
Background
Apolipoprotein (Apo) A1, one of the structural proteins in high-density lipoprotein particles, is a protective factor against the development of atherosclerotic vascular dis-ease [1,2]. It promotes cholesterol efflux from cells and maintains cellular cholesterol homeostasis. Although the structure of Apo A1 and its corresponding genetic locus have been well characterized [3,4], the levels of Apo A1
are influenced by factors that remain largely unknown. Determinants of Apo A1 concentrations such as gender, age, obesity, and lifestyles, account for only a small pro-portion of the variance (at most 7%) [5-7]. The DNA pol-ymorphisms of the Apo A1 gene affect Apo A1 concentrations only mildly [8]. Meanwhile, significant genetic contribution to Apo A1 concentrations is indi-cated by results from family and twin studies [9,10]. The Published: 20 January 2006
BMC Genetics 2006, 7:4 doi:10.1186/1471-2156-7-4
Received: 08 March 2005 Accepted: 20 January 2006 This article is available from: http://www.biomedcentral.com/1471-2156/7/4
© 2006 Chien et al; licensee BioMed Central Ltd.
This is an Open Access article distributed under the terms of the Creative Commons Attribution License (http://creativecommons.org/licenses/by/2.0), which permits unrestricted use, distribution, and reproduction in any medium, provided the original work is properly cited.
BMC Gene tics 20 06, 7 :4 http://www.bi omedcen tr al .co m /14 71-21 Page (page nu mber not for cit a tion pur
Mean SD Skewness Kurtosis Mean SD Skewness Kurtosis Mean SD Skewness Kurtosis
Age (years) *** 16.45 0.97 0.33 0.34 17.83 3.43 0.59 1.05 43.65 5.74 1.35 4.65 BW (kg) *** 54.07 12.87 1.04 1.48 52.57 11.03 0.93 2.54 62.87 11.93 1.08 6.02 BH (cm) 161.28 8.46 -0.06 0.03 161.27 8.95 -0.01 1.06 160.90 7.68 0.07 -0.31 BMI (kg/m2) *** 20.63 3.87 1.13 1.24 20.08 3.13 1.31 4.26 24.23 3.91 1.03 4.40 SBP (mmHg) *** 108.86 13.02 0.34 -0.34 111.65 12.90 0.36 0.27 119.13 15.12 0.82 1.28 DBP (mmHg) *** 67.79 9.33 -0.05 -0.75 70.66 10.36 0.18 0.51 78.48 11.46 0.70 0.68 TC (mg/dL) *** 168.98 36.43 1.78 11.91 164.94 33.17 0.74 0.70 195.85 35.76 0.29 0.54 TG (mg/dL) *** 85.49 40.14 1.92 7.98 88.86 43.67 2.96 18.43 156.24 134.29 2.66 8.26 HDL-C (mg/dL) * 43.49 10.44 0.50 0.23 44.21 9.55 0.46 0.07 42.26 11.02 0.72 0.77 LDL-C (mg/dL) *** 79.67 32.08 0.61 0.33 86.24 35.61 1.35 4.74 122.13 36.22 0.26 0.61 Apo A1 (mg/dL) *** 108.84 18.19 1.17 4.69 116.49 21.59 1.23 2.81 122.85 23.07 1.06 6.53 Apo B (mg/dL) *** 46.76 13.39 0.35 1.80 49.70 13.87 0.14 0.46 64.53 18.85 1.64 5.32 Smoking *** 1 (0.3%) 35 (10.5%) 159 (35.8%) Alcohol drinking *** 1 (0.3%) 25 (7.5%) 173 (39.0%)
*: p < 0.05, ** p < 0.01, *** p < 0.001 among group difference by ANOVA (for continuous variables) or chi-square test (for categorical variables). Abbreviated: BMI: body mass index, SBP: systolic blood pressure, DBP: diastolic blood pressure, BH: body height, BW: body weight, TC: total cholesterol, TG: triglyceride, HDL-C: high density lipoprotein cholesterol; LDL-C: low density lipoprotein cholesterol, Apo: apolipoprotein.
BMC Genetics 2006, 7:4 http://www.biomedcentral.com/1471-2156/7/4
Page 3 of 9 (page number not for citation purposes) mode of inheritance for Apo A1 concentrations, however,
remains to be clarified.
The mode of inheritance as revealed by complex segrega-tion analysis (CSA) can provide evidence whether there is a major gene effect for Apo A1 concentrations, which is important for subsequent gene localization [11]. Even if some major susceptibility genes are already identified, CSA can help shed light on whether other genes exist [12]. So far studies of CSA on Apo A1 concentrations have been conducted mainly in different samples such as from hos-pital-based patients or community-based adults, with conflicting findings reported [7,8,13-18]. First, earlier CSA
in families of probands who either had coronary heart dis-eases or underwent cardiac catheterization tended to sup-port the existence of major gene effect for Apo A1 concentrations [15,16]. However, a recent study with a large sample in relatives of probands who underwent car-diac angiography failed to find evidence for the major gene effect [8]. Second, two studies in families of adult probands identified from the community found evidence for major gene effect for Apo A1 concentrations [7,17]. But in the HERITAGE Family study, Both Apo A1 at base-line (sedentary state) and its response the training, the major gene was not inferred due to the ambiguous trans-mission of the major effect from parents to offspring after they followed a supervised exercise training program for 20 weeks [18].
Two reasons for these inconsistent results are possible. First, since coronary heart diseases have a variety of etiol-ogies and indications for angiography examinations vary, ascertaining probands under these clinical conditions would likely lead to etiological heterogeneity in terms of ApoA1 concentrations. Second, gene-environmental interaction may have an important role in the variation of Apo A1 levels and be more prevalent in the adulthood. One way to overcome these limitations is to conduct CSA in families of younger subjects who do not have clinical symptoms and are systematically ascertained. In this study we employed this approach to recruit adolescent probands and their first-degree relatives from a Taiwanese rural community. The study aimed to assess the possible mechanisms of genetic contribution to Apo A1 concentra-Table 2: Familial correlation coefficients of residual Apo A1
levels in this family study
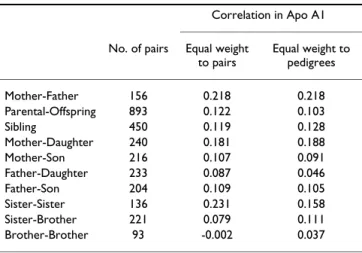
Correlation in Apo A1 No. of pairs Equal weight
to pairs Equal weight to pedigrees Mother-Father 156 0.218 0.218 Parental-Offspring 893 0.122 0.103 Sibling 450 0.119 0.128 Mother-Daughter 240 0.181 0.188 Mother-Son 216 0.107 0.091 Father-Daughter 233 0.087 0.046 Father-Son 204 0.109 0.105 Sister-Sister 136 0.231 0.158 Sister-Brother 221 0.079 0.111 Brother-Brother 93 -0.002 0.037
Table 3: Parameter estimates from segregation analysis of residual Apo A1 levels under Class D regressive models, conditional on proband phenotypes
Model Sporadic Familial correlations Environmental Mendelian General
qA [1] [1] 0.974 0.854 0.976 τAA - - =qA [1] 0.971 τAB - - =qA [0.5] 0.989 τBB - - =qA [0] 1.000 AA 118.0 118.4 115.8 118.2 115.9 AB = AA = AA 167.2 114.2 167.3 BB = AA = AA 287.7 195.9 287.8 σ2 492.9 493.2 331.9 390.3 333.3 ρMF [0] 0.240 0.302 0.267 0.301 ρMO [0] 0.129 0.263 0.204 0.266 ρFO [0] 0.081 0.148 0.149 0.148 ρSS [0] 0.000 0.114 0.088 0.115 Parameter # 2 6 9 9 12 -2ln(L) 6453.22 6435.17 6327.62 6361.51 6327.32 AIC 6457.22 6447.17 6345.62 6370.51 6351.32 χ2 125.9 107.85 0.30 34.19 -P 0.000 0.000 0.960 0.000
-Abbreviation: #, number of parameters; SEM, standard error of mean; qA, gene frequency; τAA, τAB, τBB, transmission probability; µAA, µAB, µBB, genotype means; σ2, variance; ρMF, ρMO, ρFO, ρSS, correlation coefficients among spouse, mother-offspring, father-offspring and sibling pairs;
#, number of parameters; ln(L), logarithm of likelihood; AIC, Akaike information criteria; P, significance level compared with the unrestricted general model.
tions through a series of family-genetic analyses, includ-ing familial correlation, comminclud-inglinclud-ing analysis, and CSA.
Results
There were 368 probands, 333 siblings and 444 parents in this study. Their distributions on demographic and atherosclerotic risk variables were presented in Table 1. All subjects had average body fatness (mean BMI values of 20 in the probands and siblings, and 24 in the parents). The parents had higher blood pressure, lipid profiles, and smoking and drinking rates than the probands and sib-lings. In addition, the parents had larger standard devia-tions in BMI, blood pressure and lipid profiles, especially in triglyceride, than their offspring. The values of skew-ness and kurtosis showed that Apo A1, Apo B, and triglyc-eride values were not normally distributed.
Proportion of Apo A1 variation in this sample explained by gender, age, age2, BMI, smoking and drinking habits was only 7.3%. The correlation between residual Apo A1 concentrations among family members after adjustment for nonlipid covariates is displayed in Table 2. The mother-father correlation coefficient was relatively high as compared with other familial correlations, indicating a strong environment effect and a weak genetic effect on Apo A1 levels. It is possible that there is a sex-specific influence in the variation of Apo A1 levels in the study subjects. The mother-daughter (0.18) and sister-sister (0.23) correlations were higher than father-son (0.11), brother-brother (0.00) or cross-sex correlations for the variation in Apo A1 levels.
Commingling analysis showed that a 4-component rather than a single, two or three-component distribution was the best-fit model for Apo A1 variance. The component means, variances, and proportions for the 4-component distribution model were (-0.741, 0.036, 1.142, 2.124), (0.167, 0.593, 4.813, 0.066), and (18.6%, 73.8%, 5.2%, 2.4%), respectively. The χ2 for comparing the 4-compo-nent with 3-compo4-compo-nent distribution was 14.21 (df = 3, p = 0.003), while that for comparing the 4-component with 5-component distribution was 4.31 (df = 3, p = 0.230). The finding of multiple distributions is compatible with a major gene hypothesis; however, commingling may also arise through other causes. Thus, segregation analysis was used to determine whether these major effects segregated in families according to Mendelian expectations.
The results of complex segregation analysis of Apo A1 are presented in Table 3. The sporadic model, familial corre-lations model, and Mendelian model were rejected due to a P value for each model's χ2 of less than 0.001. The envi-ronmental model is the best-fit one. Under this model, factor A is pervasively present in the population (fre-quency = 0.97) and the mother-father correlation coeffi-cient was 0.30. The mother-offspring correlation was higher than the father-offspring correlation (0.26 vs. 0.15). If the four familial correlations in the general model were reduced to two (ρMF = 0.28 ρMO = ρFO = ρSS = 0.18), the fit was not significantly worse (-2lnL = 6332.82, χ2 = 5.50, df = 2, P = 0.064). The estimated her-itability was 23.9%.
To rule out the possibility that our rejection of the major gene effect was due to numerical failure, sensitivity analy-sis of likelihood values was conducted for the Mendelian model. The results are plotted in Figure 1. Only three ini-tial values can reach the global maximum, and the likeli-hood curves were irregular. The model with parameters estimated under this global maximum could still be rejected as it was compared with the general model. Genetic heterogeneity was tested by plotting -2ln(LE/LM), in which LE refers to the likelihood of the environmental model and LM to that of the Mendelian model (Figure 2). One outlier (i.e., a value of 25.52 for -2ln(LE/LM)) was found favoring the Mendelian model. A repeated segrega-tion analysis after excluding this outlier demonstrated that the environmental model was still the best-fit model.
Discussion
This study clearly demonstrated that there were significant familial aggregation and commingling components in Apo A1 concentrations among families of adolescents. However, we found that the environmental model that allows for familial correlation rather than the Mendelian model explained the familial aggregation of Apo A1 best. Sensitivity analysis of -2lnL by initial gene frequency values
from 0.01 to 0.99, in steps of 0.01, under the Mendelian model of residual Apo A1 levels in this family study
Figure 1
Sensitivity analysis of -2lnL by initial gene frequency values from 0.01 to 0.99, in steps of 0.01, under the Mendelian model of residual Apo A1 levels in this family study.
6300 6350 6400 6450 6500 6550 6600 6650 6700 6750 6800 0.01 0.11 0.21 0.31 0.41 0.51 0.61 0.71 0.81 0.91 Gene frequency -2 ln * l ik el ihood
BMC Genetics 2006, 7:4 http://www.biomedcentral.com/1471-2156/7/4
Page 5 of 9 (page number not for citation purposes) Two main features of this study are worth noting. First,
there is considerable homogeneity in this study popula-tion. Most of the subjects live in the same community, hence their social and living environments tended to be more similar than those in different communities. Sec-ond, the results are particularly relevant for a population at low risk for atherosclerosis, since the probands were randomly selected from adolescents in the community. Our results were consistent with those of previous familial correlation and commingling studies [19], which demon-strated that more than one component is needed to explain the distribution of lipids. Previous estimates for the heritability of Apo A1 were 0.2 to 0.3 [20,21]. The high mother-father correlation found in this study indi-cated that there might be assortative mating and/or com-mon household factors affecting Apo A1 concentrations. We found there were 6.04% parents who knew their hyperlipidemia disease, and less than 1% had history of coronary heart disease. There were only 1.65% parents taking regular hypolipidemic drugs. We think the effects of lipid-lowering drugs were minimal for parent's lipid profiles. We found that the correlation between mother and offspring over Apo A1 was greater than the correlation between father and offspring. Similar results were reported in HDL cholesterol concentrations [22]. Similar-ity in patterns of lifestyle and physical activSimilar-ity among fam-ily members may explain the effects of assortative mating and common household effects [23].
The mode of inheritance of Apo A1 concentrations in this study was best explained by a model of mixed
environ-mental effect and familial correlation. No major gene effect was found. This is similar to the finding of a recent study [18] but contrary to the findings from two studies in families of adult probands identified from the community [7,17]. Several reasons may account for the lack of major gene effect in this study. First, it may reflect the complexity of Apo A1 metabolism. Although Apo A1 is the direct product of a single gene, it is distributed across the full range of HDL particles and other lipoproteins as well. Therefore, Apo A1 concentrations are likely to be influ-enced by many genetic as well as environmental factors. Hence, this renders the detection of any singular effect of a major gene difficult. Intriguingly, CSA of HDL choles-terol, one phenotype strongly related to Apo A1, also revealed that the environmental model was the best-fit model [24]. Second, there might still be residual con-founding on Apo A1 levels from covariates that were not controlled for in this study, such as physical activity and hormone replacement. Third, there were no extreme Apo A1 levels found in this population. Thus, for variation of Apo A1 within the normal range, there might be no major gene effect of considerable magnitude. Finally, the differ-ent study population characteristics were one possible rea-son for incongruent results on the mode of inheritance studies of HDL cholesterol and Apo A1 levels, and this study was presented as subjects with normal range of Apo A1 levels. Also, it is important to consider the inverse rela-tionship between triglyceride and HDL and Apo A1 levels. The rationale for not including triglyceride or HDL in the model was as follows. The genomic profiles controlling Apo A1 and triglyceride or HDL might be overlapped. Adjusting triglyceride or HDL will eliminate the genetic proportions of controlling HDL and triglyceride, and a part of Apo A1 levels. It was contradictory to our primary hypothesis to explore the genetic components of Apo A1 levels. Therefore, the genetic results may be confounded by triglyceride or HDL components, and did not separate the background of specific traits.
Another possible reason for our failure to detect a major gene effect for Apo A1 is the young age of our subjects. Age plays an important role for genetic control on phenotype expression, and environmental factors add complication in lipid traits. A recent study on the effect of quantitative trait loci for lipid phenotypes in the rat indicated that genetic components become important factors to the con-trol of phenotype expression as age increases [25]. Among human, Apo A1 was also reported to have intergenera-tional differences in heritability [26]. However, lack of a major gene in the study families does not exclude the pos-sibility that there are major genes that will influence Apo A1 levels in late adulthood. For example, there have been reports suggesting pleiotropy affecting lipid-related traits and obesity. Substantial evidence for quantitative trait loci with pleiotropic effects influencing BMI and HDL were Distribution of families favoring the environmental or
Men-delian model in segregation analysis of residual Apo A in this family study, presented by the -2ln(LE/LM) ratio, LE: likeli-hood of environmental model, LM: likelilikeli-hood of Mendelian model
Figure 2
Distribution of families favoring the environmental or Men-delian model in segregation analysis of residual Apo A in this family study, presented by the -2ln(LE/LM) ratio, LE: likeli-hood of environmental model, LM: likelilikeli-hood of Mendelian model.
found in the Framingham Heart Study [40]. We con-ducted analyses with BMI as a covariate. If pleiotropy exists affecting body weight and lipid-related traits, adjust-ing for BMI would likely hide the genetic effect on ApoA1. This could explain why our study did not identify a major gene contribution. Finally, we have collected several items about food intakes among the family members, such as vegetarian, meats, and rice amounts. The high spouse cor-relation coefficient was not associated with above varia-bles. It is the limitation of our study to explain the possible common household effects on Apo A1 levels. Segregation analysis is typically very sensitive to ascertain-ment, and false assumptions on ascertainment could invalidate the estimates obtained through segregation analysis (11). Highly selected samples obtained through a phenotype-based ascertainment scheme may lead to biased estimates. Therefore, the ascertainment scheme is very important on segregation analysis. Although we did not ascertain probands on ApoA1 trait, the likelihoods corrected for ascertainment on probands' ApoA1 levels provided efficient estimation. The results of likelihood without correction of proband ascertainment were similar to corrected likelihood results.
Complex segregation analysis was used to ask whether an inheritable trait is controlled by a single major gene plus residual polygenes, if so, gene mapping tasks would be warranted. If not, gene mapping studies would be lack of power because traditional statistical programs and sparse genetic markers would not provide sufficient tools to tackle a trait without major gene effects. However, this sit-uation has changed in the past few years. Now we know a complex trait is less likely to be influenced by a single major gene. Advanced statistical programs, dense genetic markers plus other new technologies has allowed us to investigate a complex trait where genes with small to moderate effects. In the post-genomics era, segregation analysis is considered as an intermediate tool to help investigators to plan further sophisticated genomic stud-ies. Although the method did not give information of exact DNA locus to find the genes, it can provide heritabil-ity estimates and parameters for further parametric link-age analysis. So segregation analysis should be useful and not obsolete. Further genotype-based methods such as linkage and association will be planned for elucidating genetic effects and locations.
The large proportion of un-response parents was the lim-itation of the study. Only 60% parents attended the study. The causes of low response rates were as follows. First, the parents were in the productive age (mean 44 years old) and they felt they were relatively healthy and were not interested in the health checkup. Second, the medical his-tory rates of atherosclerotic disease among participant
parents were very low. We found there were 6% partici-pant parents who knew their hyperlipidemia disease, and less than 1% had history of coronary heart disease. Although we cannot collect the data on un-response par-ents, we have checked the questionnaires of lifestyle pat-terns from the probands, and found the distributions of socioeconomic status and lifestyle patterns were similar between response and non-response parents. It might imply the response parents can be the representatives of all parents.
Conclusion
Variations of Apo A1 levels in the normal range, especially during adolescence, are likely to be influenced by multi-ple factors without significant contribution from major genes.
Methods
Subjects
This family study was part of the Chin-San Community Cardiovascular Study, a prospective cohort study began in 1990 [27,28]. The family study arm started in 1997 and was designed to recruit adolescent probands from stu-dents in the only junior high school in the community. At first, a total of 1063 students (response rate 94.6%) agreed to participate in a general health check-up after informed consent was obtained. They underwent examinations for anthropometric measures, blood pressure, and lipid pro-files, including total cholesterol, triglyceride, low density lipoprotein (LDL) cholesterol, body mass index, systolic pressure, diastolic pressure, and high density lipoprotein (HDL) cholesterol. The high-risk young probands were defined as the highest scores of above seven measures, which were 90th percentile values among all subjects (HDL as below 10th percentile, n = 171). The control young probands were ascertained by random sampling of other young students (n = 197). Because the original strat-ification was not based exclusively on the Apo A1 and the results of CSA for the families of the two strata were simi-lar, only the results of all families together with correction for ascertainment on proband's Apo A1 were reported in this study. After obtaining informed consent from probands' family members, the same measures were per-formed for each family member. Only first-degree rela-tives were included for this genetic study, with a total of 1,145 subjects.
Measurement of lipid profiles
The measurement of various lipid profiles have been described in detail elsewhere [29]. Briefly, a blood sample of 20 ml was drawn from each participant after a 12-hour overnight fast. Enzymatic methods were used to deter-mine serum cholesterol and triglyceride (Merck 14354 and 14366 Germany, respectively). The HDL-C level was measured in the supernatant after precipating with
mag-BMC Genetics 2006, 7:4 http://www.biomedcentral.com/1471-2156/7/4
Page 7 of 9 (page number not for citation purposes) nesium chloride phosphotungstate reagents (Merck
14993, Germany). The LDL-C content was measured as "total cholesterol minus cholesterol in the supernatant" by the precipitation method [30]. (Merck 14992, Ger-many). If the triglyceride concentration was more than 400 mg/dL, cholesterol was measured from an infranate density more than 1.006 from ultracentrifugation [31]. Apo A1 and B concentrations were measured by turbidi-metric immunoassay using commercial kits (Sigma, USA). The standard samples for apolipoprotein assay were from the Center for Disease Control, USA. The coef-ficient of variation of Apo A1 measured in our laboratory was less than 3%. If extreme values were found, repeated measures were done for confirmation. All measures were performed in July and August, and hence seasonal varia-tion could be minimized.
Statistical analyses
We adjusted a person's Apo A1 concentrations for known determinants by regressing for age, gender, body mass index (BMI), smoking and alcohol drinking status. Both age and BMI were centered by subtracting the sample mean, 34.0 for age and 22.3 for BMI, from the corre-sponding variables. Residual values plus the sample mean of Apo A1 (116.8 mg/dL) were then used for further anal-yses.
The correlations of Apo A1 concentrations between mother-father, parent-offspring, and siblings were esti-mated by using the FCOR program in SAGE [32]. Next, commingling analysis of Apo A1 levels was performed using the ADMIX program to test whether the data were best described by one, two, or more component distribu-tions [33]. The parameters for each component's mean, variance, and proportion were estimated by the maximum likelihood method. Hypothesis testing for nested models was carried out with the likelihood ratio test.
Complex segregation analysis
Segregation analysis of Apo A1 levels was conducted using regressive models as implemented in the REGC program in SAGE These models assume that variation of Apo A1 concentration among family members is the result of a major gene effect, with the residual variation reflecting both familial correlations and individual variation. The presence of a major gene is assessed by allowing two fac-tors or alleles (A and B) at a single locus, resulting in three 'ousiotypes' (AA, AB, BB) in individuals (Cannings et al. 1977). The means of Apo A1 for each ousiotype is denoted AA, AB, BB, with one common variance of σ2. The frequencies of allele A and B are denoted qA and (1-qA), respectively. The distribution of types in the popula-tion is assumed to be in Hardy-Weinberg equilibrium. Individuals of each type are assumed to transmit allele A to their offspring with transmission probabilities τAA,
τAB and τBB, respectively. Residual familial resemblance not explained by this major locus is modeled by familial correlations. The correlation between spouses, parent and offspring, mother and offspring, father and offspring, and between siblings, are denoted ρMF, ρPO, ρMO, ρFO, and ρSS, respectively. For this study, we adopted class D regressive models, in which residual sib-sib correlations are equal among all sibs of common parentage and can be due to any cause. If ρPO is held equal to ρSS, these models have been shown to be mathematically and numerically equivalent to the conventional mixed model of inherit-ance in nuclear families [34]. Under this circumstinherit-ance, the heritability can be estimated by 2ρSS(σ2/σ2T), where σ2T is the total variance, and σ2 is the variance conditional on the major ouisotype [34].
The analyses started with fitting a general model, in which all parameters were allowed to be estimated. Then we compared the general model with various submodels in which certain parameters were restricted to specific values. Under a Mendelian model, the transmission probabili-ties, i.e., τAA, τAB and τBB, were held equal to Mendelian expectations of 1, 0.5, and 0. A nontransmitted environ-mental effect model predicts that the probability that an individual has one ousiotype or another is independent of both the person's generation and the ousiotypes of his/her parents. For the environmental model in this study, each of the transmission probabilities is taken to be equal to the factor frequency, i.e., τAA = τAB = τBB = qA. Both the Mendelian and environmental models can allow for resid-ual familial correlations. A pure polygenic model assumes no major gene effect, so gene frequency and transmission probabilities are all fixed to one. The fit of hierarchical models is compared with the likelihood ratio test, calcu-lated as -2 of the difference between the ln likelihood of the models being compared. The likelihood ratio value follows a chi-square distribution, with degrees of freedom equal to the difference between the models in the number of parameters estimated. Among nonhierarchical models, the most parsimonious model is that with the lowest val-ues of Akaike's information criterion (AIC = -2 ln likeli-hood + 2 [number of estimated parameters]) [35]. We used the adjusted Apo A1 values without logarithm transformation for the segregation analysis because nor-malizing transformation of a biologically skewed trait would decrease power to detect a major gene effect when one exists [36]. Instead, we fit the environmental model. If such a model can be rejected, the major gene effect will not be due to skewness of the residual Apo A1 levels [37]. Ascertainment correction was conducted by conditioning on the phenotypes of probands.
A sensitivity test of the model fitting, specified by initial values of gene frequency, was performed to differentiate
local maxima from global maximum [38]. We calculated the -2lnL values by setting initial gene frequency to values ranging from 0.01 to 0.99, in steps of 0.01, and fixed ini-tial means, variance, and familial correlations. We com-pared likelihood values of two models and calculated the ratio of log likelihood values to detect possible heteroge-neity [7,39].
Authors' contributions
KLC carried out the data collection, statistical analyses, participated in the study design and processing data. WCC & YTL participated in the design of the study and super-vised the ideas developing in hypothesis generation. MFC & HCH performed the laboratory measurement in lipid levels and in charge of quality control. All authors read and approved the final manuscript.
Acknowledgements
Owing to the kind participation of the people of Chin-Shan, Taiwan, this study is ongoing. The authors wish to thank the staff of the Department of Cardiology, National Taiwan University Hospital, Taiwan, for their contri-butions and cooperation. This study was partly supported by the National Science Council, Taiwan (NSC 92-2314-B-002-197).
References
1. Graffagnino C: Molecular genetics of lipid metabolism. In
Genetics of Cerebrovascular Disease Edited by: Alberts MJ. New York:
Futura Publishing; 1999:81-115.
2. Humphries SE, Peacock R, Gudnason V: Genetic determinants of
hyperlipidemia. In Lipoproteins in Health and Disease Edited by:
Bet-teridge DJ, Illingworth DR, Shepherd J. London: Oxford University Press; 1999:127-162.
3. Breslow JL: Human apolipoprotein molecular biology and
genetic variation. Annu Rev Biochem 1985, 54:699-727.
4. Franceschini G, Sirtori CR, Capurso A, Weisgraber KH, Mahley RW:
A-I Milano apoprotein. Decreased high density lipoprotein cholesterol levels with significant lipoprotein modifications and without clinical atherosclerosis in an Italian family. J Clin
Invest 1980, 66:892-900.
5. Srinivasan SR, Berenson GS: Serum apolipoproteins A-I and B as
markers of coronary artery disease risk in early life: the Bogalusa Heart Study. Clin Chem 1995, 41:159-164.
6. Brunner EJ, Marmot MG, White IR, O'Brien JR, Etherington MD, Slavin BM, Kearney EM, Smith GD: Gender and employment
grade differences in blood cholesterol, apolipoproteins and haemostatic factors in the Whitehall II study. Atherosclerosis
1993, 102:195-207.
7. Moll PP, Michels VV, Weidman WH, Kottke BA: Genetic
determi-nation of plasma apolipoprotein AI in a population-based sample. Am J Hum Genet 1989, 44:124-139.
8. Juo SHH, Beaty TH, Duffy DL, Coresh J, Kwiterovich PO: No
com-mon major gene for apolipoprotein A-I and HDL3-C levels: Evidence from bivariate segregation analysis. Genet Epidemiol
1999, 16:54-68.
9. Kuusi T, Kesaniemi YA, Vuoristo M, Miettinen TA, Koskenvuo M:
Inheritance of high density lipoprotein and lipoprotein lipase and hepatic lipase activity. Arteriosclerosis 1987, 7:421-425.
10. Sistonen P, Ehnholm C: On the heritability of serum high
den-sity lipoprotein in twins. Am J Hum Genet 1987, 32:1-7.
11. Jarvik GP: Complex segregation analyses: uses and
limita-tions. Am J Hum Genet 1998, 63:942-946.
12. Cui J, Antoniou AC, Dite GS, Southey MC, Venter DJ, Easton DF, Giles GG, McCredie MRE, Hopper JL: After BRCA1 and BRCA2
what is next? Multifactorial segregation analyses of three-generation, population-based Australian families affected by female breast cancer. Am J Hum Genet 2001, 68:420-431.
13. Amos CI, Elston RC, Srinivasan SR, Wilson AF, Cresanta JL, Ward LJ, Berenson GS: Linkage and segregation analyses of
apolipopro-teins A1 and B, and lipoprotein cholesterol levels in a large pedigree with excess coronary heart disease: the Bogalusa Heart Study. Genet Epidemiol 1987, 4:115-128.
14. Borecki IB, Laskarzewski P, Rao DC: Genetic factors influencing
apolipoprotein AI and AII levels in a kindred with premature coronary heart disease. Genet Epidemiol 1988, 5:393-406.
15. Prenger VL, Beaty TH, Kwiterovich PO: Genetic determination of
high-density lipoprotein-cholesterol and apolipoprotein A-1 plasma levels in a family study of cardiac catheterization patients. Am J Hum Genet 1992, 51:1047-1057.
16. Blangero J, Williams-Blangero S, Mahaney MC: Multivariate
genetic analysis of apo AI concentration and HDL subfrac-tions: evidence for major locus pleiotropy. Genet Epidemiol
1993, 10:617-622.
17. Blangero J, Williams-Blangero S, Mahaney MC, Comuzzie AG, Hixson JE, Samollow PB, Sharp RM, Stern MP, Maccluer JW: Effects of a
major gene for apolipoprotein A-I concentration are thyroid hormone dependent in Mexican Americans. Arterioscler
Thromb Vasc Biol 1996, 16:1177-1183.
18. An P, Rice T, Gagnon J, Borecki IB, Bergeron J, Despres JP, Leon AS, Skinner JS, Wilmore JH, Bouchard C, Rao DC: Segregation
analy-sis of apolipoproteins A-1 and B-100 measured before and after an exercise training program: the HERITAGE Family Study. Arterioscler Thromb Vasc Biol 2000, 20:807-814.
19. Friedlander Y, Kark JD, Cohen T, Eisenberg S, Stein Y: Admixture
analysis of high density lipoprotein cholesterol distribution in a Jerusalem population sample. Clin Genet 1983, 24:117-127.
20. Hamsten A, Iselius L, Dahlen G, de Faire U: Genetic and cultural
inheritance of serum lipids, low and high density lipoprotein cholesterol and serum apolipoproteins A-I, A-II and B.
Atherosclerosis 1986, 60:199-208.
21. Lamon-Fava F, Jimenez D, Christian JC, Fabsitz RR, Reed TE, Carmelli D, Castelli WP, Ordovas JM, Wilson PWF, Schaefer EJ: The NHLBI
twin study:heritability of apolipoprotein A-I, B, and low den-sity lipoprotein subclasses and concordance for lipopro-tein(a). Atherosclerosis 1991, 91:97-106.
22. Namboodiri KK, Green PP, Kaplan EB, Tyroler HA, Morrison JA, Chase GA, Elston RC, Rifkind BM, Glueck CJ: Family aggregation
of high density lipoprotein cholesterol. Collaborative lipid research clinics program family study. Arteriosclerosis 1983, 3:616-626.
23. Pyke SD, Wood DA, Kinmonth AL, Thompson SG: Change in
cor-onary risk and corcor-onary risk factor levels in couples following lifestyle intervention. The British Family Heart Study. Arch
Fam Med 1997, 6:354-360.
24. Bucher KD, Kaplan EB, Namboodiri KK, Glueck CJ, Laskarzewski P, Rifkind BM: Segregation analysis of low levels of high-density
lipoprotein cholesterol in the Collaborative Lipid Research Clinics Program Family Study. Am J Hum Genet 1987, 40:489-502.
25. Kovacs P, van den BJ, Kloting I: Effects of quantitative trait loci
for lipid phenotypes in the rat are influenced by age. Clin Exp
Pharmacol Physiol 1998, 25:1004-1007.
26. Boomsma DI, Kempen HJ, Gevers LJ, Havekes L, de Knijff P, Frants RR: Genetic analysis of sex and generation differences in
plasma lipid, lipoprotein, and apolipoprotein levels in adoles-cent twins and their parents. Genet Epidemiol 1996, 13:49-60.
27. Lee YT, Lin RS, Sung FC, Yang CY, Chien KL, Chen WJ, Su TC, Hsu HC, Huang YC: Chin-Shan Community Cardiovascular
Cohort in Taiwan: baseline data and five-year follow-up mor-bidity and mortality. J Clin Epidemiol 2000, 53:836-846.
28. Chien KL, Sung FC, Hsu HC, Su TC, Lee YT: Left ventricular mass
and correlated atherosclerotic risk factors in young adoles-cents: Report from Chin-Shan Community Cardiovascular Study in Taiwan. Atherosclerosis 2001, 155:431-437.
29. Chien KL, Lee YT, Sung FC, Hsu HC, Su TC, Lin RS:
Hyperinsuline-mia and related atherosclerotic risk factors in the population at cardiovascular risk: a community-based study. Clin Chem
1999, 45:838-846.
30. Wieland H, Seidel D: A simple specific method for precipitation
of low density lipoprotein. J Lipid Res 1983, 24:904-905.
31. Warnick GR, Benderson J, Albers JJ: Dextran sulfate-Mg2+
pre-cipitation procedure for quantitation of high-density-lipo-protein cholesterol. Clin Chem 1982, 28:1379-1388.
32. Statistical Analysis for Genetic Epidemiology, Release 3.1 Computer program package available from the Department
Publish with BioMed Central and every scientist can read your work free of charge "BioMed Central will be the most significant development for disseminating the results of biomedical researc h in our lifetime."
Sir Paul Nurse, Cancer Research UK Your research papers will be:
available free of charge to the entire biomedical community peer reviewed and published immediately upon acceptance cited in PubMed and archived on PubMed Central yours — you keep the copyright
Submit your manuscript here:
http://www.biomedcentral.com/info/publishing_adv.asp
BioMedcentral
BMC Genetics 2006, 7:4 http://www.biomedcentral.com/1471-2156/7/4
Page 9 of 9 (page number not for citation purposes)
of Epidemiology and Biostatistics, Cleveland, OH, USA.
Rammelkamp Center for Education and Research, MetroHelath Cam-pus, Case Western Reserve University; 1997.
33. Cloninger CR, von Knorring L, Oreland L: Pentametric
distribu-tion of platelet monoamine oxidase activity. Psychiatry Res
1985, 15:133-143.
34. Demenais FM, Bonney GE: Equivalence of the mixed and
regres-sive models for genetic analysis. I. Continuous traits. Genet
Epidemiol 1989, 6:597-617.
35. Akaike H: A new look at the statistical model identification.
IEEE Trans Automat Control 1974, 19:716-723.
36. MacLean CJ, Morton NE, Lew R: Analysis of family resemblance.
IV. Operational characteristics of segregation analysis. Am J
Hum Genet 1975, 27:365-384.
37. Demenais F, Lathrop M, Lalouel JM: Robustness and power of the
unified model in the analysis of quantitative measurements.
Am J Hum Genet 1986, 39:228-234.
38. Atwood LD, Kammerer CM, Mitchell BD: Exploring the HDL
like-lihood surface. Genet Epidemiol 1993, 10:641-645.
39. Juo SH, Beaty TH, Kwiterovich POJ: Etiologic heterogeneity of
hyperapobetalipoproteinemia (hyperapoB). Results from segregation analysis in families with premature coronary artery disease. Arterioscler Thromb Vasc Biol 1997, 17:2729-2736.
40. Kraft P, de AM: Group 6: Pleiotropy and multivariate analysis.