ELSEVIER
Journal of Chromatography A, 761 (1997) 277-284JOURNAL OF
CHROMATOGRAPHY A
Analysis of prostaglandins by micellar electrokinetic capillary
chromatography
You-Zung
Hsieh*, Kuang-Lung Kuo
Department of Applied Chemist~, National Chiao Tung University. Hsinchu. Taiwan Received 2 July 1996; revised 16 September 1996; accepted 20 September 1996
Abstract
This paper presents a rapid and reliable micellar electrokinetic capillary chromatography (MEKC) method to separate major prostaglandins and thromboxane B 2. The running buffer was modified with sodium dodecyl sulfate (SDS). The effects of the SDS concentration on the migration behavior of analytes was also examined. Moreover, the influences of electrolyte concentration and capillary temperature on the separation were investigated. In optimum conditions, seven major prostaglandins and thromboxane B 2 could be separated within 8 min. The relative standard deviations of the migration times (reproducibility) of the analytes were less than 0.82%.
Keywords: Buffer composition; Prostaglandins; Thromboxanes
1. I n t r o d u c t i o n
Prostaglandins, vitally important metabolic prod- ucts of arachidonic acid in humans [1,2], are in- volved in an extraordinary variety of normal physio- logical processes, such as maintaining blood pressure and body temperature and protecting organs from damage caused by diseases [3,4]. Different prosta- glandins may have opposite effects on the same organ and a given compound may affect different parts of the same organ in dissimilar ways [2]. Prostaglandins have also been identified as important mediators of inflammatory and allergic phenomena. In addition, they are used as drugs in pharmaceutical products. Prostaglandin endoperoxides can be trans- formed to thromboxane derivatives, such as throm- boxanes A 2 and B 2 [2]. Thromboxane A 2 and endoperoxides share similar properties, but the *Corresponding author.
former has an extremely short lifetime, with a t~/2 of about 30 s in a buffer solution [5]. Thromboxane A 2 was rapidly hydrolyzed into the less active throm- boxane B 2. Because of the significance of prosta- glandins and thromboxanes to human bodily func- tions, developing an adequate method to analyze these compounds is a worthwhile task.
The quantitation methods for prostagtandins analy- sis include specific radio immunoassays (RIA) and numerous high-performance liquid chromatography (HPLC) methods [6-10]. Although RIA has the advantages of high specificity and sensitivity, it has the drawback of requiring a separation process before a compound is analyzed [6]. HPLC is a well established method for prostaglandin analysis, but reportedly, most HPLC methods are appropriate for resolving only a single class of metabolites [8,9]. Also, simultaneously separating seven major prosta- glandins by the HPLC method takes approximately one hour [10]. In addition, the high reaction activity 0021-9673/97/$17.00 Copyright © 1997 Elsevier Science B.V. All rights reserved
of prostaglandins makes the storage of prostaglan- dins a difficult task. Furthermore, standards of prostaglandins are not easily obtained. Consequently, it is a worthwhile task to develop a rapid and efficient analysis method that not only requires minimal samples for analysis but can also inhibit the degradation of samples during analysis.
Micellar electrokinetic capillary chromatography (MEKC) is a high-resolution capillary electropho- resis (CE) technique [11-15], which requires a markedly smaller sample than HPLC, thereby mak- ing MEKC quite appropriate for analyzing prosta- glandin samples. Separating analytes by MEKC is based on distinguishing their respective migration velocities by their different partition coefficients between the aqueous solution phase and the micellar pseudostationary phase. A surfactant is used as a pseudostationary phase in the MEKC running buffer and sodium dodecyl sulfate (SDS) is the most widely used surfactant. SDS, comprised of both hydrophobic and hydrophillic regions, is an anionic surfactant. The anionic surfactant monomers form negatively charged SDS micelles that can extend the elution range of hydrophobic compounds. The analytical technique presented herein possesses the advantages of CE having a high separation efficiency, short analysis time, a minimal sample and solvent con- sumption and easy automation.
The present study examined the feasibility of applying MEKC to prostaglandins and thromboxane B 2 analysis. SDS was employed to modify the MEKC running buffer, thereby yielding adequate separation results. In addition, the effects of various electrolyte concentrations and methanol concentra- tions on the migration times of the eight analytes were studied. Moreover, the influence of separation temperature on their migration behaviors was investi- gated. Finally, a spiked sample was analyzed in optimum separation conditions.
2. Experimental 2.1. Apparatus
A Beckman P/ACE system 2000 capillary electro- phoresis system (Beckman Instruments, Palo Alto, CA, USA) was used. Detection was done by on-
capillary UV absorbance measurements at a wave- length of 200 nm. A personal computer using System Gold software (Beckman Instruments, San Ramon, CA, USA) controlled the P/ACE instrument. A 47 cm (40 cm to the detector)X50 ~zm I.D. fused-silica capillary tube (Polymicro Technologies, Phoenix, AZ, USA) was used. The capillary column was assembled in the cartridge format. Temperature of the capillary during electrophoresis was maintained between 15°C and 39°C by the instrument thermo- stating system. Samples were pressure injected at 0.034 bar [0.5 p.s.i. (1 p.s.i.=6894.76 Pa)]. The electrophoretic separation was performed with an electric potential of 20 kV. Data analysis was also performed on System Gold software.
2.2. Chemicals
Prostaglandins A2, B2, D2, E~, E2, F~, and F2a and thromboxane B 2 were purchased from Biomoi (Biomol Research Labs., Plymouth Meeting, PA, USA). SDS and borax were obtained from Sigma (St. Louis, MO, USA). Isopropanol and methanol were purchased from Merck (Darmstadt, Germany). All other chemicals were analytical grade. Water was purified by a Milli-Q water system (Millipore, Bedford, MA, usA).
2.3. Sample and buffer preparation
Prostaglandin standards were dissolved in iso- propanol and stored at -20°C. Sample solution was prepared by dissolving the prostaglandin standard solutions to a diluting solution containing isopropan- ol-buffer (1:4, v/v). The sample solution contained 125 ng/Ixl of solute for each prostaglandin and thromboxane B 2. Running buffer solutions were prepared by dissolving various SDS concentrations (10-100 mM) in a borax-NaOH buffer solution of pH 10.0. The borax-NaOH buffer solution was prepared by mixing appropriate amounts of 0.1 M borax and 0.1 M NaOH. Deionized water was used for preparing the buffer and sample solutions.
The pre-treatment of human seminal samples followed the procedure of previous study with slight modifications [9]. Fresh human seminal fluid from a healthy man was mixed with isopropanol (1:1, v/v) and stored at -20°C to await analysis. The mixture
Y.-Z. Hsieh, K.-L. Kuo / J. Chromatogr. A 761 (I997) 2 7 7 - 2 8 4 279
was centrifuged at 14 000 rpm. The supernatant was then filtered through a 0.22-txm filter. HC1 (0.1 M) was added to the filtered solution until the solution reached pH 3. The acidified solution was applied to a C~s cartridge, which was washed with 3 ml water and 3 ml hexane. A sample was then eluted with 3 ml methyl acetate. The eluted solution was concen- trated to 300 Ixl for sample injection. The spiked sample was prepared by adding the standards of prostaglandins and thromboxane B 2 into the seminal fluid mixed with isopropanol. The spiked sample followed the same extraction procedure to prepare the sample for direct injection.
3. Results and discussion
Fig. 1 illustrates the molecular structures of seven major prostaglandins and thromboxane B 2. Their molecular masses are similar. Similar to prostaglan- dins A 2 and B 2, prostaglandins D e and E 2 are structural isomers as well. The difference between
O O
COOH ~"~J'~'~'~COOH
• / O H O H P r o s t a g ] a n ~ r l A 2 P r o s t a g l a n d i n B2 OH 0 ~" . . . . H , , , , \ ~ C O O H OH OH P r o s t a g l a n d i n D2 P r o s t a g l a n d i n E1 OH ° ttO.. ~ ~ v v v H (~H O H P r o s t a g l a n d l n F~ P r o s t a g l a n d i n Fl,~ OH OH H~ oH ~n P r o s t a g l a n d i n F2a T h r o m b o x a n e B~ Fig. I. Molecular structures of seven major prostaglandins and thromboxane B 2.prostaglandins E l and E 2 lies in only one double bond at the long carbon chain. A similar difference is observed between prostaglandins F~,~ and F2~. Thromboxane B 2 differs from prostaglandins F2, in that the prostaglandin's cyclopentane ring changes to thromboxane's tetrahydropyran ring with an extra oxygen atom. The fact that these compounds are quite similar poses a challenging separation task. The UV-Vis absorbance spectra of prostaglandins indi- cated that these compounds had different maximum absorption wavelengths. Nevertheless, most of the maximum absorbances were around 200 nm. There- fore, the detection wavelength was set at 200 nm.
Because prostaglandins are not stable in a high polar solvent, selecting an adequate low polar sol- vent to dissolve and preserve prostaglandins is critical. However, the running buffer for MEKC is usually an aqueous solution, thereby allowing the high polar solvent to more easily mix in the buffer solution. Therefore, a solvent with the proper solu- bility and stability for sampling must be selected. Preliminary findings indicated that isopropanol was the most appropriate solvent for dissolving and storing prostaglandins at -20°C.
The composition of the buffer solution is a critical aspect of successfully performing capillary electro- phoresis analysis. Therefore, a preliminary study was undertaken herein in which buffers with various compositions and pH values (from 7.0 to 10.0) were tested. Because the analytes' mobilities were found to be similar to each other, they could not be separated by various buffers. Thus, the running buffer must be modified to separate the analytes. The pH 10.0 borax-NaOH buffer was selected as the running buffer for further investigation because its separation efficiency was the best among those buffers.
3. I. Effects of SDS and electrolytes on separation
SDS is the conventional micelle serving as a pseudostationary phase in the MEKC running buffer. Thus, a borax-NaOH buffer (pH 10.0) combined with SDS was selected as the running buffer in the present study. Fig. 2 displays the effects of various SDS concentrations (up to 100 mM) on the migration behaviors of the prostaglandins and thromboxane B 2. According to those results, the electroosmotic flow
12 l0 .z- g g E g "~ 6 ..~ i i 20 40 60 80 100 120 SDS Concentration (mM) 8 3 2 0 80
Fig. 2. Effects of SDS concentration on the migration time of prostaglandins and thromboxane B 2. I=thromboxane B~; 2= prostaglandin E2; 3=prostaglandin Dz; 4=prostaglandin Et; 5= prostaglandin F~; 6=prostaglandin F2,; 7=prostaglandin As; 8=prostaglandin B 2. Conditions: separation solution, SDS in borax-NaOH buffer, pH 10.0; capillary, 47 cm (40 cm to the detector)x50 txm I.D., applied voltage, 20 kV; detection wave- length, 200 nm; pressure injection, 3 s; column temperature, 30°C.
did not significantly change over the entire SDS concentration range. However, with an increasing in the SDS concentration, the analytes' velocities de- creased, which further enlarged the differences in the migration times o f the analytes. The enhanced res- olution can be explained by the fact that a higher SDS concentration provides the analytes with a higher likelihood of interacting with the SDS mi- celles. Fig. 2 reveals that the analytes began separat- ing after 10 mM SDS was added to the borate running buffer. The resolutions among these com- pounds, particularly for prostaglandins D 2 and E l, became satisfactory when the SDS concentration reached 50 mM. Therefore, 50 m M SDS was used for subsequent prostaglandin analysis.
The migration times of prostaglandins A : and B 2 were longer than those of the other six analytes because they interacted more strongly with the SDS pseudostationary phase. The stronger interactions are due to the fact that either prostaglandin A 2 or prostaglandin B 2 has only one hydroxyl functional group. Thus, those two analytes are more hydro- phobic than the other analytes. The solubilities of
10
E- g
o=
i i i i i
20 40 60
Electrolyte Concentration (raM)
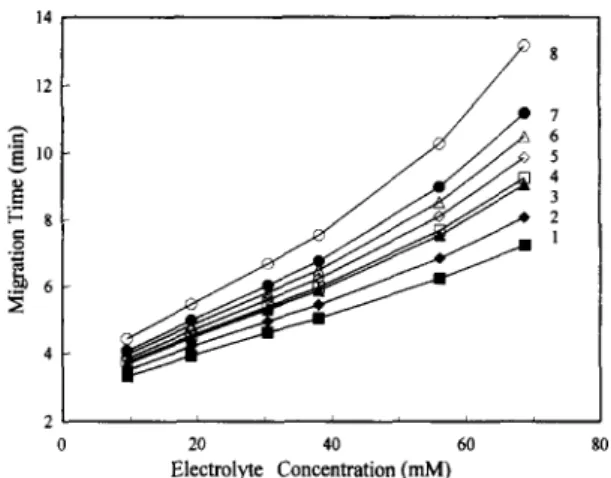
Fig. 3. Effects of electrolyte concentration on the migration time of prostaglandins and thromboxane B 2. Conditions: separation solution, 50 mM SDS in borax-NaOH buffer, electrolytes con- centrations from 9.5 mM to 68.7 mM. Other conditions as in Fig. 2.
prostaglandins A 2 and B 2 in the aqueous phase were also lower than those of the other analytes, thereby causing these two compounds to distribute more easily in the SDS pseudostationary phase.
Fig. 3 depicts the effects of the electrolytes concentration on the separation of prostaglandins and thromboxane B 2 with SDS maintained at 50 mM. The electrolytes included borax and sodium hydrox- ide in the running buffer. Consistent with previous findings [12,13], the migration times of the analytes increased as the electrolytes concentration was in- creased. This phenomenon can be accounted for by the fact that the electroosmotic flow decreases with an increase in the electrolytes concentration, thereby leading to a slower migration velocities of the analytes. At lower electrolytes concentrations, the resolution was inadequate even though SDS was maintained at 50 mM. The baseline separation of the eight analytes was obtained by adding more than 38 m M electrolytes to the buffer. The difference in the migration velocities of the analytes was enhanced as the electrolytes concentration was increased. Conse- quently, higher electrolytes concentration implies a more satisfactory resolution. However, a trade-off arose between the peak resolution and the total analysis time. Therefore, an electrolytes concentra-
Y.-Z. Hsieh, K.-L. Kuo / J. Chromatogr. A 761 (1997) 2 7 7 - 2 8 4 281
tion of 38 mM was found to be the most effective choice.
3.2. Effects of capillary temperature on separation
Fig. 4 illustrates the effects of capillary tempera- ture (from 15°C to 39°C) on the migration times of prostaglandins and thromboxane B 2. As this figure reveals, a higher temperature caused a shorter sepa- ration time. The total analysis time reduced by half as the temperature was changed from 15°C to 39°C. Reduction in the analysis time is probably attributed to the viscosity and the dielectric constant of the medium, both of which alter with a changing tem- perature. Moreover, the resolution between prosta- glandins D 2 and E~ increased with a rise in tempera- ture. The resolution became greater than 1.0 when the temperature exceeded 20°C and reached 1.7 at 39°C.
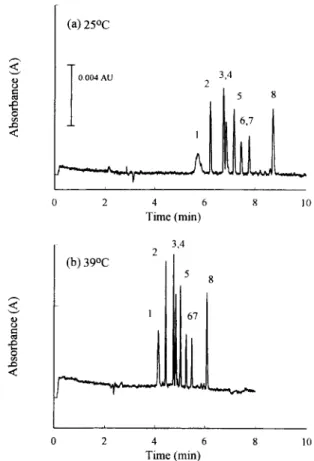
Fig. 5 presents the electropherograms of the eight analytes at two different capillary temperatures. For each analyte, the separation efficiency was always better at a higher temperature (39°C) than at a lower temperature (25°C). This phenomenon may result from the exchange between the free SDS monomer and the SDS monomer in micelles. A previous study suggested that temperature influences the exchange
< e-, < (a) 25oc 0 0 0 4 A U 2 3 , 4 5 8 2 4 6 8 10 Time (min) < o~ < (b) 39°C 3,4 5 8 i i 2 4 6 8 10 Time (min)
Fig. 5. Separation of prostaglandins and thromboxane B: at different capillary temperatures, (a) 25°C (b) 39°C. Other con- ditions as in Fig. 4. 8 10 7 ~" 6 "- 5 4 • - N 6 4 lO 20 30 40 Capillary "Femperature (°C)
Fig. 4. Effects of capillary temperature on the migration time of prostaglandins and t h r o m b o x a n e B 2. Conditions: separation solu- tion, 50 m M SDS in 0.038 M b o r a x - N a O H buffer; temperature, f r o m 15°C to 39°C. Other conditions as in Fig. 2.
rate which further determines the micelles' migration rates [16]. More specifically, the exchange rate increases with an increase in the separation tempera- ture and a rapid exchange rate generates a narrow range of the micelles' migration velocities which may subsequently produce a narrow peak. Conse- quently, the separation efficiency can be improved by increasing the temperature of the separation capillary. However, maintaining a stable high tem- perature is difficult if it is much higher than the room temperature. Therefore, 30°C was selected for prosta- glandin analysis.
As Fig. 5 indicates, the peak of thromboxane B~ was unexpectedly broadened when the separation temperature fell below 25°C. The broad peak is
< 8 I 0.0025 AU 3,4 5 8 67 1
. J
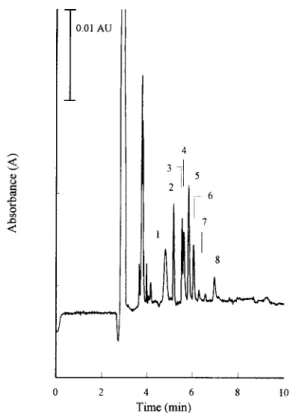
I i I 0 2 4 6 8 10 Time (min)Fig. 6. Separation of prostaglandins and thromboxane B 2. Con- ditions: separation solution, 50 mM SDS in 0.038 M borax-NaOH buffer; concentration of each analyte, 125 ng/Ixl. Other conditions as in Fig. 2.
probably due to thromboxane's tetrahydropyran ring which causes it to be more hydrophillic than the other analytes. The tetrahydropyran ring may also cause thromboxane B 2 to interact more strongly with the capillary wall, thereby leading to a broader peak.
Further investigations are necessary to verify the above conjecture.
3.3. Optimum conditions for separation and determination
Fig. 6 depicts the optimum separation of seven prostaglandins and thromboxane B 2 with a 38 mM borate buffer containing 50 mM SDS at 30°C. As this figure reveals, the analysis of these compounds can be completed within 8 min. Table 1 lists the migration times, reproducibilities and the theoretical plate numbers of the prostaglandins in optimum conditions. The relative standard deviations of the migration times were less than 0.82%. In a 40 cm capillary column, the number of theoretical plates ranged from 72 000 to 119 000 except for thrombox- ane B 2. The limits of detection of the analytes in optimum conditions ranged from 6.5 to 22.5 pg. In optimum conditions, prostaglandins A 2 and B 2 could be separated completely even if they are isomers. Although the difference between prostaglandins E l and E 2 is only one double bond at the long carbon chain, a satisfactory resolution was achieved. Similar results were also obtained for prostaglandins F ~ and
F2~.
As buffer composition plays a prominent role in this study, methanol was added to the running buffer to investigate its influence on separation. Fig. 7 presents the separation of prostaglandins by using 5% and 10% of methanol in the running buffer. As revealed by this figure, methanol did not significantly contribute to resolution. In contrast, methanol in- creased the analysis time. The velocity of the electro-
Table 1
Average migration time, reproducibilty and separation efficiency of the prostaglandins and thromboxane B:
Compound Migration time R.S.D. Number of (min) a (%) theoretical plates (N) Thromboxane B 2 5.06 0.51 7000 Prostaglandin E 2 5.46 0.70 75 000 Prostaglandin D 2 5.90 0.72 119 000 Prostaglandin E~ 5.99 0.73 96 000 Prostaglandin F2, 6.25 0.74 89 000 Prostaglandin F,~ 6.51 0.75 90 000 Prostaglandin A 2 6.78 0.76 110 000 Prostaglandin B z 7.56 0.82 72 000 n=30.
Y.-Z. Hsieh, K.-L. Kuo / J. Chromatogr. A 761 (1997) 2 7 7 - 2 8 4 283 g o < (a) 5% MeOH
I
0.002 AU ] 3,4 5 8 3 6 Time (min) 9 12 < oo < (b) 10% MeOH i 3 6 Time (rain) 3,4 2 8 5L
i 9 12Fig. 7. Separation of prostaglandins and thromboxane B 2 at different methanol concentrations in the separation solution, (a) 5% methanol, (b) 10% methanol. Other conditions as in Fig. 6.
osmotic flow decreased as the amount o f methanol in the running buffer was increased. Moreover, adding methanol to the running buffer also changed the viscosity and the dielectric constant o f the buffer. From the above results, we can infer that these phenomena caused the migration velocities of the analytes to decrease.
A human seminal fluid sample was spiked with prostaglandins and thromboxane B 2. The analytes were then extracted by a modified solid-phase ex- traction method [9], which allowed certain interfer- ing c o m p o u n d s in human seminal fluid to be re- moved, such as proteins and lipids. The extracted analytes could then be determined by the M E K C method. The recoveries of the spiked analytes were higher than 73% except those o f prostaglandins B 2 and A 2. Fig. 8 illustrates the determination o f the prostaglandins and thromboxane B 2 spiked in human
< 0.01 A U 3 2 1 5 6 7
I
8 I I I I 0 2 4 6 8 10 Time (min)Fig. 8. Separation of prostaglandins and thromboxane B 2 spiked in human seminal fluid. Conditions as in Fig. 6.
seminal fluid. All the analytes were clearly identified. Other peaks, which did not interfere with the analyte peaks, appeared in the earlier part of the elec- tropherogram. The entire M E K C analysis was com- pleted within 8 min.
As shown by the comparison between Figs. 8 and 6, the analytes' migration times in the spiked sample (Fig. 8) were shorter than those in the standard sample (Fig. 6). Such a phenomenon can be ac- counted for by the fact that the spiked sample was dissolved in methyl acetate instead of the buffer. Using methyl acetate in the spiked sample was deemed necessary to extract analytes. According to field amplification o f CE, a s a m p l e ' s matrix can affect the local electrical field strength during sepa- ration [17,18]. Thus, two different matrix systems for injected samples can result in different analyte migration velocities, if the two matrix systems have different conductivities. In this study, methyl acetate has an extremely low conductivity compared with the buffer used for the standard sample, thereby
leading to an increase in local field strength, which further increases analyte migration velocities. There- fore, the migration times in Fig. 8 were shorter than those in Fig. 6. Because the sample's matrix has a significant effect on the analytes' migration times, further investigations on extraction solvents are necessary.
4. Conclusion
Results in the present study demonstrate that MEKC is a more rapid and efficient separation technique for analyzing seven major prostaglandins and thromboxane B 2 than the conventional RIA and HPLC techniques. The SDS and electrolyte con- centrations heavily influence the resolution. Further- more, capillary temperature significantly affects separation efficiency. Separating prostaglandins by MEKC offers the advantages of high resolution, high separation efficiency and excellent reproducibility. Because the amount of sample required for MEKC analysis is minimal, this method is particularly appropriate for analyzing prostaglandins where the supply for sample is somewhat restricted.
Acknowledgments
This research was supported by Grant NSC 83- 0208-M-009-023 from the National Science Council of Taiwan.
References
[1] D.A. van Dorp, R.K. Beerthuis, D.H. Nugteren and H. Vonkeman, Biochim. Biophys. Acta, 90 (1964) 204. [2] C. Pace-Asciak and E. Granstrom (Editors), Prostaglandins
and Related Substances, Elsevier, Amsterdam, 1983. [3] C.R. Long, Prostaglandins, 40 (1990) 591. [4] L. Wolfe, J. Neuochem., 38 (1982) 1.
[51 M. Hamberg, J. Svensson and B. Samuelsson, Proc. Natl. Acad. Sci. USA, 72 (1975) 2994.
[6] R.A. Lewis, J.-M. Mencia-Huerta, R.J. Soberman, D. Hoover, A. Marfat, E.J. Corey and K.F. Austen, Proc. Natl. Acad. Sci. USA, 79 (1982) 7904.
[7] F.A. Fitzpatrick, Anal. Chem., 48 (1976) 499. [8] E.H. Oliw, J. Chromatogr., 421 (1987) 117.
[9] J. Doehl and T. Greibrokk, J. Chromatogr., 529 (1990) 21. [10] A. Terragno, R. Rydzik and N.A. Terragno, Prostaglandins,
21 (1981) 101.
[11] S. Terabe, K. Otsuka and T. Ando, Anal. Chem., 57 (1985) 834.
[12] S.F.Y. Li, Capillary Electrophoresis, Elsevier, Amsterdam, 1993.
[13] F. Foret, L. Kriv~inkov~i and P. Bocek, Capillary Zone Electrophoresis, VCH, Weinheim, 1993.
[14] N.A. Guzman (Editor), Capillary Electrophoresis Technolo- gy, Marcel Dekker, New York, 1993.
[15] H. Nishi, T. Fukuyama, M. Matsuo and S. Terabe, J. Chromatogr., 513 (1990) 279.
[16] M.J. Sepaniak, A.C. Powell, D.F. Swaile and R.O. Cole, in P.D. Grossman and J.C. Colburn (Editors), Capillary Electro- phoresis, Academic Press, San Diego, CA, 1992, Ch. 6, p.
159.
[17] R.-L. Chien and J.C. Helmer, Anal. Chem., 63 (1991) 1354. [18] R.-L. Chien and D.S. Burgi, Anal. Chem., 64 (1992) 489A.