The Impact of Non-performing Loans on the Efficiency of Japanese Banking Industry
I. Introduction and Literature Review
The Japanese banking industry has been in a plague for a long time since 1990s. The problem of non-performing loans started to aggravate banks in the post-bubble economy and has become a huge liability, with the total burden for banks estimated to be anything from US$350 billion to US$600 billion (Fujii, 2003). An unwanted inheritance from the bubble economy, the bad loan problem is a tough task for Japan as businesses that had previously borrowed money were no longer able to pay back. Although numerous solutions have been discussed, Japan has still been in difficulty to pursue a fundamental decision for the bad-loan problem, and one main explanation is that taking harsh measures may make the overall economic situation worse rather than better by causing more bankruptcies and increased unemployment.
Under the huge pressures from domestic investors and overseas, the Japanese banking industry is currently experiencing a phase of significant structural change and consolidation. The wave of mergers has been across both segments of banking and financial markets and across the traditional keiretsu structures. Starting from August 1999, the Industrial Bank of Japan, Dai-Ichi Kangyo Bank and Fuji Bank were
merged together, with all three banks being the keiretsu banks. The single holding company (Mizuho) accounts for around 25% of the Japanese retail and corporate banking market. Mergers have also been announced between Sumitomo Bank and Sakura Bank, and between Sanwa Bank and Tokai Bank, with all four banks
belonging to keiretsu groups. The long-lasting reciprocal shareholding and the main bank system have been seriously challenged, and hopefully improved in this
restructuring process.
This paper uses the nonparametric frontier approach, data envelopment analysis (DEA) to examine the impact of non-performing loans on the efficiency of Japanese banking.
II. Purpose
This paper tries to address the following issues. We first examine the efficiency movement of the Japanese city banks in the period of 1997 to 2003. An answer to this question provides a clear picture on the development of Japanese banking industry in recent years. Our results can shed lights on the effects of policy regulation in Japanese banking as these giant commercial banks have been
undergoing joint ventures and mergers mostly required by government. We also examine the impact of non-performing loans on the efficiency movement. Although the Japanese government has been aware of necessity of settling the NPL problem, it
has hesitated to do so as the announcement of Big Bang deregulation plunged the 1996 Tokyo stock market into the doldrums (Foo, 2003). Has the steady but
somewhat slow settlement of non-performing loans worked since 1996? What is the magnitude of the NPLs impact on the bank efficiency throughout recent years? Our results provide evidence to the suitability of Japanese regulation for the resolution process of non-performing loans in these years.
III. Data and Methodology
The data source is acquired from the Pacific Basin Capital Markets (PACAP) database from 1997 through 2003. We also use various issues of the Japanese Company Handbook published by Toyo Keizai Inc. as references. We use DEA methodology to measure outputs and inputs, and we model a bank’s activities within a five-input, two-output production framework. Following recent banking literature (see Aly et al (1990), Elyasiani and Mehdian (1992) and Fukuyama (1993)), we measure our outputs by adopting the intermediation approach, which treats banks as financial intermediaries.
To evaluate the impact of non-performing loans on the efficiency of our sample banks, we add an additional input of the problem loan to the DEA analysis and use provisions for loan losses as the proxy of non-performing loans. As Berger and Humphrey (1997) and Drake and Hall (2003) suggested, it is very difficult to evaluate whether the effect of non-performing loans is endogenous or exogenous. Therefore, we try to treat non-performing loans in two different ways: one way is to treat it as an input if we regard it as endogenous and the other way is to treat it as an uncontrollable input when it is exogenous. We compare the results later to see how our results differ.
IV. Results and Conclusion
Table 1 applies the five-input, two-output framework to examine the efficiency performances of full sample, and further segregates the full sample into city banks and regional banks. Our results in Table 1 show that the technical efficiency of the full sample is 0.879, implying that approximately 12% of the inputs have been wasted when producing. Besides, the pure technical efficiency score is 0.907, resulting in a score of 0.97 for scale efficiency. We also find that by segregating our sample into city and regional banks, city banks are more efficient than regional banks in each of our efficiency measures. For example, the technical efficiency is 0.966 for city banks, higher than 0.87 for regional banks. Among all three efficiency measures, both city and regional banks have the highest scale efficiency scores, than pure technical efficiency and than technical efficiency.
[Table 1 about here]
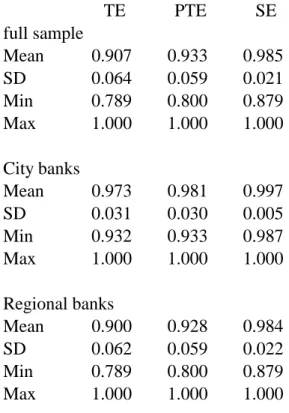
examine the efficiency performances of the Japanese banks and present our results in Table 2. We find that the technical efficiency score of the full sample is 0.907, slightly higher than the score of the full sample in Table 1. Besides, the pure
technical efficiency score and scale efficiency score of the full sample are also higher than the comparable scores in Table 1. When we further segregate the sample into city and regional banks, we still find that city banks are more efficient than regional banks in each of our efficiency measures, though all the scores in Table 2 are higher than the scores in Table 1.
[Table 2 about here]
The results in Table 2 are based on the assumption that problem loans can be controlled by managers. However, as we explained above, problem loans may be endogenous or exogenous. We treat problem loans as an uncontrollable input to analyze the efficiency of the Japanese banks and present the results in Table 3. Consistent with our results in Table 1 and 2, we find that scale efficiency scores for each set of banks are still higher than pure technical efficiency, and all the three efficiency scores are still higher for city banks than for regional banks. In summary, the results of Table 3 are generally consistent with the results of Table 2 except that each of the score in Table 3 is slightly higher than the score in Table 2.
[Table 3 about here]
We summarize the results of our three tables as following. First, our results show that most of the Japanese banks have reached (or are very close to) full scale efficiency. For example, in Table 3, the scale efficiency score of city banks is 0.998, with the minimal score equals to 0.984. However, their pure technical efficiency scores are lower than scale efficiency scores, implying that the Japanese banks have not been technically-efficient as scale-efficient. This is in fact consistent with our understanding. The Japanese banks have been merged to pursue better performance and efficiency, and almost all city banks belong to only four huge holding companies. From this point of view, the mergers among banks seem successful because the scale of the banks seems to reach full efficiency. However, the (pure) technical efficiency for these banks is not as good as the scale efficiency, implying that there is still room to improve for the Japanese banks as their management ability is not optimal even after the merger. Second, city banks are always more efficient than regional banks either in technical efficiency or in scale efficiency. Third, our efficiency results show that bank performance is the best when we treat bad loans as an uncontrollable input, followed by the case when bad loans are treated as a controllable input, and followed by the case when bad loans are not considered in the analysis. In other words, bank performance is the best when we suggest that bad loan problem is outside of management control, then followed by controlled by managers, then finally not
considered. V. 計畫結果自評部分 本文研究了自 1997 到 2003 年間不良債權對日本銀行業的影響,並利用資料 包絡分析法來討論日本城市銀行和地區銀行的運作效率。就日本銀行業自 1996 年的「金融大改革」(Big Bang) 後經歷了一連串結構性的改變,本文發現其規模 效率表現極佳,但技術效率相對較差。此外,本文也深入研究不良債權對日本銀 行的影響,並發現若考慮不良債權為一外生變數時,銀行的效率表現最佳。本研 究可對相關日本銀行業文獻提出最新的觀點及對不良債權在效率分析上的處理 提出建議,並將於近期內投稿至適合的學術期刊發表,相信未來發表的機會和價 值極高。
Table 1 DEA Efficiency Results of the Japanese Banks
TE PTE SE full sample Mean 0.879 0.907 0.970 SD 0.067 0.064 0.035 Min 0.741 0.789 0.808 Max 1.000 1.000 1.000 City banks Mean 0.966 0.973 0.993 SD 0.029 0.031 0.015 Min 0.930 0.932 0.958 Max 1.000 1.000 1.000 Regional banks Mean 0.870 0.900 0.968 SD 0.064 0.062 0.035 Min 0.741 0.789 0.808 Max 1.000 1.000 1.000
Table 2 DEA Efficiency Results of the Japanese Banks with NPL Effect TE PTE SE full sample Mean 0.907 0.933 0.985 SD 0.064 0.059 0.021 Min 0.789 0.800 0.879 Max 1.000 1.000 1.000 City banks Mean 0.973 0.981 0.997 SD 0.031 0.030 0.005 Min 0.932 0.933 0.987 Max 1.000 1.000 1.000 Regional banks Mean 0.900 0.928 0.984 SD 0.062 0.059 0.022 Min 0.789 0.800 0.879 Max 1.000 1.000 1.000
Table 3 DEA Efficiency Results of the Japanese Banks with NPL Effect as Uncontrollable Input
TE PTE SE full sample Mean 0.933 0.947 0.985 SD 0.059 0.057 0.022 Min 0.802 0.830 0.875 Max 1.000 1.000 1.000 City banks Mean 0.988 0.990 0.998 SD 0.024 0.024 0.006 Min 0.935 0.936 0.984 Max 1.000 1.000 1.000 Regional banks Mean 0.927 0.947 0.984 SD 0.058 0.057 0.022 Min 0.802 0.830 0.875 Max 1.000 1.000 1.000
References
Altunbas, Y., Liu, M-H., Molyneux, P., Seth, R., 2000, “Efficiency and Risk in Japanese Banking,” Journal of Banking and Finance 24: 1605-1628.
Aly, H. Y., R. Grabowski, C. Pasurka, and N. Rangan, 1990, “Technical, Scale, and Allocative Efficiencies in U.S. Banking: An Empirical Investigation,” Review of
Economics and Statistics 72: 211-218.
Berger, Allen N., Hanweck, Gerald A., and Humphrey, David B, 1987, “Competitive Viability in Banking: Scale, Scope, and Product Mix Economies,” Journal of
Monetary Economics 20: 501-520.
Berger, Allen N., Humphrey, David B., 1997, “Efficiency of Financial Institutions: International Survey Directions for Future Research,” European Journal of
Operational Research 98: 175-212.
Cummins, J David, Weiss, Mary A, Zi, Hongmin, 1999, “Organizational form and efficiency: The coexistence of stock and mutual property-liability insurers,”
Management Science 45: 1254-1269.
Drake, L. and Hall, Maximilian J.B., 2003,”Efficiency in Japanese Banking: An Empirical Analysis,” Journal of Banking and Finance 27: 891-917.
Elyasiani, E. and S. Mehdian, 1992, “Productive Efficiency Performance of Minority and Nonminority-owned banks: A Nonparametric Approach,” Journal of Banking and
Finance 16: 933-948.
Färe, R., S. Grosskopf, and C. A. K. Lovell, 1985. The Measurement of Efficiency of
Production. (Boston: Kluwer-Nijhoff).
Färe, R., Grosskopf, S., 1992, “Malmquist Productivity Indexes and Fisher Ideal Indexes,” The Economic Journal 102: 158-175.
Färe, R., S. Grosskopf, M. Norris and Z. Zhang, 1994,”Productivity Growth, Technical Progress, and Efficiency Change in Industrialized Countries,” American
Farrell, M. J., 1957, “The Measurement of Productive Efficiency,” Journal of the
Royal Statistical Society 120: 253-281.
Ferrier, Gary D. and Lovell, C. A. Knox, 1990, “Measuring Cost Efficiency in
Banking: Econometric and Linear Programming Evidence,” Journal of Econometrics 46: 229-245.
Foo, Jennifer, 2003, “Restructuring Japan’s Banking Sector to Avoid a Financial Crisis,” Journal of American Academy of Business 3: 326-335.
Fujji, Rina, 2003, “Breaking the Bank: Japan’s Bad Loans,” Harvard International
Review 25: 14-19.
Fukuyama, Hirofumi, 1993, ”Technical and Scale Efficiency of Japanese Commercial Banks: a Non-Parametric Approach,” Applied Economics 25, 1101-1112.
Fukuyama, Hirofumi and Weber, William L., 2002, “Estimating Output Allocative Efficiency and Productivity Change: Application to Japanese Banks,” European
Journal of Operational Research 137: 177-190.
Jeng, Vivian S.C., 2004, “Business Structure, Keiretsu, Efficiency and Productivity: An Analysis of Japanese Commercial Banking,” Working Paper, National ChengChi University, Taipei, Taiwan.
Jeng, Vivian S.C., and Lai, Gene C., forthcoming, “Ownership Structure, Agency Costs, Specialization and Efficiency: Analysis of Keiretsu and Independent Insurers in the Japanese Non-life Insurance Industry,” Journal of Risk and Insurance.
Kasuya, M., 1986, “ Empirical Analysis of Cost Structure in Banking: Efficiency, Technical Change, Factor Substitution and Organizational Status,” Kinyu Kenkyu, 8, 79-118 (in Japanese).
Kolari, James and Zardkoohi, Asghar, 1991, “Further Evidence on Economies of Scale and Scope in Commercial Banking,” Quarterly Journal of Business and
Economics 30: 82-107.
Estadistica 4, 209-224.
McKillop, D.G., Glass, J.C., Morikawa, Y., 1996, “The Composite Cost Function and Efficiency in Giant Japanese Banks,” Journal of Banking and Finance 20, 1651-1671.
Pulley, L.B., Braunstein, Y.M., 1992, “A Composite Cost Function for Multiproduct Firms with an Application to Economics of Scope in Banking,” Review of Economics
and Statistics 74: 221-230.
Rangan, Nanda, Zardkoohi, Asghar, Kolari, James and Fraser, Donald, 1989,“ Production Costs for Consolidated Multibank Holding Companies Compared to One-Bank Organizational Forms,” Journal of Economics and Business 41: 317-325.
Sherman, H. David and Gold, Franklin, 1985, “Bank Branch Operating Efficiency: Evaluation with Data Envelopment Analysis,” Journal of Banking & Finance 9: 297-315.
![TraditionalMLCalgorithmsmainlytacklethebatchMLCproblem,wheretheinputdataarepresentedinabatch[24,28].Nevertheless,inmanyMLCapplicationssuchase-mailcategorization[22],multi-labelexamplesarriveasastream.Onlineanalysisistherefore dimensionreducermotivatedbyma](data:image/gif;base64,R0lGODlhAQABAIAAAP///wAAACH5BAEAAAAALAAAAAABAAEAAAICRAEAOw==)