The 9th Asian Real Estate Society (AsRES) International Conference
Appraisal Behavior on Market Comparison Approach
in Taiwan
Ying-Hui Chiang * & Chin-Oh Chang**
Abstract
This research examines the appraisers’ appraisal behavior when they use market comparison approach in Taiwan. The empirical evidences indicate that firstly, the average auction value is lower than the average market value by 28.49%. Secondly, the appraisers do not adjust the values of target property on the basis of each characteristic of their selecting comparable cases. Thirdly, the appraisers intend more to measure each characteristic of the comparable properties while determining the NPAs value compared to general property value.
Key Words: appraisal behavior, market comparison approach, non-performing asset
.
* Ph.D Student , Department of Land Economics ,National Chengchi University, Taipei, Taiwan.
E-mail:yinghui@nccu.edu.tw
Address: 64, Sec. 2,Zhi-nan Rd., Wenshan, Taipei 116, Taiwan, Republic of China
** Professor, Department of Land Economics ,National Chengchi University, Taipei, Taiwan.
E-mail:jachang@nccu.edu.tw
Appraisal Behavior on Market Comparison Approach
in Taiwan
1. Introduction
The Appraisal Institute (2001) defines the eight-step real estate valuation process in its published book, The Appraisal of Real Estate, 12th Edition. The valuation process is a normative model to guide appraisers how to value. However, numerous studies have observed that expert appraisers do not follow the normative process.
Graaskamp (1991) argues that the discipline of real estate is an applied social science. Diaz (1990a) found that appraisers’ actual valuation behaviors often depart from the normative appraisal model. Moreover, Diaz (1990b), Wolverton (1996), Wolverton and Gallimore (1977) examine the behavior issues on appraisers’ selecting comparable sales by the controlled experiments.
Researches on real estate appraisal mostly adopt a standard orientation; that is, to attempt to establish some criteria for conducting appraisals, but neglect the reality of how appraisals are performed. Diaz (1990a) shows that expert appraisers do not rigidly follow the normative appraisal model, and proposes an initial descriptive model. Diaz (1990b) notes that researches on real estate appraisal had not discussed appraisers’ choice of information acquisition behavior in the market comparison approach. These findings demonstrate that the search strategy of expert appraisers differs from that of novices in terms of nature and amount of data examined. Namely, experts prefer to use screening strategies and examine less data than novices do.
Wolverton (1996) finds that the residential appraisers’ prior sale price knowledge results in their comparable sales selection bias. Gallimore et al. (1997) observes that the English appraisers are highly susceptible to sale price knowledge, but exhibit sales selection bias to a lesser degree than American appraisers on residential appraisal.
The Appraisal Institute asked the question of “… how applicable the normative valuation model is to actual appraisal assignments, how well it analyzes the forces that affect value T, and how accurately it interprets the actions and motivations of market participants.”1 Many observations on the appraisal process show that appraisers’ behavior pattern affects the estimated value and exists experience bias.
The real estate appraisal industry has been developing for near 40 years in Taiwan. The unqualified real estate appraisers could take appraisal tasks only until the time before Legislative Yuan’s passing “the real estate appraiser law”2, Oct, 2000.
There exist three main approaches to real estate appraisal: the cost approach, the market comparison approach, and the income capitalization approach. However, the Taiwanese real estate appraisers frequently adopt the market comparison approach for determining value. Owing to the standard cost frequently being below the actual cost, the real property prices are higher than the values based on the cost approach. Similarly, because rental incomes from properties are often underestimated, the prices are also higher than the estimate values based on the income approach.
The core process of market comparison approach is to compare sale prices paid for similar properties, ask prices by owners, and offer prices by prospective purchasers or
.
1 The Appraisal of Real Estate 11th Edition. Chicago, IL: Appraisal Institute, 1996, p.80.
tenants. The key principle of the market comparison approach is “substitution”. This study attempts to analyze the gaps between the normative valuation model and the Taiwanese appraisers’ practical behavior.
This work uses hedonic pricing model to examine the differences between the appraisers’ estimated values and their selecting comparable sale/auction price from appraisal reports. We try to test the following hypotheses: when the appraisers conduct the market comparison approach, the hedonic price coefficients in the valuation model should be same as those in the comparable sale/auction price model.
This paper is organized as follows. Section 2 presents the empirical framework and methodology of this investigation. Section 3 describes the results. Finally, Section 4 summarizes the main findings.
2. Empirical Framework and Methodology
The market value for the appraised property is determined by adjusting the sale prices of comparable properties (up or down) to a dollar amount which is an indication of the effect of the differences on the market value of that property. This procedure produces an indication of value within a bracket range (to indicate value), rather than a precise figure. Such an indication is accurate in cases with sufficient comparable data.
From the discussion above, appraisers’ behavior generally do not follow the normative appraisal process. This study uses hedonic pricing model to examine the differences between the appraisers’ estimated values and their selecting comparable sale/auction price from appraisal reports. Then this work analyses the appraisers’ behavior pattern based on our empirical results and reasoning.
This paper examines the following three hypotheses: Hypothesis 1:
The reason why estimated values between NPAs properties and general properties with the same characteristics are different is because market mechanism variable matters.
Hypothesis 2:
When the appraisers use the market comparison approach for the appraisal, the importance level of each characteristic of the estimated property to the value should be consistent with that of the comparison property to the price.
Hypothesis 3:
Because the appraisal process of the NPAs is similar to the mass appraisal method, the appraisers intend to measure each characteristic of the comparable properties while determining the target property value.
The hedonic pricing model is used to value real assets and views those assets as a bundle of characteristics, each of which provides either utility or disutility to consumers. It is often used to estimate values of the properties based on their characteristics such as size of dwelling, number of bedrooms, location, number of bathrooms, etc. In the model, the coefficient estimates represent the implicit prices of the characteristics.3
Based on hedonic pricing model, this research model is: log Yi = α+βiXi+γZi+ε
.
Where,
Yi denotes the property price
Xi represents continuous characteristic, including building area and age
Zi is the dummy characteristic, including location, property use type, floor, floor
number and market mechanism (auction) ε is the error term
This work examines the variables that the influences on property price. The results of the semi-log model estimated is including the model of fitting information, coefficient, and t-ratios. Additionally, this study joins the market variable (sale or auction market) for discussing the factor which results in a price difference between the NPAs and normal properties.
To examine the above hypotheses, the variables as explanatory variables are discussed as follows:
1. Location
Lusht (1996), Lin et al.(1996), Frew and Jud (2003) find location is the most important factor for the real estate pricing. Location is defined as a dummy variable. If the property is located in Taipei, the dummy value is 1; otherwise, 0.
2. Property use type
Lin (1992) and Chen (1998) show that property use type strongly affects real estate prices. Commercial properties are generally more expensive than non-commercial properties. For this reason, the samples will be divided into two groups, namely pure commercial buildings and mixed-use or residential buildings. If the sample is commercial building, the dummy value is 1; otherwise, 0.
3. Floor (First floor)
Lin(1996) observes that floor exerts a conic section influence on property prices, and price increases with floor number. However, first floor is typically the most expensive floor in a building owing to its commercial potential. Therefore, this study sets a dummy variable for floor number. If the property is on the first floor, this dummy value is 1; otherwise, 0.
4. Total floor numbers
Lee (1999) finds that the property price of the high-rises building is generally higher than that of the low-rises because of the construction cost. This work separates the samples into two groups, namely those with total floor number exceeding 13 floors and those with total floor number below 13 floors. A dummy value is set to 1 for 13th floors and above; otherwise, 0.
5. Floor area (pings)
Lin (1992), Chang and Liu (1992), Lin (1996), Tsai (1997) find that floor area is the critical variable in the real estate pricing model. Lusht(1996)、Quan(2002)、Frew and Jud (2003) also find that floor area significantly affects real estate prices. The floor area is served as a continuous variable. It is expected that prices will increase with the individual property floor area.
Tsai (1997), Dotzour, Moorhead & Winkler(1998), Frew & Jud (2003) find that property price decreases with building age. The age of building is a continuous variable.
3. Empirical Results
To explore potential cognitive dissonance for appraisers, we design this study based on appraisers’ appraisal reports to compare their valuation behaviors by examining properties attributes and hedonic prices. Our samples come from some appraisal firms which serve banks and asset management companies to value NPAs efficiently; therefore, each target property is appraised both fair market value and auction value based on some true comparable sale/auction cases investigated. Then, we divide all of the samples into four groups: the estimated market value cases, the estimated auction value cases, the comparable market price cases, and the comparable auction price cases.
Firstly we establish the sale market value model (model I) and the auction value model (model II). Table 1 shows the estimated results of model I and model II. The adjusted R2 value indicates that 52.96% of the total variability of property estimated
market values about their mean value is explained by the model I. And the adjusted R2 value demonstrates that 52.63% of the total variability of property estimated auction values about their mean value is explained by the model II. The adjusted R2 value indicates that 54.55% of the total variability of property values about their mean value is explained by the whole samples model. For the cross-sectional regression, these are quite high.
Also, location, property use type, and floor area are significant variables at the 0.01% level. The regression F-statistic is 21.83, 21.56, and 39.24. And the regression F-statistic rejects very strongly the null hypothesis that all coefficient values on explanatory variables are zero.
In the market mechanism variable raw of table 1, we find that the average auction value is lower than the average market value by 28.49%. It can be seen that the actual signs of the coefficients are consistent with their expected signs except one (age of building). The coefficient estimates themselves mean the value estimated by Taiwanese appraisers. For instance, the Location value of 1.12 (rounded) shows that, everything else being equal, the property located in Taipei will lead to an average increase in the estimated market value of the property by 1.12%.
In table 1, we also find that the significant variables in the model areⅠ consistent with those in the model . Ⅱ It implies that the same variables affect the estimated market values and the estimated auction values simultaneously. However, what is the key variable making the difference between the market values and the auction values? We add a market variable to test it. From the whole samples model in table 1, it reveals that the estimated coefficient for the variable “market mechanism” is significantly negative sign. It indicates the estimated auction value is below the estimates market value. Also, it implies the average NPAs property values are lower than the general property values.
The empirical evidences support the hypothesis 1. The reason why estimated values between NPAs properties and general properties with the same characteristics are different is because market mechanism variable matters.
Table 1 Estimated results of the hedonic model Explanatory Variable Expected sign Model Ⅰ (market value appraisal case) Model Ⅱ (auction value appraisal case) Whole samples Intercept 14.65567 *** (0) 14.38663*** (0) 14.66358*** (0) Location (located in Taipei) + 1.12445*** (0.35801) 1.08198*** (0.34705) 1.10322*** (0.34998) Property use type
(commercial) + 0.65123*** (0.27463) 0.63203*** (0.26852) 0.64163*** (0.26961) Floor (first floor) + 0.11756 (0.04153) 0.06422 (0.02285) 0.09089 (0.03199) Total floor numbers ( > 13th floors) + 0.27378 (0.11493) 0.30389 * (0.12852) 0.28883 * (0.12082) Floor Area + 0.00193*** (0.46182) 0.00194 *** (0.46802) 0.00194 *** (0.46152) Age of building - 0.01519 (0.07360) 0.01495 (0.07300) 0.01507 (0.07277) Market Mechanism (auction price) - - - -0.28486*** (-0.12039) Obs. 112 112 224 F Value 21.83*** 21.56*** 39.24*** Adj R-Sq 0.5296 0.5263 0.5455 D.W 1.646 1.646 1.642 COLLINOINT 2.42637 2.42637 2.42637
Notes: 1. In ModelⅠ, Y is the market value In Model Ⅱ, Y is the auction value. 2. (Standardized —β) in parentheses; ***, **,* indicates the significance at the
1%, 5% and 10% levels, respectively.
3. In whole samples model, if Y is auction price, the market dummy variable is set to 1.
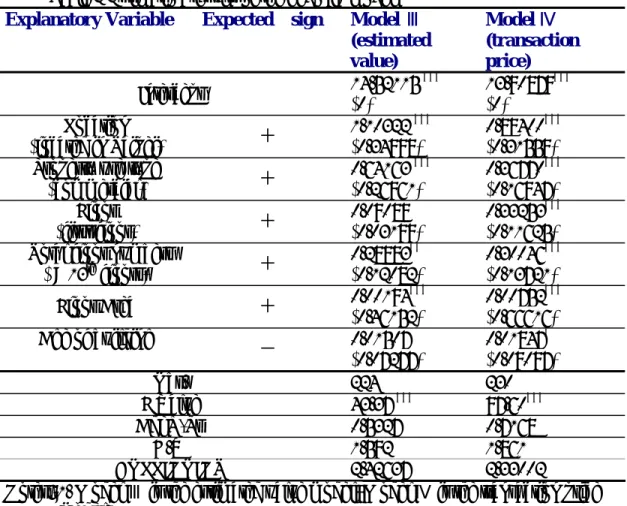
This investigation further analyzes whether the appraisers rely on the comparable characteristics while performing the actual estimate using the market comparison approach. We establish the appraisal cases model (model Ⅲ) on the basis of the
appraisers estimated values. Otherwise, the comparable cases model (model ) is Ⅳ built up based on the transaction prices.
Table 2 shows the estimated results of model Ⅲ and model Ⅳ. The adjusted R2 value indicates that 53.27% of the total variability of property values about their mean value is explained by the model Ⅲ. And the adjusted R2 value indicates that 71.68% of the total variability of property prices about their mean value is explained by the model Ⅳ. It demonstrates that both models have good explanation abilities.
Location, property use type, and floor area variables are significant at the 0.01% level in model Ⅲ. However, all variables except one (age of building) are significant at the 0.01% level in model .Ⅳ The variable “property use type” has a significantly positive impact on the appraisal cases and the comparable cases. As an illustration, the average commercial property value is higher than the average non-commercial property by 89.95%4 in model . Ⅲ And the average commercial property price is higher than the average non-commercial property by 44.44%5 in model Ⅳ.
There are some differences between the two models in view of the beta, the coefficient, and the expected signs. First of all, the number of significant variables in model Ⅳ is large than that in model .Ⅲ For example, the variable “floor” does not affect the estimated values significantly. Secondly, the influence level (β coefficient) of the variables in the two models is different. For example, the β coefficient of the variable “property use type” is 26.96% and 16.94%, respectively. Additionally, the β coefficient
.
4 antilog(+64.16%)-1=+89. 95% 5 antilog (+33.25%)-1=+44.44%
of the variable “floor area” is 46.15% and 66.62%, respectively. It implies the influence level of the same variable differs in the two models.
As stated above, the characteristic influence levels in both the comparable model and the appraisal model are not the same. It implies that the appraisers do not adjust the values of target property on the basis of each characteristic of their selecting comparable cases. Therefore, the evidence can not support the hypothesis 2: When the appraisers use the market comparison approach for the appraisal, the importance level of each characteristic of the estimated property to the value should be consistent with that of the comparison property to the price.
Table 2 Estimation results of the hedonic model Explanatory Variable Expected sign Model Ⅲ
(estimated value) Model Ⅳ (transaction price) Intercept 14.52115 *** (0) 13.90879*** (0) Location (located in Taipei) + 1.10322 *** (0.34998) 0.89400 *** (0.31559) Property use type
(commercial) + 0.64163 *** (0.26961) 0.36770*** (0.16947) Floor (first floor) + 0.09089 (0.03199) 0.33253*** (0.11625) Total floor numbers
( > 13th floors) + 0.28883** (0.12082) 0.30046*** (0.13721) Floor Area + 0.00194*** (0.46152) 0.00752*** (0.66616) Age of building - 0.01507 (0.07277) 0.01847* (0.09097) Obs. 224 230 F Value 43.37 *** 97.60*** Adj R-Sq 0.5327 0.7168 D.W 1.592 1.861 COLLINOINT 2.42637 2.33002
Notes: 1. Model Ⅲ is the estimated value model; Model Ⅳ is the transaction price model.
2. (Standardized —β) in parentheses; ***, **,* indicates the significance at the 1%, 5% and 10% levels, respectively.
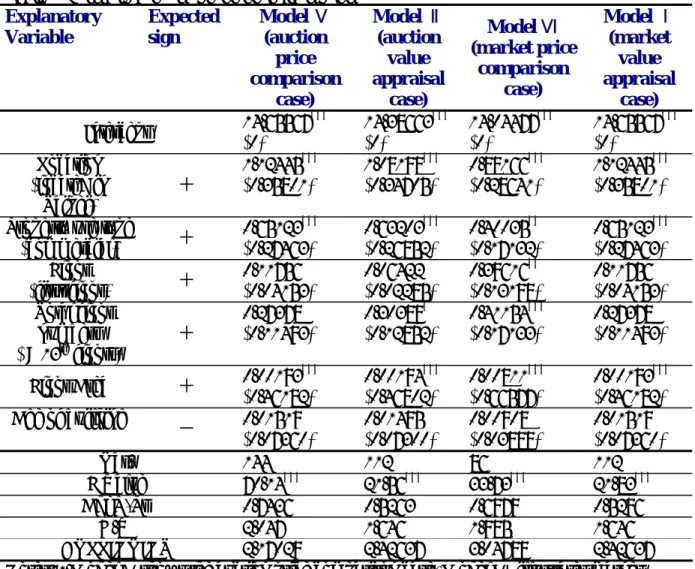
Furthermore, this research thus further analyzes whether the appraisers’ behaviors differ when they consider different market mechanism. Because the appraisal process of the NPAs is similar to the mass appraisal method6, the appraisers intend to measure each characteristic of the comparable properties while determining the target property value. Table 3 shows the estimated results for the different four models.
.
6 Because asset management Company (AMC) asks the appraisers to estimate a large number of property
In table3, the adjusted R2 value indicates that 74.36% of the total variability of property prices about their mean value is explained by the model Ⅴ. And the adjusted R2 value indicates that 52.63% of the total variability of property prices about their mean value is explained by the model Ⅵ. Both models demonstrate the good explanation ability.
Table 3 indicates the estimated coefficients of four models. We separate model IV into model V (auction-transaction prices only) and model VI (market-transaction prices only). Both Model I and model Ⅱ are the same as those in Table 1.
There is nearly no difference between model V and model Ⅱ based on auction value and price models. In contrast, the beta and the coefficient are not alike between model VI and model Ⅰ. For instance, the variable “floor ” only significantly matters in model VI, the market-transaction prices model. It implies that the appraisers refer well to the characteristic of the comparable cases while valuing the NPAs.
From the empirical evidence, we support the hypothesis 3: Because the appraisal process of the NPAs is similar to the mass appraisal method, the appraisers intend to measure each characteristic of the comparable properties while determining the target property value.
Table 3 Estimation results of the hedonic model Explanatory Variable Expected sign Model Ⅴ (auction price comparison case) Model Ⅱ (auction value appraisal case) Model Ⅵ (market price comparison case) Model Ⅰ (market value appraisal case) Intercept 14.65567(0) *** 14.38663(0) *** 14.04477(0) *** 14.65567(0) *** Location (located in Taipei) + 1.12445 *** (0.35801) 1.08198*** (0.34705) 0.88166*** (0.28641) 1.12445*** (0.35801) Property use type
(commercial) + 0.65123*** (0.27463) 0.63203*** (0.26852) 0.40035** (0.17132) 0.65123*** (0.27463) Floor (first floor) + 0.11756 (0.04153) 0.06422 (0.02285) 0.39616** (0.13198) 0.11756 (0.04153) Total floor numbers ( > 13th floors) + 0.27378 (0.11493) 0.30389* (0.12852) 0.41154*** (0.17133) 0.27378 (0.11493) Floor Area + 0.00193*** (0.46182) 0.00194 *** (0.46802) 0.00811 *** (0.66577) 0.00193 *** (0.46182) Age of building - 0.01519 (0.07360) 0.01495 (0.07300) 0.00908 (0.03889) 0.01519 (0.07360) Obs. 144 112 86 112 F Value 70.14*** 21.56*** 33.73*** 21.83*** Adj R-Sq 0.7436 0.5263 0.6979 0.5296 D.W 2.047 1.646 1.985 1.646 COLLINOINT 2.17029 2.42637 3.04789 2.42637
Notes: 1.Model Ⅴshows the auction price comparison case, Model Ⅵillustrates market price comparison case, Model Ⅰdisplays market value appraisal case, and Model Ⅱis the auction value appraisal case.
2. (Standardized —β) in parentheses; ***, **,* indicate significance at the 1%, 5% and 10% levels, respectively.
4. Conclusion
This study draws attention to discuss the relationship between the normative model and the actual appraiser behavior. In this research, we examine three hypotheses using the hedonic pricing model. In the market mechanism variable raw of table 1, we find that the average auction value is lower than the average market value by 28.49%. The
investigation supports the hypothesis 1 that market mechanism makes appraisers lower the NPAs value.
Nevertheless, we find that the characteristic influence levels in both the comparable model and the appraisal model are not the same. It implies that the appraisers do not adjust the values of target property on the basis of each characteristic of their selecting comparable cases. There is an alert to the appraisal research.
Finally, this study reveals that because the appraisal process of the NPAs is similar to the mass appraisal method, the appraisers intend to measure each characteristic of the comparable properties while determining the target property value.
References
Appraisal Institute. (2001), The Appraisal of Real Estate 12th Edition, Chicago, IL: Appraisal Institute.
Diaz, Julian .Ⅲ(1990a),”How Appraisers Do Their Work: A Test of the Appraisal Process and the Development of a Descriptive Model”, The Journal of Real Estate Research, 5(1):1-15. — (1990b ) , “The Process of Selecting Comparable Sales”, The Appraisal Journal ,
58(4):535-540.
Frew, J. and G.D. Jud. (2003), “Estimating the Value of Apartment Building”, The Journal of Real Estate Research, 25(1):77-86.
Gallimore, Paul and Marvin Wolverton. (1997), “Price-Knowledge-induced Bias: A Cross-Cultural Comparison”, Journal of Property Valuation and Investment, 15:3,261-273. Lin (1992), “The Study of the Relationship between Rental and Price in Taiwan”, Journal of
Taiwan Bank, 43(1):279-312.
Lin, Chiu-Chin and Chin-OH Chang (1996), “The study of Housing Price Index in Taipei”, Journal of Housing Study, 4:1-30.
Lusht, K.M. (1996), A Comparison of Prices Brought by English Auction and Private Negotiations, Journal of Real EstateEconomics,24:517-530.
Wolverton, Marvin. (1996) “Investigation into Price Knowledge Induced Comparable Sale Selection Bias”, Dissertation, Georgia State University.
Rosen S. (1974), Hedonic Price and Implicit Market : Product differentiation in Pure Competition,