IEEE TRANSACTIONS ON COMPONENTS, HYBRIDS, AND MANUFACTURING TECHNOLOGY, VOL. 12, NO. 2 , JUNE 1989 259
Electrical Properties
of
K20-Doped Bao.5 Sro.5 Ti03
Ceramic Humidity Sensor
YUAN-CHANG YEH AND T. Y. TSENGAbstract-A ceramic humidity sensor using Ba&ro.sTi03 doped with a few molar percent of potassium oxide was studied. It was characterized by long life, was reversible without repeated high-temperature thermal desorption processes, and conductance against relative humidity (RH) sensitivity, as high as four orders of magnitude, was found at low frequencies. This sensor showed a good exponential relationship between the conductance, RH, and temperature at low frequencies. The plots of the relative dielectric dispersion against RH showed that it had an apparent dielectric constant increase at low frequency as a result of the electrode and water molecular polarization effects. By complex impe- dance plots with a "non-Debye" capacitor concept, an equivalent circuit model was established which could well simulate all the electrical properties of the sensor in the range of 65-95 percent RH for all measured temperatures (25"C-85"C) and frequencies (5 Hz-13 MHz). In the measurement of this sensor, an inductance loop over the low RH (15 and 30 percent) and low frequencies (5 to 40 Hz) range was observed, which might be due to the desorption of water vapor at the electrode surface for reduction reactions.
INTRODUCTION
OME metal oxide materials can easily adsorb water vapor,
S
and adsorption of the surrounding water vapor can enhance the surface electrical conductivity and dielectric constant of the metal oxide [l], [2]. Using these properties, there are many porous metal oxides used for ceramic humidity sensors I31-[51.For a material to be a good humidity sensor, the following major characteristics are required: 1) large sensitivity, 2) reversibility, 3) fast response time, 4) long life, 5 ) small temperature dependence, 6) chemical and thermal stability. In general, the ceramic humidity sensor is both chemically and thermally stable, but the sensitivity of the ceramic sensors depends on the material itself, the porous structure, and the number of defect lattice sites and "nonlattice" oxygen atoms at the oxide surfaces [6]. The surface hydroxyl groups of the metal oxides can be removed by condensation dehydration upon heat treatment of the sample in vacuo, but the removal temperature used differs depending on the nature of the material itself [7], so it is possible to have a reversible humidity sensor operated at room temperature without the help of repeated heat cleaning cycles.
In our previous study [8], it was found that porous perovskite-type Ba,,5Sro.5Ti03 oxides can be used as a ceramic humidity sensor at room temperature (25 "C), its conductance versus RH sensitivity over 15-95 percent range is about three
Manuscript received August 9, 1988; revised December 13, 1988. The authors are with the Institute of Electronics. College of Engineering, IEEE Log Number 8926918.
National Chiao-Tung University, Hsinchu, Taiwan, ROC.
orders of magnitude at low frequencies. In this paper, we further investigate the electrical properties for this kind of material doped with a few molar percent of potassium oxide. The sensitivity can be increased over four orders of magnitude for this new composition. Besides, we will discuss the relative dielectric dispersion and absorption versus frequency relation of this sample in the presence of adsorbed water. Finally, an equivalent circuit model is provided which can well simulate the electrical properties of this sensor under high-moisture atmosphere (65-95 percent RH) for all measured temperature ranges (25°C-85 "C).
In general, there are three electrical parameters used to describe the electrical properties of the material. They are complex admittance ( Y )
,
complex impedance ( Z ),
and complex relative dielectric constant (k*). They have the following transformation relationships:Y ( w ) = G ( w ) + i B ( w ) = Z ( w ) - ' = [ R ( w ) + i X ( w ) ] - ' (1) and
A A
Y(w)=iwk*(w)co - = i w ~ ~ [ k ' ( ~ ) - i k ' ' ( w ) ] -
d d
where Y , 2, G , B , R , X , k ' , k " , and EO are symbols of
admittance, impedance, conductance, susceptance, resistance, reactance, relative dielectric dispersion, relative dielectric absorption, and the permittivity of free space, respectively. A is the cross-section area of the sample, and d is the thickness of the sample.
EXPERIMENTAL
A. Specimen Preparation
The raw materials in preparing the specimen were BaTi03, S I ~ O H ) ~ . 8H20, Ti02, and K2C03. A proper amount of mixed powders was ball-milled in acetone for 20 h, dried to evaporate the acetone, and calcined at 1100°C for 2 h. The calcined powders were then ball-milled in acetone for 10 h, dried again, and sifted through a 140-mesh screen to pro- duce the starting mixture powders of a composition of Bao.5Sro,sTi03-(K20).. The starting powders were pressed into discs of 10 mm in diameter and 2 mm in thickness, then the discs were placed in a platinum crucible and sintered at 1250°C for 1 h, the sintered compact was named the BSK sample.
B. Measurements
The crystalline phases were identified at room temperature by the standard X-ray (XRD) technique. The BSK sample had 0148-641 1/89/0600-0259$01 .00
O
1989 IEEE260 IEEE TRANSACTIONS ON COMPONENTS, HYBRIDS, AND MANUFACTURING TECHNOLOGY, VOL. 12, NO. 2 , JUNE 1989
o : 2 5 ' c A : 45.C
Fig. 1. Scanning electron micrograph of fracture surface of the BSK sintered compact.
the same pattern as single-phase B%.5Sr0,5Ti03. The fired bulk density and open porosity obtained by the Archimeds tech- niques were 4.08 g/cm3 and 22 percent, respectively. The specific surface area of this disc was 0.37 m2/g, which was determined by the BET method, using N2 gas. The microstruc- ture was examined by scanning electron micrograph (SEM). The average grain size was 1.2 pm as determined by the linear intercept technique from the micrograph of sample fracture surface as shown in Fig. 1.
The electrical properties were measured by using a two- probe method with evaporated gold electrode applied to the opposite faces of the fired discs. The ambient atmosphere of humif!ity and temperature were controlled by a Multi-Function and Programmable Temperature/Humidity test chamber. Hu- midity was controlled over 15-95 percent RH range within an accuracy of k 2 percent, and the temperature was controlled over 25 "C-85 "C range within an accuracy of -+ 0.1 percent. Conductance and susceptance of the sample were measured with an impedance analyzer.
RESULTS AND DISCUSSION
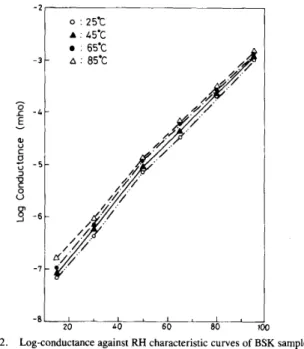
The comparatively stable and reversible operation of the sensor measured at ac 1 V (400 Hz) is shown in Fig. 2, where curve A was measured soon after the devices were made and the measuring condition was controlled at 25 "C from low RH to high RH, and curves B ,
C,
andD
are the measured results of the sample exposed to the controlled temperature at 45"C, 65"C, and 85°C from low RH to high RH for 3, 6, and 9 weeks, respectively. The figure indicates that the conductance of this sensor has only a very small variation at 15 percent RH for 25 "C and 45 "C, even though curve B was measured after the sample was exposed to high-moisture atmosphere for a long time. It has a small increase at higher temperature. This means that the sensor is reversible without high-temperature cleaning cycles to remove the surface hydroxyl groups. It also indicates that the conductance against RH sensitivity is as much as four orders of magnitude, and has a good exponential- 3 -
2
- A - J L5 ;; - 5 - € v2
U - 6 - -1 - . 65% A : 05% . 65% A : 05% -8 20 LO 60 80 DFig. 2 . Log-conductance against RH characteristic curves of BSK sample at
ac 1 V (400 Hz) and 25"C-85"C.
linear relation at fixed temperature as
G ( H ) = G h ( T ) exp ( m ( T ) X H ) (3) where H i s the relative humidity, Gh( T ) is the conductance of the sample at T("C) and 15 percent RH, and
m(T)
is the slope of the log-conductance against RH at temperature T("C). The slopesm(T)
of this sensor for temperature at 25"C, 45"C, 65"C, and 85°C are 12.05, 11.95, 11.84, and 11.40, respectively.Fig. 3 shows the temperature dependence of the sensor under different RH. It indicates that log-conductance against reciprocal temperature of the sample at fixed RH has
a
good linear relationship and can be expressed as(4) G ( T , H ) = G T ( H ) exp [E(H)/KTI
where E is the activation energy under different RH, K is the Boltzmann constant, H i s the relative humidity, and G T ( H ) is the conductance at 25°C for different RH. The activation energy of this sample for RH at 15, 30, 50, 65, 80, and 95 percent is 0.14, 0.12, 0.10, 0.10, 0.05, and 0.06 eV, respectively. Its magnitude is almost decreased with increas- ing RH. It agrees with the known effect that increasing water vapor can lower the activation energy of the sensor [9], resulting in an increase in the surface conductivity. Table I gives the characteristics of the sintered compacts manufac- tured by pure B%.5Sro.5Ti03 sintered at 1200°C (BSI) and K20-doped Ba,&3ro.5Ti03 sintered at 1250°C (BSK). The porosity and specific surface area of the former are larger than those of the latter, but the conductance-humidity sensitivity measured at 25°C is much smaller. It may be attributed to the influence of the defect lattice sites and "nonlattice" oxygen atoms at oxide surfaces on water adsorption [6], [lo], that is, doping with potassium oxide can create more surface defect lattice sites or oxygen vacancies, resulting in an increase in the efficient adsorption sites for water vapor adsorption.
YEH AND TSENG: B&, sSro 5Ti03 CERAMIC HUMIDITY SENSOR - 6 -
-
307. 4 I I I 2.8 3 3.2 -81 (*K)-'Fig. 3. Temperature dependence of the BSK sample at ac 1 V (400 Hz) and 15-95 percent RH.
TABLE I
COMPARISON OF THE CHARACTERISTICS FOR BSI AND BSK SAMPLES
Avg. Specific Slope
Relative Open Grain Surface m ( r )
Specimen Density Porosity Size Area Sensitivity at Number (%thero) (%thero) (pm) (m2/g) (orders) 2 5 ° C
BS 1 64 31 0.6 0.95 3 12.0
BSK 74 22 1.2 0.37 4 8.9
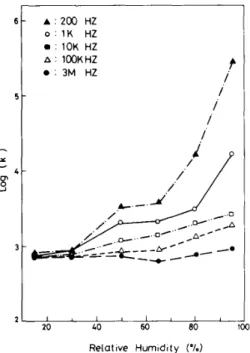
Fig.
4
shows the logk'
against RH curves measured at 25°C for different frequencies. It indicates that 1)k'
is almost the same for all frequencies at 15 percent RH; 2)k'
is almost the same for all RH at 3 MHz; 3) k' increases asRH
increases and the amount of increase is higher at lower frequencies;4)
the magnitude ofk'
can be increased about 2.5 orders of magnitude at 200 Hz; 5) k' increases sharply under highRH
atmosphere at low frequencies. It means that at extremely low RH (15 percent), there is no hydroxyl groups formed on the surface, so it exhibits the intrinsic behavior of the sample, which behaves like a dielectric with a relative dielectric constant of about 800. When some water is adsorbed, it can form hydroxyl groups, and each water molecule is bonded to two hydroxyl groups. When more water is adsorbed, it can form an ice-like cluster, and each water molecule is only singly bonded to a hydroxyl group. Water molecules bound to the surface with two hydrogen bonds will not be as free to reorient in an applied electric field as those which are singly bonded. Thus the singly bonded H 2 0 will make a greater contribution to the dielectric constant than the doubly bonded H 2 0 [ 11. Besides, for ionic conductivity electrode reactions are required at the electrode surfaces to provide a source and
A : 2 W HZ 0 : 1K HZ : 10K HZ A : 1WKHZ : 3M HZ
i
f
i
i
i
i
/'i /
/' I , I I I , I , 20 40 60 80 1 Relative Humidity (%) 26 1 0Fig. 4. Effect of frequency and RH on the relative dielectric dispersion (k')
of the BSK sample at 2 5 ° C . A ' 25% 0.45'c : 65% A : 85% v
;I
1 X I R (kn)Fig. 5. The complex impedance planes for BSK sample at 80 percent RH and 25"C-85"C.
sink for the charge carriers. When this reaction cannot keep up with the large number of charge carriers arriving at or departing from an electrode during any half-cycle, electrode polarization and an increased apparent dielectric constant result [ 111, so the increasing relative dielectric dispersion at lower frequencies is due to the water molecular and electrode polarization effects.
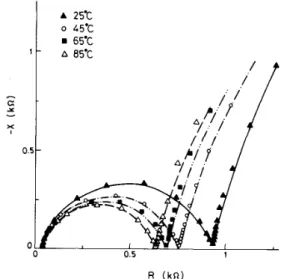
Fig. 5 shows the complex impedance planes of the sample measured at 80 percent
RH
between 2 5 ° C and 85°C. They262 IEEE TRANSACTIONS ON COMPONENTS, HYBRIDS, AND MANUFACTURING TECHNOLOGY, VOL. 12, NO. 2, JUNE 1989
appear to give inclined semicircles passing through or close to the origin and have their axes depressed below the real axis by an angle (1
-
n2)a/2 at sufficiently high frequencies. However, at lower frequencies, these semicircles go over into what appears to be the beginning of another inclined semicir- cle, which is inclined to the vertical by an angle (1-
nl)7r/2. This kind of inclined semicircle complex plane was also observed for many solid electrolytes and dielectrics, which had been well explained by Jonscher [ 121, [ 131. He proposed a “universal law” [ 121 for many solid ionics and dielectrics, that a parallel combination of frequency-independent conduc- tance G and a dispersive frequency-dependent capacitanceCn(o)
will give an inclined complex plane. He terms Cn(w) as “non-Debye” capacitance, which is given by the following relation:Cn(w)= C ( i w ) n - l . ( 5 )
Using this relation, the admittance of this capacitance can be expressed as
Y ( w ) = iwCn = C ( i w ) n = C [cos (na/2)
+
i sin (nn/2)]wn.In the same way, the impedance of a parallel combination of a frequency-independent conductance G and a “non-Debye” capacitance Cn(w) can be written as
Z ( w ) = [ Y ( w ) ] - l = [ G + C ( i o ) n ] - l = R ( w ) - i X ( w ) (7) with
R ( w ) = G
+ c
[cos (na/2)] 0“[,+c
(cos‘II>
a n ] 2 +[c
(siny )
w n ] andC [sin (nn/2)]wn
[ G + C (cos
F)
u n ] 2 +[.
(siny )
a n ] X ( 0 ) =(9) Using these relationships, the equivalent circuit model of this sample is shown in Fig. 6, where R,, R,, C,,,, Re, and Cen represent the grain resistance, grain surface resistance, grain surface “non-Debye” capacitance, electrode contact surface resistance, and electrode contact surface
‘
‘non-Debye” capac- itance, respectively. The series inductance L is also consid- ered, for there are some high-frequency noise interferences entering the measuring line. Using this equivalent circuit model, and letting the “non-Debye” capacitances beC,,=Cl(iw)nl-l and C,,,= C2(iw)n2-1 (10) then the equivalent impedance of this model can be written as follows: Z ( o ) = R(w) - iX(w) (1 1) with -+cl 1
(
3
1
w”1 Re.+
[
;+cl
(cosy )
a n i ] 2 +[cl
(siny )
w.11 andYEH AND TSENG: B ~ o sSro sTi03 CERAMIC HUMIDITY SENSOR I I I I I I I I Ras I Re I I Rg grain Cgsn I Can I I I I I
grain I electrode I measuring surface I surface I line
I I
I I
I I I
Fig. 6. The equivalent circuit of the BSK sample with a series interference inductance.
Fig. 7 shows the complex impedance graph measured at 95 percent RH between 25°C and 85°C accompanied by the simulation results using the above formula for each condition. It fits very well for all these conditions. The fitting parameter values for these conditions are listed in Table 11. Table I1 indicates that 1) all the nl and
n2
are the same for all measured temperatures; it means that temperature does not change the high-frequency and low-frequency inclined angles; 2) R, is not affected by the temperature variation; 3) R, decreases with increasing temperature, i.e., the charge carrier can move faster due to the larger mobility at higher temperature; 4) C1 is far larger than C2, i.e., the electrode polarization effect is much stronger than the grain surface molecular polarization effect. Taking these data to analyze the electrical properties of this sample at low frequencies, it is found that at frequencies below 4 kHz, (12) and (13) can be approximated as follows:cos (n17r/2) c1w"1 R ( w )
=
R,+
R,+
and sin (n17r/2) 1 X ( w ) = =- C I W " I CIO"1 (since nl = 0.867 and sin ( 0 . 8 6 7 ~ / 2 )=
1). at low frequencies can be expressed as follows:Combining (14) and ( 1 3 , the relative dielectric dispersion
1
-
C x v X I 0.1 0 A 25'c 0 45'C 65% A 65% 263 / c / /i /
0.5 1 R (kn)Fig. 7 . The measured (symbols) and simulated (lines) complex impedance curves of the BSK sample at 95 percent RH and 25OC-85"C.
TABLE LI
SIMULATION PARAMETER VALUES OF THE BSK SAMPLE AT 95-PERCENT RH AND 25"C-85"C
25 25 897 19 7.5 0.867 0.82 0.35 7 45 25 728 25 6.0 0.867 0.82 0.35 6 65 25 664 28 5.5 0.867 0.82 0.35 5
85 25 602 32 5.0 0.867 0.82 0.35 4
This indicates that k ' ( w ) is inversely proportional to C I ,
w"1+ l , and ( R ,
+
It agrees with the previous statements that dielectric dispersion decreased with increasing frequency, and is verified by the relative dielectric dispersion against frequency graph measured at 65 "C for different RH as shown in Fig. 8. In this figure, it is found that k ' ( w ) is almost proportional to w - " l - l at low frequencies from 65 to 95 percentRH
range, and the loss tangent ( k " / k ' ) peak is shifting to higher frequency at higher RH. Besides, the simulated results indicate that k ' ( o ) is almost proportional to w - " I - I over 100-4 kHz, 10-400 Hz, and 5-100 Hz frequencyX ( 0
1
oEo[R(0)2+X(w)2]
-
k ' ( o ) =
A d
because at frequencies between 100 Hz and 4 kHz, R,
+
R,> >
l/(Clwnl), so (16) can be further reduced toranges (FR1) for 95,80, and 65 percent
RH,
respectively. The high-frequency end in each frequency range increased with increasing RH, so the loss tangent peak would be shifted to higher frequency at higherRH.
The simulation parameter values for the sample under 25 "C and 65-95 percent RH range are listed in Table 111. The d / A
WEO(R,
+
Rgs)2C1 w"1-
2 64 8 II A 65"Ie h 9% 0 80% 95"Io h 6 - 4 -
-
h x v -8' -IIEEE TRANSACTIONS ON COMPONENTS, HYBRIDS, AND MANUFACTURING TECHNOLOGY, VOL. 12, NO. 2, JUNE 1989
8
6
zt
1'
Log f (HZ)
The measured (symbols) and simulated (lines) log k' and log tan 6 versus frequency curves of the BSK sample at 25°C for 65 percent ( A ) , 80
percent (0). and 95 percent (0) RH. Fig. 8.
TABLE IU
SIMULATION PARAMETER VALUES OF THE BSK SAMPLE AT 25°C AND 65-95 PERCENT RH
95 25 897 19.0 7.5 0.867 0.82 0.35 7 80 25 4827 13.0 7.0 0.880 0.81 0.35 700 65 25 29000 8.5 6.0 0.880 0.79 0.35 7oooO
measured and the simulated relative dielectric dispersion and loss tangent curves are shown in Fig. 8. It indicates that the simulated results fit very well with the measured results for the whole frequency range at 80 and 95 percent
RH,
but it has a little deviation from the measured result at frequency above 100kHz
for 65 percentRH.
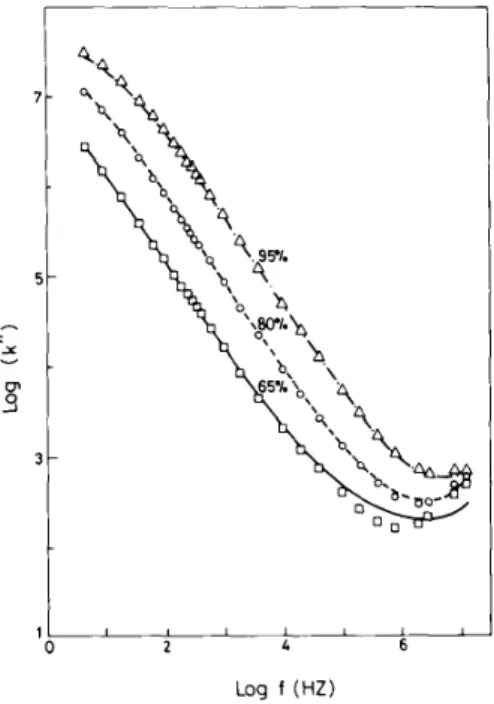
Fig. 9 shows that the simulated k"(u) results fit very well with the measured results for the whole frequency range at 25°C and 65-95 percent
RH.
It appears that k " ( w ) is almost inversely proportional to a-' at low and median frequencies. This relationship can be derived from k"(u) formulaPutting simulation parameter values into (12) and (13), it can be calculated that R ( w ) / [ R 2 ( w )
+
X 2 ( u ) ] will be a constant (=Rgs-l) over 100-200 kHz, 10-60 kHz, and 5-20 kHz frequency ranges (FR2) for 95, 80, and 65 percentRH,
respectively. Thus k " ( w ) in these frequency ranges is approx- imately proportional to 0 - l and RgS-'. This result agrees withthe curves shown in Fig. 9.
7 - 5 -
,-.
x v IT 4 3 - 1 1 I L L 0 2 4 6 Log f (HZ)Fig. 9. The measured (symbols) and simulated (lines) log k" versus frequency curves of the BSK sample at 25°C for 65 percent
(a),
80 percent( 0 ) , and 95 percent ( A ) RH.
Each FR2 frequency range calculated at fixed RH is much wider and covers each FR1 frequency range calculated at the same RH. Besides, k'(u) decreases much slower at the frequency above the high-frequency end of each calculated FR1 frequency range. Thus the loss tangent (tan 6) shows a loss peak at the high-frequency end of each FR1 frequency range, which are 100, 400, and
4
kHz
for 6 5 , 80, and 95 percent RH, respectively. It agrees with the measured results as shown in Fig. 8.From Table 111, it is seen that 1) R, decreases with increasing RH, and approximately follows the following relation:
where m ( 2 5 " C ) = 12.05 as stated previously, and H I , H2 denote two different RH. It means that increasing RH can increase the concentration of charge carriers, resulting in an increase in the grain surface conductivity; 2) Re decreases abruptly with increasing RH. It means that the increasing ionic carriers which are accumulated at electrode surface can cause a larger electrons flow through the electrode contact surface; 3) CI and C2 increase with increasing RH due to the stronger polarization effect that is arising from more charge carriers accumulated at the electrode contact surface and the grain surface [l 13; 4) the resistance of grain R, is not affected by
RH,
i.e., the water vapor does not react with grain; 5) the inclined angles only change a little with the variation of RH, and decrease with increasing RH. The relative dielectric dispersion behavior at low frequency can be interpreted by putting these simulation data into (17). The increasing RH makes R, decrease more abruptly than the increasing rate ofYEH AND TSENG: B ~ . s S q . s T i 0 3 CERAMIC HUMIDITY SENSOR 265
t
0 6
Log f (HZ)
Fig. 10. The log k” versus frequency graph for the measured, simulated with inductance ( L ) , and simulated without inductance ( L ) curves at 25”C, 80 percent, and 95 percent RH: 1) measured results for 80 percent ( A ) and
95 percent (0) RH. 2) Simulated results with inductance effect for 80 percent (0) and 95 percent ( 0 ) RH. 3) Simulated results without L for 80
percent and 95 percent RH (lines).
C1, and the relative dielectric dispersion k ’ ( w ) at low frequency is inversely proportional to C1(R,
+
Rg#, thus k ’ ( w ) is higher at higherRH,
and grain surface resistance (R,) makes a greater contribution to k ’ ( w ) at low frequency. This agrees with the experimental results shown in Fig.4.
Fig. 10 shows k ” ( w ) versus frequency curves measured at 25°C for 80 percent (curve A ) and 95 percent (curve D )
RH.
It indicates that the simulated results with series inductance
L
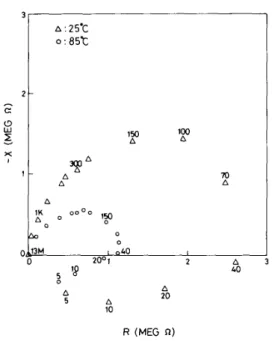
(curves B and E) fit very well with the measured results in the whole frequency range, but the simulated results without consideration of the series inductance L (curve C and F) will deviate from the measured results at frequency above 2 MHz. The series inductance L appearing at the measuring line is not the property of the sample, so the intrinsic k ” ( w ) curve of the sample will be a simulated curve without consideration of L. It is very interesting to note that an inductance loop exists for this sample when it is exposed to low RH (15 and 30 percent) atmosphere and measured at low frequencies (5 to 40 Hz), as shown in Fig. 11. The origin of this inductance effect may be due to the water vapor desorption reduction reaction with the blocking electrode, which has been observed by some other authors [14], [15].CONCLUSION
The potassium oxide doped Ba&r0.5Ti03 ceramic humidity sensor can have a better sensitivity than a pure Ba,,5Sro,5Ti03 sensor. It shows a good exponential linear relationship among conductance,
RH,
and temperature, so it can be easily used for practical application in a wide temperature range of 25 “C- 85°C. An equivalent circuit model is also provided, which canA : 25’C o : 85‘c 0 0 0 0
‘Y
0 0 150‘P
A 5 A 10 A 20 R (MEG n)Fig. 1 1 . The complex impedance plots of the BSK sample at 30 percent RH
for 25°C and 85°C.
well simulate the measured results over 25OC-85”C and 65- 95 percent
RH
ranges. From the simulation results, we can well explain the electrical properties of the sample over 25°C- 85°C and 65-95 percent RH ranges. It indicates that the grain resistance is not affected by humidity and temperature at these ranges, but the grain surface resistance can decrease a little at elevated temperatures due to the increasing mobility of charge carriers. At higherRH,
the grain resistance and electrode contact surface resistance can decrease abruptly due to the abruptly increasing concentration of charge carriers. The relative dielectric dispersionk
’(U) is almost inversely propor- tional t o a n l + ’ , and C l ( R ,+
at low frequency, so k ’ ( w ) increases abruptly at higherR H
and lower frequencies. The relative dielectric absorptionk”
(a) is almost proportional to u-l and Rgs-’ at low and median frequencies. Besides, we can find that the measured electrical properties are not the intrinsic sample properties, because there is some noise interferences entering the measuring line at high frequency. An inductance effect is also measured, which exists at low-conductivity condition, and appears only at low RH and low frequency range. This effect may be due to the water vapor desorption reduction reaction at the electrode contact surface.REFERENCES
111 J . H . Anderson and G . A. Parks, “The electrical conductivity of silica
gel in the presence of adsorbed water,” J . Phys. Chem., vol. 72, no.
[2] E. McCafferty and A. C. Zettlemoyer, “Adorption of water vapour on a-Fe203,” Discuss. Farady Soc., no. 52, pp. 239-263, 1971. [3] T, Nitta and S. Hayakawa, “Ceramic humidity sensor,” IEEE Trans.
Comp., Hybrids, Manuf. Technol., vol. CHMT-3, no. 2, pp. 237- 243, June 1980.
Y. Tatsuo and H . Shimizu, “Some considerations on stability of electrical resistance of the Ti02/Sn02 ceramic moisture sensor, ” IEEE
Trans. Comp., Hybrids, Manuf. Technol., vol. CHMT-5, no. 2, pp. 238-241, June 1982.
Y . Sadaoka, M. Matsuguchi, Y . Sakai, H. Aono, S. Nakayama, and H.
10, pp. 3362-3668, Oct. 1968.
[4]
266 IEEE TRANSACTIONS ON COMPONENTS, HYBRIDS, AND MANUFACTURING TECHNOLOGY, VOL. 12, NO. 2, JUNE 1989
Kuroshima, “Humidity sensors using KH2P04-doped porous (Pb,La)(Zr,Ti)O,,” J. Mater. Sci., vol. 22, no. 10, pp. 3685-3692, Oct. 1987.
P. A. Thiel and T. E. Madey, “The interaction of water with solid surface: fundamental aspects,” Surf. Sci. Reports, vol. 7, no. 6-8, pp. 211-385, Oct. 1987.
T. Morimoto, M Nagao, and F. Tokuda, “An approach to test the binding force of chemisorbed water on metal oxides,” Bull. Chem. Soc. Japan., vol. 40, no. 11, pp. 2723-2723, Nov. 1967.
Y. C. Yeh and T. Y. Tseng, “Humidity-sensitive electrical properties of Ba,,sSro.sTi03 porous ceramics,” J. Mater. Sci. Lett., no. 7, pp. [9] K. Tennakone, “Activation of electronic conduction in molecular solids by adsorbed water,” J. Chem. Soc., Farady Trans. I , vol. 79,
W. J. Lo, Y. W. Chung, and G. A. Somorjai, “Electron spectroscopy studies of the cherisorption of 0 2 , H2, and H2O with varied
[6] [7] [8] 766-768, 1988. pp. 705-709, 1983. [lo]
stoichiometry: Evidence for the photogeneration of Tit3 and for its importance in chemisorption,” Surf. Sci., vol. 71, no. 2, pp. 199-219,
Feb. 1, 1978.
W. D. Kingery, H. K. Bowen, and D. R. Uhlmann, Introduction to
Ceramic.
A. K. Jonscher, “Aqalysis of the alternating current properties of ionic conductors,” J. Mater. Sci., vol 13, no. 3, pp. 553-562, Mar. 1978.
A. K. Jonscher, “The interpretation of non-ideal dielectric admittance
and impedance diagrams,” Phys. Status Solidi (a), vol. 32, pp. 665- 676, 1975.
H. Kahil, E. J. L. Schouler, M. Forestier, and J. Guitton, “Characteri-
zation of the solid composite electrode Mn02--,. acetylene black, HUP/ HUP by impedance spectroscopy,” Solid State Ionics, vols. 18 and
E. J. L. Schouler and M. Kleitz, “Electrocatalysis and inductive effects at the gas, Pt/stabilized zirconia interface,” J. Electrochem. Soc., vol.
134, no. 5, pp. 1045-1050, May 1987. New York, NY: Wiley, p. 935, 1976.