Emissions of Organic Air Toxics from a Four-stroke Motorcycle by Using 1
Ethanol–blended Gasoline 2
3
Yung-Chen Yao,1 Jiun-Horng Tsai,1* and Hung-Lung Chiang2 4
1
Department of Environmental Engineering and Sustainable Environment Research Center, 5
National Cheng Kung University, Tainan, Taiwan, Republic of China. 6
2
Department of Health Risk Management, China Medical University, Taichung, Taiwan, 7
Republic of China. 8
9
Key words: air toxics; organic analysis; emissions; characterization. 10
11 12
Contact Information 13
*Corresponding author, Jiun-Horng Tsai Department of Environmental Engineering, National 14
Cheng Kung University, Tainan City, 701, Taiwan, Republic of China Chung; phone: 15
866-6-2751084; fax: 886-6-2083152; e-mail: [email protected] 16
Yung-Chen Yao, Green Energy and Environment Research Laboratories, Industrial Technology 17
Research Institute, Hsinchu, 310, Taiwan, Republic of China; phone: 866-3-5914753; fax: 18
886-6-2083152; e-mail: [email protected] 19
Hung-Lung Chiang, Department of Health Risk Management, China Medical University, 20
Taichung, 404, Taiwan, Republic of China; phone: 866-4-22079685; fax: 886-4-22079687; 21
e-mail: [email protected] 22
Emissions of Organic Air Toxics from a Four-stroke Motorcycle by Using 1
Ethanol–blended Gasoline 2
3
Yung-Chen Yao,1 Jiun-Horng Tsai,1* and Hung-Lung Chiang2 4
1
Department of Environmental Engineering and Sustainable Environment Research Center, 5
National Cheng Kung University, Tainan, Taiwan, Republic of China. 6
2
Department of Health Risk Management, China Medical University, Taichung, Taiwan, 7 Republic of China. 8 9 10 Abstract 11
The effect of ethanol-gasoline blends on organic air toxic emissions was investigated in a 12
four-stroke carburetor motorcycle without a catalytic converter. An inhalation toxicity-based 13
emission ranking for the toxics from each test fuel was also conducted. Four blends, containing 3, 14
10, 15, and 20 % (vol) ethanol in gasoline were tested. The commercial unleaded gasoline with 15
methyl tert-butyl ether as the oxygenated additive was also tested as a reference case. The 16
experimental data indicated that addition of ethanol may reduce emissions of selected air toxics, 17
except those of acetaldehyde. The fuel with 15 % (vol) ethanol content performed the greatest 18
reduction in emissions of organic air toxics. However, acetaldehyde emissions significantly 19
increased by almost 10-fold, by using ethanol fuels. In addition, the results of the emission 20
ranking of air toxics showed that the gasoline blend with 15 % (vol) ethanol had the lowest total 21
mass-based emissions of air toxics, and ranked high in toxicity-weighted emissions due to 22
associations with cancer and acute health effects. 23
24
Key words: air toxics; organic analysis; emissions; characterization. 25
26
Introduction 27
In the last decade, the application of alternative fuels has received more attention because of 28
shortages of petroleum as well as concern about green house gases emissions. Biofuels have 29
been promoted by many countries around the world, including the United State, Brazil, European 30
Union member states, and Australia (Charles et al., 2007). Ethanol is the most widely employed 31
biofuel and many countries have established or have planned to promote ethanol gasoline (Niven, 32
2005), but the potential air pollution issues caused by such fuels still need to be considered 33
seriously. 34
Many researchers have focused on the correlation between ethanol-gasoline blended fuels 35
(3-85 % by volume) and air pollutant emissions of spark ignition engines with most of the 36
studies being carried out on passenger cars. In general, total hydrocarbon and carbon monoxide 37
exhaust emissions are lower with ethanol-blend fuels (Leong et al., 2002; He et al., 2003; Yüksel 38
and Yüksel, 2004; U.S. EPA, 2010a). With regard to air toxics, addition of ethanol to gasoline 39
has been observed to reduce benzene, 1,3-butadiene, toluene, and xylene emissions, but may 40
significantly increase acetaldehyde emissions (Stump et al., 1994; Poulopoulos et al., 2001; 41
Leong et al., 2002; Niven, 2005). In addition, tests on ethanol gasoline have been observed to 42
increase formaldehyde emissions (Stump et al., 1994; CSIRO et al., 2003), reduce emissions 43
(Leong et al., 2002; Schifter et al., 2005) and give mixed results (Knapp et al., 1998). The 44
addition of ethanol into gasoline also has some adverse effects, e.g., increased fuel consumption 45
(Al-Hasan, 2003), as well as the presence of unburned ethanol and increased aldehyde emissions 46
(Poulopoulos et al., 2001; He et al., 2003). 47
The quantification of pollutant emissions has mostly been done with passenger cars, and 48
studies related to the effects of ethanol-blended gasoline on the emission of air pollutants for 49
small engine capacity (less than 150 cm3) motorcycles are rather limited (Magnusson et al., 2002; 50
Jia et al., 2005). The air toxics emissions from motorcycles are a critical issue in several 51
countries and metropolitan areas especially in Asian counties (e.g. China, India, Indonesia, 52
Taiwan, and Thailand) and South American. With different engine and fuel supply systems, the 53
emissions from cars and motorcycles are also different. Hsu et al. (2001) reported that volatile 54
organic compound (VOC) emissions from motorcycles are four times higher than those from 55
passenger cars due to the former is being used primarily for short distance travel and having a 56
relatively low average speed. VOCs are a concern because they are precursors of ambient ozone 57
formation via a photochemical reaction, and have many adverse health effects. Several VOCs are 58
classified as known or probable human carcinogens, such as benzene, 1,3-butadiene, 59
formaldehyde, and acetaldehyde. These are included in a list of 21 mobile source air toxics 60
published by the U.S. Environmental Protection Agency (U.S. EPA, 1994; Payne-Sturges et al., 61
2004), and are likely to present the highest risks to public health and welfare. A thorough 62
analysis of air pollutant emissions from motorcycles is thus necessary. In addition, the effects of 63
using ethanol-blended gasoline on motorcycle emissions are currently not fully known, 64
especially with regard to the organic compounds, and this also deserves further study. 65
Four-stroke engine motorcycles are now the dominant type. A new motorcycles sold in Taiwan 66
have been four-stroke ones since 2004 (Yao et al., 2009), and an estimated 85 % of new 67
motorcycle sales were four stroke engines in 2002 in Thailand (UNDP/ESMAP, 2003). In this 68
study, emissions of organic air toxics from a four-stroke motorcycle were evaluated by 69
conducting a chassis dynamometer experiment. Four test fuels of ethanol-blended gasoline 70
(ethanol content from 3 to 20 % by volume) were used, and a commercial gasoline was also used 71
as the reference to evaluate the effects on emission. In particular, an inhalation toxicity-based 72
emission ranking for selected air toxics was calculated, which may provide useful information 73
related to the potential health impact of different ethanol-blended gasoline. 74
75
Experimental Methods 76
Test fuels and motorcycle 77
The level of ethanol content in the gasoline was adjusted with reference to the practical engine 78
conditions. The target levels established for the ethanol-blended gasoline were 3% (E3), 10% 79
(E10), 15% (E15), and 20% ethanol (E20) by volume. A constant research octane number (RON) 80
of 95 was controlled to accurately represent commercial gasoline. The four ethanol blends were 81
prepared by the largest petroleum refinery in Taiwan (China Petroleum Corporation, CPC). A 82
commercial unleaded gasoline was used as the reference fuel (RF). RF has an octane rating of 95 83
and has methyl tert-butyl ether (MTBE) as the oxygenated additive. It was purchased from a 84
gasoline station operated by CPC. The composition analysis of the fuels was performed by CPC 85
following the American Society for Testing Materials procedure. The properties of 86
ethanol-blended gasoline and RF, measured by CPC, are presented in Table 1. 87
The weight of the test motorcycle was 101 kg. A carburetor was used for the fuel supply 88
system, and the engine was air-cooled and used a capacitive discharge ignition with a single 89
cylinder arrangement. The compressor ratio of the engine was 8.6 at the maximum power and the 90
detailed specifications of the test motorcycle are shown in Table 2. The motorcycle was a 91
non-catalyst model without any engine adjustment in order to accentuate the effects of the 92
ethanol-gasoline blends during testing. 93
94
Test procedures 95
A legislative test procedure, CNS 11386, was used for the motorcycle emission test (TEPA, 96
2001), and this is the same as that of the Economic Commission for Europe test cycle (ECE). 97
One complete test cycle (780 s) includes idle (240 s), acceleration (168 s), cruising (228 s), and 98
deceleration (144 s) stages. The total distance of the test was 4 km with average and maximum 99
speeds of 19 and 50 km/h, respectively. 100
Emission tests were performed on a chassis dynamometer in a certified laboratory of a local 101
motorcycle manufacturer. The main system was comprised of a chassis dynamometer (MEIDEN, 102
20KW), a dilution tunnel, a constant volume sampler unit (HORIBA, CVS-51S), and an exhaust 103
gas analyzer (HORIBA MEXA-7200). Vehicle details (registration number, maker, category, and 104
test weight) were entered into the dynamometer control computer for identification and 105
calculation of the inertia loading applicable for the vehicle. The information was then saved to a 106
dedicated file from which the test cycle was referenced to set the correct speed and loads during 107
testing. The test room temperature ranged from 20-30 oC. 108
The sampling equipment for organic air pollutants is similar to that used in a previous work 109
(Tsai et al., 2003). A vacuum box containing a 10 L Tedlar bag was used to sample emissions 110
over the entire ECE cycle. Exhaust gas was drawn in via a sampling pump with a controlled flow 111
rate of 150 mL/min. Three-way control valves were used to direct samples into the sample bag. 112
Due to the limitations of the sampling equipment, the sampling work was performed manually. 113
Prior to each emissions test, a fuel change protocol was followed to ensure minimal crossover 114
between the test fuels and to ensure consistency between tests. To change fuel, the fuel tank was 115
drained, one liter of the new fuel was added, the engine was idled for five min to allow the new 116
test fuel to flush through the fuel supply system thoroughly, and then the tank was drained again. 117
Two liters of the new fuel were then added for the subsequent emissions test. The test motorcycle 118
and fuel were then conditioned with 10 min of real road driving without emissions measurement. 119
The motorcycle was left at room temperature for over 6 h prior to the start of the cold-start 120
testing process. Six tests of various test fuels were conducted to detect organic compounds, 121
including two tests each for E10, and E15, and one test each for commercial gasoline (RF), E3, 122 and E20. 123 124 Analytical procedures 125
After sampling, the sample bags were immediately placed into a black container and taken to 126
the laboratory for hydrocarbon species analysis within 24 h. Hydrocarbon species with a carbon 127
number larger than 3 ( > C3) were preconcentrated by a purge and trap system (Varian) and 128
quantified using gas chromatography/mass spectrometry (Varian Star 3600 GC plus with a 129
Varian Saturn 2000 MS). The temperature of the trap system was cooled to -160 °C by liquid 130
nitrogen. The thermal desorber was then preheated to 200 oC for purging. The GC was equipped 131
with a fused silica capillary column (DB-1, 60 m × 0.32 mm ID with 1.0 μm film thickness) and 132
connected to the MS. Compounds with carbon numbers of 2 to 4 (C2 to C4), were analyzed 133
using gas chromatography/flame ionization detection (Hewlett Packard 6890 GC/FID). The GC 134
was equipped with a fused silica capillary column (HP-PLOT, 30 m × 0.32 mm ID) and 135
connected to the FID. 136
Calibration standards were prepared by diluting the certified standard gas (56 Environ-Mat 137
Ozone Precursor, Matheson, USA) with ultra high purity nitrogen (99.995%) in dilution bottles. 138
For GC/MS, the R-square (r2) of the calibration curves of the 56 VOC species were generally 139
higher than 0.995, the relative standard deviation (RSD) was < 10%, and the accuracy was in the 140
range of 89 ± 6% to 107 ± 9%. The method detection limit ranged from 0.13 (cyclohexane) to 141
4.77 mg/m3 (trans-2-butene). For GC/FID, the r2 values of the calibration curves were higher 142
than 0.999 for six C2 to C4 compounds, the relative standard deviation was less than 0.5%, and 143
the accuracy was in the range of 91 ± 1% to 100 ± 1%. The method detection limit ranged from 144
0.06 (ethane) to 0.34 mg/m3 (3-methyl-1-butene). 145
Carbonyl components in the exhaust were collected in commercially available cartridges filled 146
with 2,4-dinitrophenylhydrazine (Supelco). The cartridge was first extracted with an aliquot of 2 147
mL acetonitrile (Merck) in the laboratory. The extraction step was repeated with 5 mL 148
acetonitrile. The extraction solution was injected into a high performance liquid chromatographer 149
(Hewlett Packard 1100 series HPLC) equipped with an auto sampler (Hewlett Packard G1313A) 150
and an ultraviolet-visible detector (Hewlett Packard). A total of 15 carbonyl compounds were 151
analyzed. Each carbonyl compound was quantified by its liquid standard calibration curve 152
(Supelco). The r2 of the carbonyl calibration curves was higher than 0.9999, the relative standard 153
deviation was less than 5%, the accuracy ranged from 100 ± 2% to 103 ± 1%, and the method 154
detection limit ranged from 6.46 μg/m3
(acetone) to 222 μg/m3 (2,5-dimethylbenzenealdehyde). 155
Background samples (room air) were also collected in the dynamometer laboratory and 156
deducted from the test results. The results indicated that the VOC concentration was <176 mg/m3 157
(toluene), and the VOC concentration of the dynamometer laboratory was negligible or less than 158
10-3 times that of the motorcycle exhaust. 159
160
Toxicity analysis 161
Six major air toxics, benzene, toluene, ethylbenzene, xylene (BTEX), formaldehyde, and 162
acetaldehyde, were selected as target pollutants for evaluating the toxicity of emissions of each 163
test fuel. Common indicators of toxicological validation of air toxics, included the toxic 164
equivalency factor, toxic equivalence, cancer unit risk, and hazard quotients. The first two 165
indicators are estimates of the toxicity of dioxin and dioxin-like compounds, and the other two 166
are used to assess the health risk of hazardous air pollutants. A method adapted from Wu and 167
Pratt (2001) was applied in this study to account for the inhalation toxicity of air toxics in the 168
emission ranking. The toxicity-based emission ranking was calculated by dividing the total mass 169
of emissions of each air toxic by the related health benchmark. The total mass emission of each 170
pollutant was calculated using an emission factor based on vehicle kilometers traveled (VKT), 171
and the average VKT for motorcycles with 101-125 cm3 displacement is 4,930 km per year in 172
Taiwan (Hu et al., 2006). 173
Three types of inhalation health benchmarks were used: for cancer, acute effects, and chronic 174
effects. The health benchmarks for cancer represent the concentrations that are associated with an 175
upper-bound excess lifetime cancer risk of 1 in 100,000. The health benchmarks for acute and 176
chronic effects represent the exposure concentrations that do not cause significant risk of harmful 177
effects for the specified length of exposure (i.e., 1 hr and more than 1 year, respectively) (Wu and 178
Pratt, 2001). The toxicity values for six air toxics are shown in Table 3. The health benchmarks 179
were obtained from the following sources: 180
(1) US EPA Integrated Risk Information System (IRIS) (U.S. EPA, 2010b); and 181
(2) California Environmental Protection Agency, California Air Resources Board and Office of 182
Environmental Health Hazard Assessment (CARB/OEHHA, 2009) 183
The cancer risk values of the carcinogens (i.e. benzene, formaldehyde, and acetaldehyde) were 184
from the U.S. EPA IRIS, and the data for the acute and chronic inhalation of the air toxics was 185
from CARB/OEHHA, because the U.S. EPA does not provide acute or chronic dose-response 186
values. 187
188
Results and Discussion 189
Emissions of organic air pollutants 190
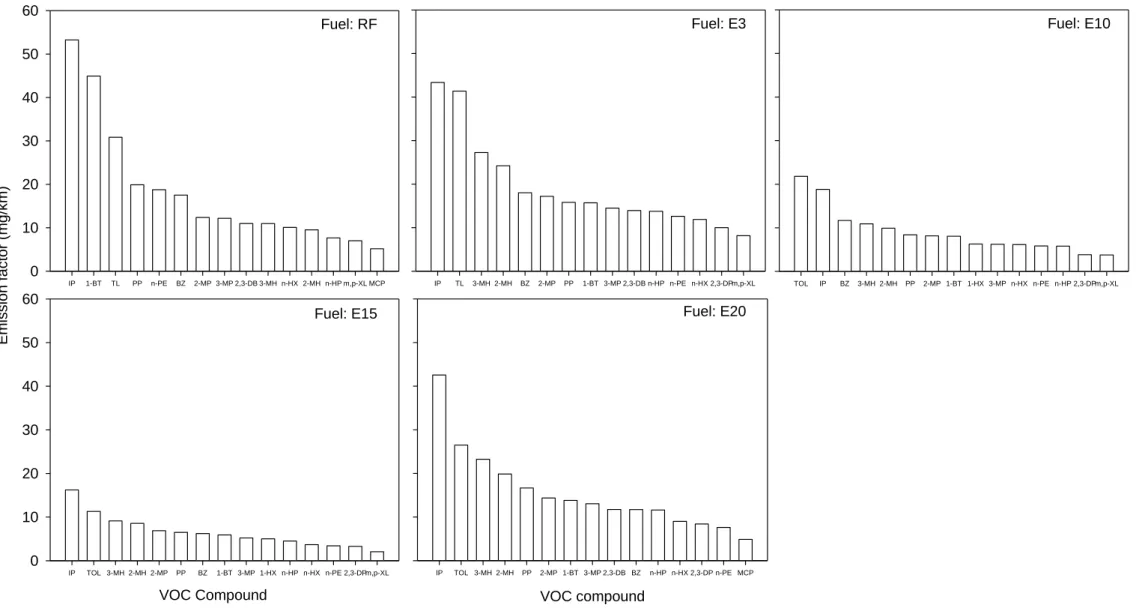
The total organic air pollutant emission factor, i.e., the sum of alkanes (27 species), alkenes 191
(13 species), aromatics (16 species), and carbonyls (15 species), of the reference fuel was 360 192
mg/km (Table 4). Figures 1 and 2 illustrate the major VOC species and carbonyl species 193
emission factors (mg/km) of a four-stroke motorcycle exhaust for various ethanol blends, 194
respectively. For all test fuels, isopentane and toluene are the compounds with the highest 195
emissions accounting for 23, 22, 21, 18, and 19% of total organic air pollutant emissions for RF, 196
E3, E10, E15, and E20 fuels, respectively. 197
The E3 fuel has the highest emission factor, with a value of 394 mg/km, which is 9% higher 198
than that of the RF. The oxygen content of E3 blend (1.0 % by weight) is lower than that of the 199
RF (1.8 % by weight), because the RF fuel has MTBE as the oxygenated additive, and the 200
oxygen content in turn certainly influences the combustion efficiency of the motorcycle. 201
Moreover, the fuel specifications show that the olefin, naphthene, aromatic, and benzene content 202
levels in E3 fuel were the highest among the test fuels. The high VOC emissions for E3 fuel may 203
be attributed to its heavy carbon content. Figure 1 shows that most of the detected alkane 204
compound detection levels for E3 were higher than those of RF, except isopentane and n-pentane. 205
Similar results were obtained for aromatic compounds, with the emissions of toluene, benzene, 206
and m,p-xylene also being higher for E3 fuel. 207
The E15 blend exhibited the lowest organic compound emissions (152 mg/km) among the test 208
fuels and the greatest organic compound emission reduction (near 60%) as compared to RF. 209
Oxygen content in E15 was higher than that in RF, whereas aromatic and naphthene content 210
levels were lower than those in RF. E10 (196 mg/km) also had an emission reduction of 45 % as 211
compared to that of RF and its oxygen content was lower than that of RF. For E15 and E10, most 212
detected organic compound emissions were lower than those of RF (Figure 1), while carbonyl 213
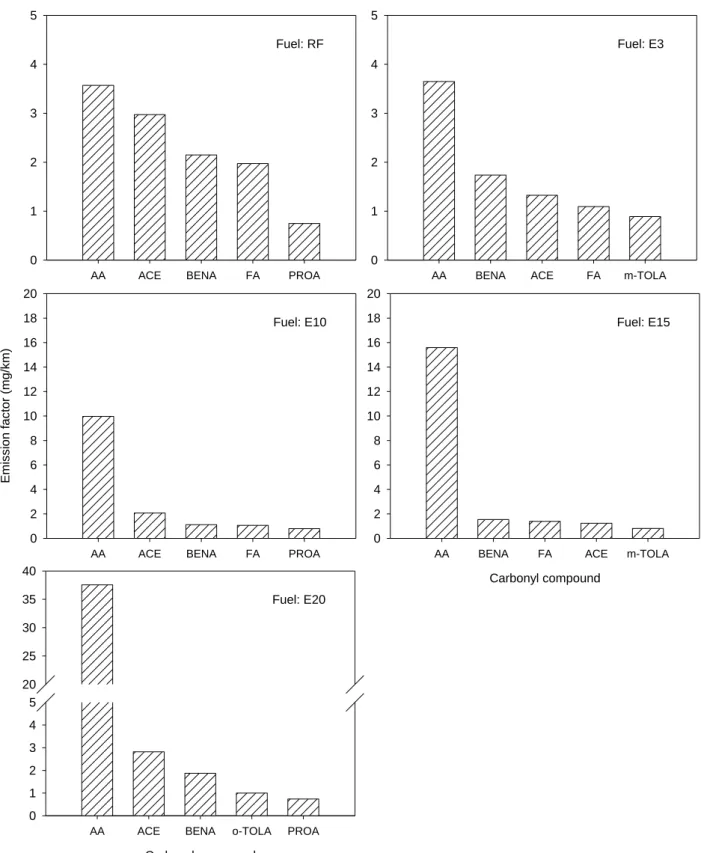
compound emissions were higher (Figure 2). The carbonyl compound emission factors were 11.2, 214
18.0, 24.4, 47.6, and 13.8 mg/km for E3, E10, E15, E20, and the RF, respectively. In general, the 215
emission factors of the RF were lower than those of the ethanol blends (expect E3 fuel). It is 216
noteworthy that acetaldehyde emissions were extremely high when ethanol-blend fuels were 217
combusted in the motorcycle engine. As shown in Figure 2, acetaldehyde emissions for 218
ethanol-gasoline blends were 1.8- to 9.5-fold higher than those of RF. 219
E20 had organic compound emissions (363 mg/km) similar to those of RF (360 mg/km). The 220
excess air ratio (λ) of E20 (λ = 1.15 to 1.21 for the driving pattern) was outside the typical range 221
for gasoline engines (0.9-1.1). At the same conditions, the λ values were 1.01 to 1.04 for RF. 222
This implies that the E20 blend results may not be relevant for motorcycles equipped with a 223
carburetor engine. Moreover, since the test motorcycle could not adjust the intake rate of air into 224
the engine, the high oxygen level in E20 fuel caused the engine to operate over a certain lean 225
limit (λ > 1.1), and incomplete combustion thus occurred in the combustion chamber, leading to 226
increased hydrocarbon emissions (Hochgreb, 1998; Al-Farayedhi et al., 2000). 227
In addition, according to the properties of the test fuels shown in Table 1, the carbon, 228
hydrogen, and oxygen content of the test fuels were all different. Under the assumption of carbon 229
balance, we calculated the proportion of CO2 mass (as C) to the total carbon mass (g-C/g-fuel) of
each test fuel. The results show that the E15 blend had the highest proportion of CO2 (93%) in
231
comparison with the other test fuels, and the value was 89 % for E3, 92 % for E10, and 91 % for 232
E20. This result implies that combustion with E15 blend was more complete than with the other 233
test fuels. This may be one of the reasons for the low levels of organic compound emissions 234
observed in E15 in the present study. 235
236
Emissions of four chemical groups of analyzed VOCs 237
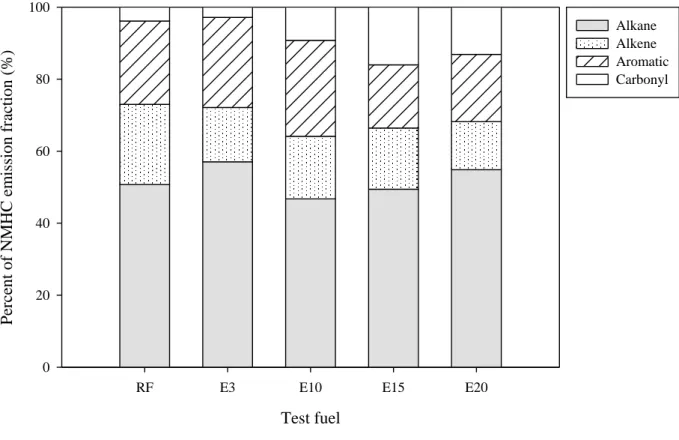
The 71 species of analyzed VOCs were divided into four groups: alkanes, alkenes, aromatics, 238
and carbonyls. Table 4 shows the VOC group emission factors (mg/km). Figure 3 shows the 239
percentage of four chemical groups of the total organic compound emissions for various test 240
fuels. For the RF, the order in mg/km was alkane (183) > aromatic (83) > alkene (80) > carbonyl 241
(14). The contributions from the alkane, aromatic, alkene, and carbonyl groups were 51, 23, 22, 242
and 4%, respectively. For the ethanol blends, the order was the same as that for RF. The 243
contributions ranged from 47-57 %, 17–27 %, 13–17 %, and 3-16 %, respectively, for the alkane, 244
aromatic, alkene, and carbonyl groups. Alkanes contributed the highest amount of emissions for 245
all test fuels. The percentages of alkanes in E3 and E20 were higher than those in the RF. On the 246
other hand, the percentages of alkenes and aromatics in the RF were higher than those of the 247
ethanol blends. The percentage of carbonyl contribution was higher for ethanol-blend gasoline. 248
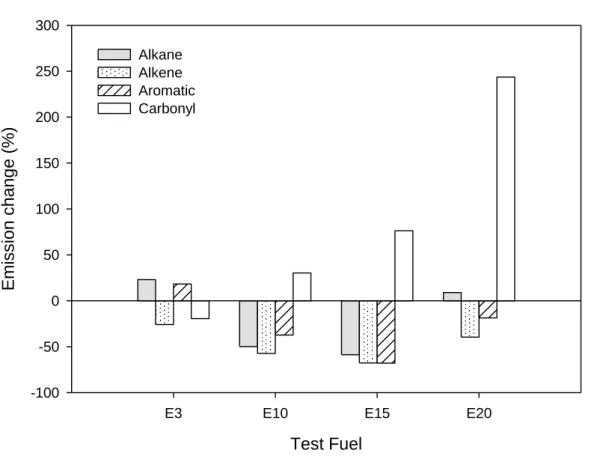
Compared to the RF, the alkane, alkene, and aromatic percentages decreased for E15 fuel, and 249
the differences were -59, -68, and -68 %, respectively (see Figure 4). E10 fuel also exhibited 250
reductions in these three chemical groups (by 37-57 %). In contrast, the emissions of the 251
carbonyl group greatly increased for ethanol blends, and the emission factors rose by 30 % (E10), 252
76 % (E15), and 244 % (E20) as compared to those of the RF. As mentioned previously, high 253
acetaldehyde and acrolein emissions are the main cause of high carbonyl group emissions for 254
ethanol blends. 255
For the four groups (alkane, alkene, aromatic, and carbonyl) the addition of oxygenated 256
content (for E10, E15, and E20) decreased the exhaust alkene and aromatic emissions by 40-68 257
% and 19-68 %, respectively, in terms of emission factor per distance, and by 41-65 % and 20-65 258
%, respectively, in terms of emission factor by fuel consumption. The results also show that the 259
ethanol blends emitted more carbonyl compounds than did the RF, expect the E3 fuel. Carbonyl 260
emissions increased with increasing ethanol content, and high acetaldehyde emissions are the 261
main cause of high carbonyl group emissions for ethanol blends. 262
Alkenes play a significant role in the formation of aldehydes (Altshuller 1991; Grosjean et al., 263
1996), and a large decrease in alkene emissions (40-68 %) with increasing ethanol level was 264
found in the present study. The reduction of alkene emissions may offset some of the increase in 265
direct aldehyde emissions and secondary aldehyde formation from emissions of ethanol-gasoline 266
blend, especially formaldehyde and acetaldehyde. Since the major air toxics emitted during 267
ethanol gasoline combustion include benzene, toluene, ethylbenzene, xylene, formaldehyde, 268
acetaldehyde, and 1,3-dutadiene, the net effect of ethanol-gasoline blends on air toxics levels in 269
the ambient air needs further evaluation. Furthermore, the use of ethanol-gasoline blends in 270
general results in a more than 45 % reduction in VOC emissions in our study, and this may 271
positively influence ozone formation and air quality if there is a large-scale switch to ethanol 272
blends, especially in highly motorized cities (USAID, 2009). 273
274
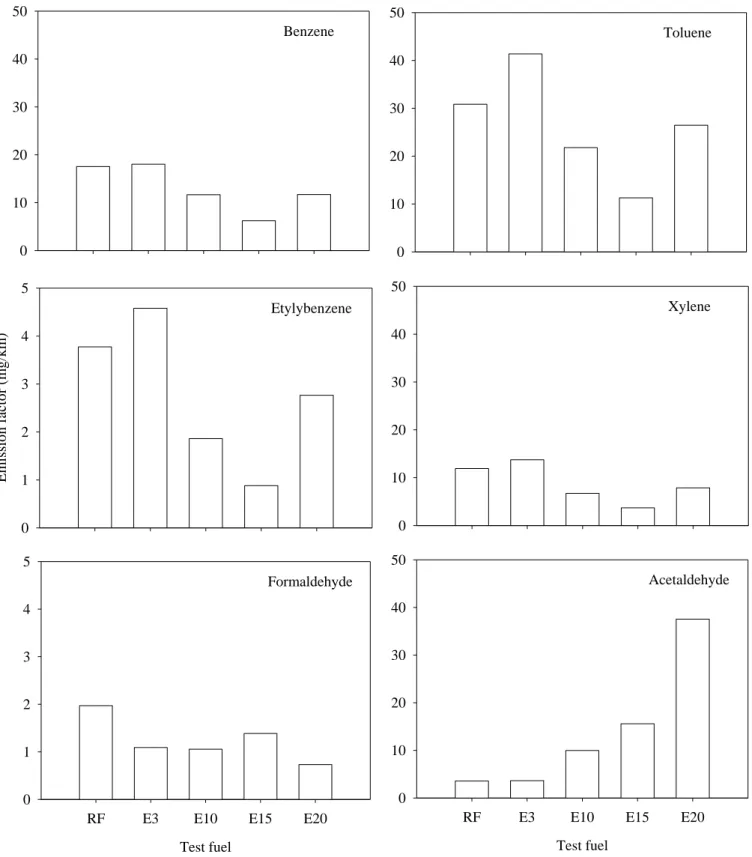
Emissions of air toxics 275
Six major air toxics, BTEX, formaldehyde, and acetaldehyde, were selected as target pollutant 276
according to the results of previous studies (Tsai et al., 2003; Jia et al., 2005). Figure 5 shows the 277
emission factors (mg/km) of air toxics for the ethanol-blended gasolines. An analysis of the 278
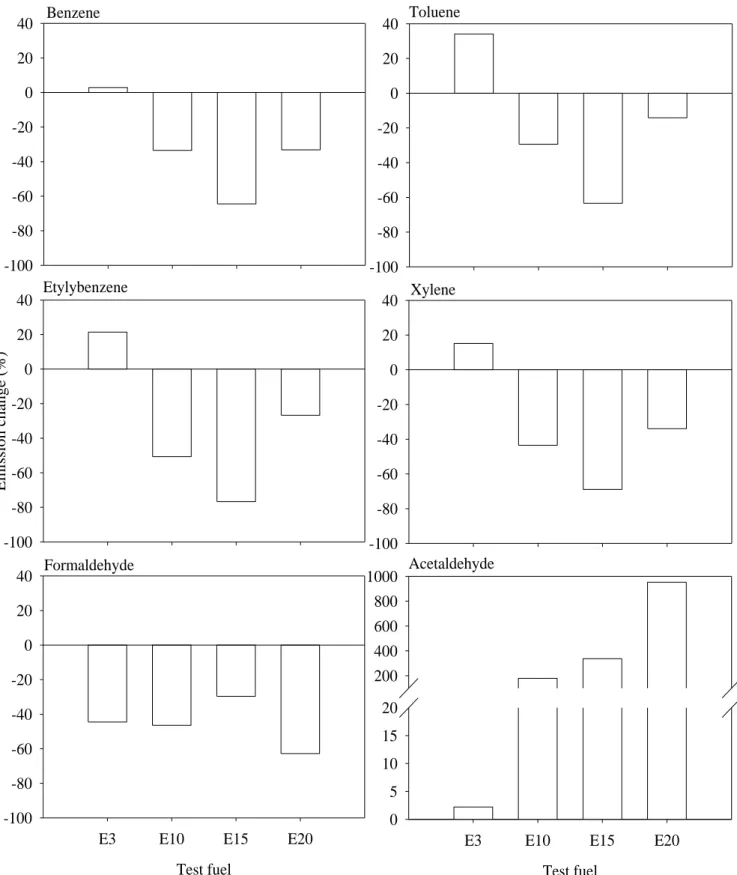
effects of ethanol-blend gasoline was carried out by calculating the emission variance of air 279
toxics for various ethanol fuels as compared to the reference fuel, and the results are shown in 280
Figure 6. 281
For the aromatic air toxics, BTEX, the results show significant reductions for E15 compared to 282
the reference fuel (Figure 6), and reductions of 64 % for benzene, 63 % for toluene, 77% for 283
ethylbenzene, and 69 % for xylene were obtained. E10 and E20 also showed emission reductions 284
in the range of 29-51 % and 14-34 %, respectively, for the four aromatic compounds as 285
compared to RF. However, the emissions increased by about 3, 34, 21, and 15 % for benzene, 286
toluene, ethylbenzene, and xylene, respectively, for E3 fuel. 287
Benzene emissions from the test motorcycle decreased with ethanol content in the gasoline. 288
These results are consistent with those reported in previous studies (Poulopoulos et al., 2001; 289
Zervas et al., 2004a). The lowest and highest benzene emissions were observed for E15 and E3, 290
respectively. The benzene content in gasoline provides the majority of exhaust benzene. Besides 291
being present in the fuel itself, benzene is also emitted from the tailpipe as a result of its 292
formation during the combustion process involving other fuel components, such as 293
alkylaromatics and cyclohexane (Zervas et al., 1999). For fuel aromatics, the benzyl radical is 294
formed by dealkylation and then combines with hydrogen to produce benzene. This reaction is 295
more important at condition of lack of oxygen (Zervas et al., 2004a), as in the case for E3. The 296
benzene, aromatic, and naphthene content levels in E3 were the highest among all of the test 297
fuels. In contrast, they were the lowest in E15. 298
Toluene emissions also decreased for ethanol-blended fuels. Compared to RF, toluene 299
emissions were reduced by 14 to 63 % for ethanol blends. The majority of exhaust toluene comes 300
from unburned fuel. Some heavy aromatics may dealkylate into toluene (Goodfellow et al., 1996; 301
Zervas et al., 2004b), increasing toluene exhaust emissions. Ethylbenzene emissions significantly 302
decreased for the ethanol-blended fuels by 77 % (E15), 51 % (E10), and 27 % (E20). Exhaust 303
ethylbenzene may come from unburned fuel. Fuel toluene and o-xylene may lose a hydrogen 304
atom or methane molecule to form Φ-CH2, which reacts with a methyl to produce ethylbenzene.
305
Xylene emissions also showed a significant decrease (34 to 69 %) for ethanol-blended fuels, and 306
this air toxic does not come from other fuel aromatics, but is only the product of unburned fuel 307
(Zervas et al., 2004a). 308
For aldehydes, the results show that ethanol-blended fuels produce less formaldehyde than RF 309
does. In general, formaldehyde decreased with increasing ethanol content. A 30 to 63 % 310
reduction in formaldehyde emissions was obtained from the test motorcycle without a catalytic 311
converter for the ethanol-gasoline blends. The literature has reported that exhaust formaldehyde 312
is produced from fuel methanol, ethanol, and MTBE (Reuter et al., 1992; Stump et al., 1994; 313
Kirchstetter et al., 1996), and some studies have shown that levels of formaldehyde may 314
decrease or remain constant for ethanol-blended gasoline with an ethanol content of below 30 % 315
(Warner-Selph and Harvey, 1990; Guerrieri et al., 1995; Knapp et al., 1998; Schifter et al., 2005). 316
Moreover, increasing fuel aromatic content may decrease formaldehyde emissions (Petit and 317
Montagne, 1993). E15 and E20 have lower aromatic content than the RF, which may enhance 318
formaldehyde reduction. E3 and E10 fuels also show large emission reductions as compared to 319
the emissions of the RF and oxygen content may thus play an important role in carburetor 320
motorcycle engines. 321
The exhaust acetaldehyde emissions for ethanol-gasoline blends were 1.8- to 9.5-fold those for 322
the RF. The emissions increased with ethanol content, and many studies have shown that fuel 323
ethanol increases acetaldehyde emissions and that MTBE has no effect (Zervas et al., 1999; 324
Poulopoulos et al., 2001; Jia et al., 2005), which is consistent with our results. Acetaldehyde is 325
mainly produced from ethanol. The oxygen content of the fuel favors the oxidation of the 326
acetaldehyde produced during the combustion process. Acetaldehyde is produced through the 327
partial oxidation of ethanol (Poulopoulos et al., 2001) and straight-chain hydrocarbons enhance 328
its formation (Zervas et al., 2002). 329
In brief, the effects of using ethanol-gasoline blends on the air toxics emissions (i.e., BTEX, 330
formaldehyde, and acetaldehyde) from a carburetor motorcycle without a catalytic converter 331
were studied in this work. The results show that the addition of ethanol up to 15 % by volume 332
generally caused a decrease in the air toxics emissions. However, acetaldehyde emissions 333
significantly increased for ethanol fuels, and were almost 10-fold higher in some cases as 334
compared to the emissions for the RF. 335
336
Preliminary toxicity assessment 337
The toxicity assessment was conducted using toxicity-based emission ranking. As mentioned 338
before, the ranking was calculated by dividing the total mass of emissions of each air toxic by the 339
related inhalation health benchmark (within the appropriate categories of cancer, acute, and 340
chronic effects, as shown in Table 3). Table 5 shows the air toxics mass-based and toxicity-based 341
emissions ranking for the five test fuels. 342
For carcinogenic toxics, i.e., benzene, formaldehyde, and acetaldehyde, the emission ranking 343
of the test fuels for each toxic was inconsistent based on the health benchmark of cancer. The 344
cancer-based emissions of the six air toxics were summed and the test fuels were ranked by total 345
emissions. The result shows that the fuel with the highest emissions in terms of carcinogenic 346
effects was E20, and the high mass emission (185.2 g/year) and low cancer health benchmark 347
(0.5 μg/m3
) of acetaldehyde were responsible for this. The acetaldehyde emissions of E20 were 348
2- to 11-fold higher than those for the other four test fuels (or 17.6-76.9 g/year). E15 also had a 349
high ranking for the same reasons as E20, and was ranked second in terms of carcinogenic 350
effects. In contrast, E3 had the lowest cancer effect among all the tested fuels. The cancer-based 351
emissions of E20 were 1.8- to 2.7-fold higher than those of the other test fuels. 352
The emission rankings for acute effects were the same as those for the carcinogenic effects as 353
E20 and E15 had the highest rankings, following by RF, E10, and E3. The acute-effects-based 354
emissions of E20 were 1.6 to 2.4-fold higher than those of the other test fuels, which can be 355
attributed to the high mass emission and low acute-effect value (470 μg/m3) of acetaldehyde in 356
E20. In addition, although E15 had the lowest mass emissions of BTEX, it ranked second based 357
on acute-effects among all the tested fuels. The high emissions and low acute-effect values of 358
formaldehyde and acetaldehyde may be responsible for the high acute effects of E15. 359
The RF had the highest total chronic-effect emissions of the six air toxics, following by E20, 360
E3, E10, and E15. Formaldehyde and benzene have low chronic health benchmark values, at 9 361
and 60 μg/m3, respectively. The high mass-based emissions and low chronic effect values of 362
these two toxics are responsible for the high RF rank. E20 also ranked high because its 363
acetaldehyde mass-based emissions were much higher than those of the other test fuels. 364
In brief, toxicity-based emission rankings for the six air toxics show that E20 and E15 have 365
high emissions in terms of cancer and acute effects while the RF had the highest emissions in 366
terms of the chronic effects. Moreover, the high mass-based emissions and low health benchmark 367
values of acetaldehyde possibly contributed to the high toxicity-based emissions for E20 and E15. 368
The contributions of BTEX to the acute effects are small in comparison to these of acetaldehyde 369
for ethanol-blended gasoline. For the chronic effects of the six air toxics, the RF and E20 had the 370
highest emissions. Notably, E15 had the lowest total mass-based emissions of the air toxics, but 371
it ranked high in the toxicity-weighted emissions based on the cancer and acute effects. In 372
addition, for the six air toxics, the acute health benchmark values were generally higher than 373
those of chronic and cancer health benchmarks by 1-2 orders of magnitude. Therefore, for the 374
purpose of protecting against the most significant health effects, greater emphasis was focused 375
on ranking by cancer and chronic effects. 376
It should be noted that the evaluation of the toxicity-weighed emission were limited to the 377
inhalation route of pollution exposure, and other exposure routes in the environment, such as 378
ingestion of food, intake of drinking water, or direct contact, were not considered. In addition, 379
this ranking is not intended to replace risk assessment, because the emission factor does not 380
equal an exposure estimate. Moreover, health benchmark values are highly conservative, as most 381
of them are based on controlled exposures to laboratory animals at high levels while human 382
exposure in the environment occurs at much lower levels, and thus they may tend to overstate 383
pollutant toxicity (Wu and Pratt, 2001). 384
385
Limitations 386
Some limitations should be noted in this study. First, only one four-stroke carburetor 387
motorcycle was tested in this study and was given small dataset, although it is representative. In 388
order to assess statistical significance of results and provides better representative results, it is 389
recommended that the large sample size is needed by considering the affordable cost. Moreover, 390
in order to emphasize the effects of the ethanol levels in gasoline on organic compound 391
emissions, the test motorcycle was an uncontrolled one to avoid the interference from a catalyst. 392
For application to ethanol blend fueled motorcycles, extensions of this study using catalytic 393
converters for the control of air pollutants are recommended. 394
Finally, the toxicity-weighting emission only considered inhalation exposure, and not the other 395
exposure routes in the environment. Therefore, toxicity-based emission ranking is not intended to 396
replace risk assessment, because the emission factor does not equal an exposure estimate. 397
However, this method does provide a simple way to evaluate emissions data within a context of 398 toxicity. 399 400 Conclusions 401
The influence of ethanol-gasoline blends on organic air toxic emissions (VOCs and carbonyls) 402
from a non-catalyst four-stroke motorcycle without any engine adjustment was investigated. 403
Four types of ethanol blend (3, 10, 15, and 20 % by volume) were tested. The commercial 404
unleaded gasoline (with MTBE) was also tested as reference case. 405
The results of emission factor per distance (mg/km) show that ethanol added into gasoline 406
generally decreases total organic compound emissions, except carbonyl compound emissions. 407
The 15% ethanol blend had the highest emission reductions compared to the RF. For the four 408
organic chemical groups, i.e., alkanes, alkenes, aromatics, and carbonyl, the addition of 409
oxygenated content (for E10, E15, and E20) decreased the exhaust alkene and aromatic 410
emissions by 40-68 % and 19-68 %, respectively. The results also show that the ethanol blends 411
emitted more carbonyl compounds than did the RF. High acetaldehyde emissions are the main 412
reason for the high carbonyl group emissions for the ethanol blends. 413
The addition of ethanol to fuel up to 15 % (vol) generally resulted in a decrease in the selected 414
air toxics emissions. The presence of excess oxygen during combustion also had a significant 415
effect on the emissions of the various oxygenated hydrocarbon species, including air toxics. 416
BTEX and formaldehyde emissions decreased with increasing oxygenated content in gasoline. In 417
addition, the acetaldehyde emission increased significantly for ethanol fuels due to acetaldehyde 418
precursors being rapidly oxidized, which increased its formation in lean conditions. The results 419
for the toxicity-based emissions of air toxics showed that E20 and E15 had the highest emissions 420
in terms of cancer and acute effects while the RF and E20 had the highest emissions based on 421
chronic effects. Notably, E15 had the lowest total mass-based emissions of air toxics, but it 422
ranked highly in toxicity-weighted emissions based on the cancer and acute effects. 423
In conclusion, this research has shown a valid experimental approach to investigate the effects 424
of ethanol-gasoline blends on exhaust emissions, although only one four-stroke carburetor 425
motorcycle was tested. The chassis dynamometer test results showed that ethanol content in 426
gasoline up to 15 vol% is appropriate for carburetor motorcycle without adjustment being made 427
to the engine, with reduction in the emissions of most organic compounds. The toxicity-based 428
emission ranking method thus provides a simple way to evaluate emissions data within a context 429 of toxicity. 430 431 Nomenclature 432
BTEX: benzene, toluene, ethylbenzene, and xylene 433
CARB: California Air Resources Board 434
CSIRO: Commonwealth Scientific and Industrial Research Organisation 435
CPC: China Petroleum Corporation, the largest petroleum refinery in Taiwan 436
E3: Gasoline blend containing 3 % ethanol by volume 437
E10: Gasoline blend containing 10 % ethanol by volume 438
E15: Gasoline blend containing 15 % ethanol by volume 439
E20: Gasoline blend containing 20 % ethanol by volume 440
ECE cycle: Economic Commission for Europe test cycle 441
GC/FID: gas chromatography with flame ionization detection 442
GC/MS: gas chromatography with mass spectrometry 443
HPLC: high performance liquid chromatography 444
Lambda (λ): excess air ratio, the λ is defined as actual air-fuel ratio divided by stoichiometric 445
air-fuel ratio 446
MTBE: methyl tert-butyl ether, used as the oxygenated additive in commercial unleaded 447
gasoline 448
OEHHA: California Environmental Protection Agency, Office of Environmental Health 449
Hazard Assessment 450
RF: reference fuel, i.e., commercial unleaded gasoline which does not contain ethanol 451
RON: research octane number 452
RSD: relative standard deviation 453
TEPA: Taiwan Environment Protection Administration 454
UNDP/ESMAP: United Nations Development Programme/World Bank Energy Sector 455
Management Assistance Programme 456
USAID: United States Agency for International Development 457
U.S. EPA: U.S. Environmental Protection Agency 458
VKT: vehicle kilometers traveled 459
VOC: volatile organic compound 460
461
Acknowledgments 462
This research was partly supported by grants from the National Science Council of the 463
Republic of China under grant NSC 95-2221-E-006-172-MY3. The authors are grateful to the 464
staff of Sanyang Industry and the staff of China Petroleum Company (Taiwan) for performing 465
the chassis dynamometer tests and producing the test fuel blends, respectively. The authors 466
would also like to thank Ms. Wei-Ting Chang and Mr. Kai-Jiun Chang for providing assistance 467
in sampling and analysis. 468
469
References 470
Al-Farayedhi, A.A., Al-Dawood, A.M., and Gandhidasan, P. (2000). Effects of blending crude 471
ethanol with unleaded gasoline on exhaust emissions of SI engine. SAE Technical Paper 472
Series, 2000-01-2857, Society of Automotive Engineers, Warrendale, PA. 473
Al-Hasan, M. (2003). Effect of ethanol-unleaded gasoline blends on engine performance and 474
exhaust emission. Energ. Convers. Manage. 44, 1547. 475
Altshuller, A. P. (1991). Estimating product yields of carbon-containing products from the 476
atmospheric photooxidation of ambient air alkenes. J. Atmos. Chem. 13, 131. 477
California Environmental Protection Agency, Air Resources Board and Office of Environmental 478
Health Hazard Assessment (CARB/OEHHA). (2009). Consolidated Table of OEHHA / ARB 479
Approved Risk Assessment Health Values. The values dated February 2009. Available at: 480
www.3-study.com/redirect.php?url=http://www.arb.ca.gov/toxics/healthval/healthval.htm. 481
Charles, M.B., Ryan, R., Ryan, N., and Oloruntoba, R. (2007). Public policy and biofuels: The 482
way forward? Energ. Policy 35, 5737. 483
Commonwealth Scientific and Industrial Research Organisation (CSIRO)/ Bureau of Transport 484
and Regional Economics (BTRE)/Australian Bureau of Agricultural and Resource Economics 485
(ABARE). (2003). Appropriateness of a 350 ML Biofuels Target. Report to the Australian 486
Government. Canberra, Australia: Australian Government. 487
Goodfellow, C.L., Gorese, R.A., Hawkins, M.J., and McArragher, J.S. (1996). European 488
programme on emission, fuels and engine technologies - Gasoline aromatics/E100 study. SAE 489
Technical Paper Series, 961072. Society of Automotive Engineers, Warrendale, PA. 490
Grosjean, E., De Andrade, J.B., Grosjean, D. (1996). Carbonyl products of the gas-phase 491
reaction of ozone with simple alkenes. Environ. Sci. Technol. 30, 975. 492
Guerrieri, D.A., Caffrey, P.J., and Rao, W. (1995). Investigation into the vehicle exhaust 493
emissions of high percentage ethanol blends. SAE Document Number, 950777, Society of 494
Automotive Engineers, Warrendale, PA. 495
He, B.Q., Wang, J.X., Hao, J.M., Yan, X.G., and Xiao, J.H. (2003). A study on emission 496
characteristics of an EFI engine with ethanol blended gasoline fuels. Atmos. Environ. 37, 949. 497
Hochgreb, S. (1998). Combustion-related emissions in SI engines. In: Sher, E., editor, Handbook 498
of Air Pollution from Internal Combustion Engines, Pollutant Formation and Control. New 499
York: Academic Press, pp.118-170. 500
Hsu, Y.C., Tsai, J.H., Chen, H.W., and Lin, W.Y. (2001). Tunnel study of on-road vehicle 501
emissions and the photochemical potential in Taiwan. Chemosphere 41, 151. 502
Hu, M.H., Cheng, T.C., Chen, Y.H., and Tseng, M.C. (2006). The average annual traveling 503
mileage of motorcycle analysis in Taiwan. Conference of Taiwan Association of Sustainable 504
Development for Environment & Resources, Taoyuan, Taiwan. 505
Jia, L.W., Shen, M.Q., Wang, J., and Lin. M.Q. (2005). Influence of ethanol-gasoline blended 506
fuel on emission characteristics from a four-stroke motorcycle engine. J. Hazard. Mater. 123, 507
29. 508
Kirchstetter, T.W., Singer, B.C., Harley, R.A., Kendall, G.R., and Chan. W. (1996) Impact of 509
oxygenated gasoline use on California light-duty vehicle emissions. Environ. Sci. Technol. 30, 510
661. 511
Knapp, K.T., Stump, F.D., Tejada, S.B. (1998). The effect of ethanol fuel on the emissions of 512
vehicles over a wide range of temperatures. J. Air Waste Manage. 48, 64. 513
Leong, S.T., Muttamara, S., and Laortanakul, P. (2002). Applicability of gasoline containing 514
ethanol as Thailand's alternative fuel to curb toxic VOC pollutants from automobile emission. 515
Atmos. Environ. 36, 3495. 516
Magnusson, R., Nilsson, C., and Andersson, B. (2002). Emissions of aldehydes and ketones from 517
a two-stroke engine using ethanol and ethanol-blended gasoline as fuel. Environ. Sci. Techno. 518
36, 1656. 519
Niven, R.K. (2005). Ethanol in gasoline: Environmental impacts and sustainability review article. 520
Renew. Sustain. Energ. Rev. 9, 535. 521
Payne-Sturges, D.C., Burke, T.A., Breysse. P., Diener-West. M., and Buckley, T.J. (2004). 522
Personal exposure meets risk assessment: A comparison on measured and modeled exposures 523
and risks in an urban community. Environ. Health Persp. 112, 589. 524
Petit, A., and Montagne, X. (1993). Effects of the gasoline composition on exhaust emissions of 525
regulated and speciated pollutants. SAE Technical Paper Series, 932681, Society of 526
Automotive Engineers, Warrendale, PA. 527
Poulopoulos, S.G., Samaras, D.P., and Philippopoulos, C.J. (2001). Regulated and unregulated 528
emissions from an internal combustion engine operating on ethanol-containing fuels. Atmos. 529
Environ. 35, 4399. 530
Reuter, R.M., Benson, J.D., Burns, V., Gorse, R.A., Hauchhauser, A.M., Koehl, W.J., Painter, L.J., 531
Rippon, B.H., and Rutherford, J.A. (1992). Effects of oxygenated fuels and RVP on 532
automotive emissions. SAE Technical Paper Series, 920326, Society of Automotive Engineers, 533
Warrendale, PA. 534
Schifter, I., Díaz, L., and López-Salinas, E. (2005). Hazardous air pollutants from mobile sources 535
in the metropolitan area of Mexico City. J. Air Waste Manage. 55, 1289. 536
Stump, F.D., Knapp, K.T., Ray, W.D., Siudak, P.D., and Snow, R.F. (1994). Influence of 537
oxygenated fuels on the emissions from three pre-1985 light-duty passenger vehicles. J. Air 538
Waste Manage. 44, 781. 539
Taiwan Environment Protection Administration (TEPA). (2001). Directive of the Test Procedure 540
of Air Pollution Emissions Measurement from Motorcycle of the Cold-start Testing. No. 541
Air-0067325. Taipei, Republic of China: Environment Protection Administration. 542
Tsai, J.H., Chiang, H.L., Hsu, Y.C., Weng, H.C., and Yang, C.Y. (2003). The speciation of 543
volatile organic compounds (VOCs) from motorcycle engine exhaust at different running 544
modes. Atmos. Environ. 37, 2485. 545
United Nations Development Programme (UNDP)/World Bank Energy Sector Management 546
Assistance Programme (ESMAP). (2003). Thailand - Reducing emissions from motorcycles in 547
Bangkok. Washington D.C.: The World Bank. 548
United States Agency for International Development (USAID). (2009). Biofuels in Asia: An 549
Analysis of Sustainability Options. Washington, D.C.: USAID. 550
U.S. EPA. (1994). Environmental Fact Sheet- Air Toxics from Motor Vehicles. EPA400-F-92-004. 551
Washington, D.C: U.S. EPA, Office of Transportation and Air Quality. 552
U.S. EPA. (2010a). Final Regulatory Impact Analysis: Changes to Renewable Fuel Standard 553
Program. EPA-420-R-10-006. Ann Arbor, MI: U.S. EPA, Office of Transportation and Air 554
Quality. 555
U.S. EPA. (2010b). Integrated Risk Information System (IRIS). Washington, D.C: U.S. EPA, 556
National Center for Environmental Assessment. Available at: 557
www.3-study.com/redirect.php?url=http://www.epa.gov/iris/ (accessed March 2010). 558
Warner-Selph, M.A., and Harvey, C.A. (1990). Assessment of unregulated emissions from 559
gasoline oxygenated blends. SAE Technical Paper Series, 902131, Society of Automotive 560
Engineers, Warrendale, PA. 561
Wu, C.Y., and Pratt, G.C. (2001). Analysis of air toxics emission inventory: Inhalation 562
toxicity-based ranking. J. Air Waste Manage. 51, 1129. 563
Yao, Y.C., Tsai, J.H., Ye, H.F., and Chiang, H.L. (2009). Comparison of Exhaust Emissions 564
Resulting from Cold- and Hot-Start Motorcycle Driving Modes. J. Air Waste Manage. 59, 565
1339. 566
Yüksel, F., and Yüksel, B. (2004). The use of ethanol-gasoline blend as a fuel in an SI engine. 567
Renew. Energ. 29, 1181. 568
Zervas, E., Montagne, X., and Lahaye, J. (1999). The influence of gasoline formulation on 569
specific pollutant emissions. J. Air Waste Manage. 49, 1304. 570
Zervas, E., Montagne, X., and Lahaye, J. (2002). Emission of alcohols and carbonyl compounds 571
from a spark ignition engine: Influence of fuel and air/fuel equivalence ratio. Environ. Sci. 572
Technol. 36, 2414. 573
Zervas, E., Montagne, X., and Lahaye, J. (2004a). Influence of fuel and airfuel equivalence ratio 574
on the emission of hydrocarbons from a SI engine: 2. Formation pathways and modelling of 575
combustion processes. Fuel 83, 2313. 576
Zervas, E., Montagne, X., and Lahaye, J. (2004b). Influence of fuel and airfuel equivalence ratio 577
on the emission of hydrocarbons from a SI engine: 1. Experimental findings. Fuel 83, 2301. 578
579
Please address correspondence to: Jiun-Horng Tsai, Department of Environmental Engineering, 580
National Cheng Kung University, Tainan City, 701, Taiwan, Republic of China; phone: 581
866-6-275-1084; fax: _886-6-208-3152; e-mail: [email protected]. 582
Figure Captions
Figure 1. Top 15 VOC species emission factors in four-stroke motorcycle exhaust for various ethanol blends.
Figure 2. Top five carbonyl species emission factors in four-stroke motorcycle exhaust for various ethanol blends.
Figure 3. Percentage contribution of four chemical groups to the analyzed VOCs for various ethanol blends. (The percentage is calculated based on emission factor per distance) Figure 4. Emission variance of four chemical groups to the analyzed VOCs for ethanol blends
as compared to that of the RF. (The variance is calculated based on emission factor per distance)
Figure 5. Air toxics emission factors (mg/km) for the ethanol-blended gasoline.
Table 1
Properties of test fuels.
Fuel property RF*1
Ethanol-blended gasoline
E3 E10 E15 E20
Research octane number 95.0 94.9 95.1 95.2 95.1
Ethanol (vol%) 0 2.9 9.8 14.7 17.9 MTBE (vol%) 10.3 0 0 0 0 Oxygen content (wt%) 1.8 1.0 3.4 5.2 6.1 Aromatics (vol%) 29.9 37.0 31.6 22.9 20.2 Paraffins (vol%) 10.6 8.1 8.8 8.4 8.2 Olefins (vol%) 10.6 17.0 11.3 15.2 12.3 Naphthenes (vol%) 5.9 6.5 5.7 5.8 6.0 Benzene (vol%) 0.6 0.9 0.7 0.6 0.5 Heating value (J/g) 2577 2570 2526 2501 2446
Low heating value (J/g) 2450 2446 2397 2370 2308
Latent heat (J/g) 127 124 129 130 137
*1
RF is a commercial unleaded gasoline manufactured by the largest petroleum refinery in Taiwan
Table 2
Specifications of the test motorcycle.
Item Specification
Manufacturer KYMCO
Model GT 125
Displacement 125 cm3
Odometer 0 km
Fuel supply system Carburetor
Engine type Four-stroke, single (horizontal)
Ignition system Capacitor discharge ignition
Compression ratio 8.6:1
Maximum power 6.8 kW/7500 rpm
Cooling system Air-Cooled
Air pollution prevention device
Three-way catalyst No Air injection system No
Table 3
Health benchmarks for cancer, acute, and chronic effects.
Air toxics Cancer (μg/m3) Cancer data source Acute (μg/m3) Acute data source Chronic (μg/m3) Chronic data source
Benzene 1.3E+00 IRIS 1.3E+03 CARB/OEHHA 60 CARB/OEHHA
Toluene ---*1 3.7E+04 CARB/OEHHA 300 CARB/OEHHA
Ethylbenzene --- --- CARB/OEHHA 2000 CARB/OEHHA
Xylene (mixed isomers) --- 2.2E+04 CARB/OEHHA 700 CARB/OEHHA
Formaldehyde 8.0E-02 IRIS 5.5E+01 CARB/OEHHA 9 CARB/OEHHA
Acetaldehyde 5.0E-01 IRIS 4.7E+02 CARB/OEHHA 140 CARB/OEHHA
*1
Table 4
Emissions (mg/km) of organic air pollutants from the four-stroke motorcycle for ethanol-blended gasolines.
Test fuel*1 Oxygen content (wt%)
Emission factor (mg/km)
VOCs*1
VOC Group
Alkanes Alkenes Aromatics Carbonyls
RF 1.87 360 183 80 83 148 E3 1.04 394 (9%)*2 225 59 99 11 E10 3.51 196 (-46%) 92 34 52 18 E15 5.36 152 (-58) 75 26 27 24 E20 6.49 363 (1%) 199 48 68 48 *1
EF of VOCs is the sum of alkanes (28 species), alkenes (12 species), aromatics (16 species), and carbonyls (15 species).
*2
Table 5
Ranking of air toxics emissions based on mass and toxicity for ethanol-blended gasolines. Test Fuel
Mass emission (g/year) RF E3 E10 E15 E20
Benzene 86.5 89.0 57.5 30.7 57.8 Toluene 152.2 204.0 107.5 55.8 130.6 Ethylbenzene 18.6 22.6 9.2 4.3 13.6 Xylene 58.8 67.7 33.2 18.3 38.9 Formaldehyde 9.7 5.4 5.2 6.8 3.6 Acetaldehyde 17.6 18.0 49.2 76.9 185.2 Total 343.4 406.7 261.8 192.8 429.8 Ranking by emission Benzene 2 1 4 5 3 Toluene 2 1 4 5 3 Ethylbenzene 2 1 3 4 5 Xylene 2 1 4 5 3 Formaldehyde 1 3 5 4 2 Acetaldehyde 5 4 3 2 1 Total 3 2 4 5 1
Ranking by cancer effects
Benzene 2 1 4 5 3 Toluene Ethylbenzene Xylene Formaldehyde 1 3 4 2 5 Acetaldehyde 5 4 3 2 1 Total 3 5 4 2 1
Ranking by acute effects
Benzene 2 1 4 5 3 Toluene 2 1 4 5 3 Ethylbenzene Xylene 2 1 4 5 3 Formaldehyde 1 3 4 2 5 Acetaldehyde 5 4 3 2 1 Total 3 5 4 2 1
Ranking by chronic effects
Benzene 2 1 4 5 3 Toluene 2 1 4 5 3 Ethylbenzene 2 1 4 5 3 Xylene 2 1 4 5 3 Formaldehyde 1 3 4 2 5 Acetaldehyde 5 4 3 2 1 Total 1 3 4 5 2 *1
Fig. 1. Top 15 VOC species emission factors in four-stroke motorcycle exhaust for various ethanol blends. (1-BT: 1-butene; 1-HX: 1-hexene; 2-MH: 2-methlyhexane; 2-MP: 2-methylpentane; 3-MH: 3-methylhexane; 3-MP: 3-methylpentane; 2,3-DB: 2,3-dimethylbutane; 2,3-DP: 2,3-dimethylpentane; BZ: benzene; n-HP: n-heptane; n-HX: n-hexane; IP: isopentane; MCP: methylcyclopentane; n-PE: n-pentane; PP: propylene; TL: toluene; m,p-XL:
Fuel: RF IP 1-BT TL PP n-PE BZ 2-MP 3-MP 2,3-DB 3-MH n-HX 2-MH n-HP m,p-XL MCP 0 10 20 30 40 50 60 Fuel: E10 TOL IP BZ 3-MH 2-MH PP 2-MP 1-BT 1-HX 3-MP n-HX n-PE n-HP 2,3-DPm,p-XL Fuel: E20 VOC compound IP TOL 3-MH 2-MH PP 2-MP 1-BT 3-MP 2,3-DB BZ n-HP n-HX 2,3-DP n-PE MCP Fuel: E15 VOC Compound IP TOL 3-MH 2-MH 2-MP PP BZ 1-BT 3-MP 1-HX n-HP n-HX n-PE 2,3-DPm,p-XL E m ission f act or (m g/ km ) 0 10 20 30 40 50 60 Fuel: E3 IP TL 3-MH 2-MH BZ 2-MP PP 1-BT 3-MP 2,3-DB n-HP n-PE n-HX 2,3-DPm,p-XL
Fig. 2. Top five carbonyl species emission factors inf four-stroke motorcycle exhaust for various ethanol blends. (AA: acetaldehyde; ACE: acetone; BENA: benzaldehyde; FA: formaldehyde; PROA: propionaldehyde; m-TOLA: m-tolualdehyde; o-TOLA:
o-tolualdehyde)
Fuel: RF
AA ACE BENA FA PROA
0 1 2 3 4 5 Fuel: E3
AA BENA ACE FA m-TOLA
0 1 2 3 4 5 Fuel: E10 Carbonyl compound
AA ACE BENA FA PROA
Em is s ion fac tor (mg/k m) 0 2 4 6 8 10 12 14 16 18 20 Fuel: E15 Carbonyl compound
AA BENA FA ACE m-TOLA
0 2 4 6 8 10 12 14 16 18 20 Fuel: E20 Carbonyl compound
AA ACE BENA o-TOLA PROA
0 1 2 3 4 5 20 25 30 35 40
Fig. 3. Percentage contribution of four chemical groups to the analyzed VOCs for various ethanol blends. (The percentage is calculated based on emission factor per distance)
Test fuel
RF E3 E10 E15 E20
Pe rce nt of NM HC em iss ion fr ac ti on (%) 0 20 40 60 80 100 Alkane Alkene Aromatic Carbonyl
Fig. 4. Emission change (%) of four chemical groups to the analyzed VOCs for ethanol blends as compared to that of the RF. (The variance is calculated based on emission factor per distance)
Test Fuel
E3 E10 E15 E20
Emiss ion c hange (%) -100 -50 0 50 100 150 200 250 300 Alkane Alkene Aromatic Carbonyl
*EF of xylene was the sum of m,p-xylene and o-xylene.
Fig. 5. Air toxics emission factors (mg/km) for the ethanol-blended gasoline. Benzene 0 10 20 30 40 50 Toluene 0 10 20 30 40 50 Etylybenzene Em is si o n f ac to r (m g /k m ) 0 1 2 3 4 5 Xylene 0 10 20 30 40 50 Formaldehyde Test fuel
RF E3 E10 E15 E20
0 1 2 3 4 5 Acetaldehyde Test fuel
RF E3 E10 E15 E20
0 10 20 30 40 50
Fig. 6. Emission change (%) of the air toxics for ethanol blends as compared to that of the RF. Benzene -100 -80 -60 -40 -20 0 20 40 Toluene -100 -80 -60 -40 -20 0 20 40 Etylybenzene Em is si o n ch an g e ( %) -100 -80 -60 -40 -20 0 20 40 Xylene -100 -80 -60 -40 -20 0 20 40 Formaldehyde Test fuel
E3 E10 E15 E20
-100 -80 -60 -40 -20 0 20 40 Acetaldehyde Test fuel
E3 E10 E15 E20
0 5 10 15 20 200 400 600 800 1000