SCRS/00/72
AGE-SPECIFIC ABUNDANCE INDICES OF YELLOWFIN TUNA FOR
TAIWANESE LONGLINE FISHERY IN THE ATLANTIC
Chien-Chung Hsu, Yu-Ming Yeh and Hsi-Chiang Liu
Institute of Oceanography, National Taiwan University, P. O. Box 23-13, Taipei, Taiwan SUMMARY
The nominal catch per unit effort for yellowfin tuna (Thunnus albacares) by the Taiwanese longline fishery was standardized by general linear model with log-normal error structure for the total Atlantic. The catch-at-size was sliced; the catch-at-age was used to derive age-specific catch per unit effort. The standardized catch per unit effort for total Atlantic yellowfin tuna tended to decrease from 1968 to 1975, and increased from the lowest level in 1975 to the highest level in 1995, then decreased abruptly again until 1998 . The catch per unit effort for age groups 1 and 2; 1 and 3; 2 and 3; and 3 and 5 showed significant correlation, but on investigating this tendency, the results showed neither a strong nor a weak year class
.
RÉSUMÉ
La capture nominale par unité d’effort de l’albacore (Thunnus albacares) pêché par les palangriers du Taïpei chinois a été standardisée pour l’ensemble de l’Atlantique par le modèle linéaire généralisé avec une structure lognormale de l’erreur. La prise par taille a été découp ée: la prise par âge a servi à calculer la capture par unité d’effort spécifique de l’âge. La capture standardisée par unité d’effort de l’albacore dans tout l’Atlantique tendait à baisser de 1968 à 1975; elle s’est accrue, de son niveau le plus faible en 1975, à son niveau le plus élevé en 1995, puis a ensuite chuté brusquement de nouveau jusqu’en 1998. La prise par unité d’effort des groupes d’âges 1 et 2, 1 et 3, 2 et 3, et 3 et 5 montraient une corrélation significative, mais les recherches sur cette tendance n’on révélé aucune classe annuelle forte ou médiocre.
RESUMEN
La captura por unidad de esfuerzo nominal para el rabil (Thunnus albacares ) de la pesquería de palangre de Taipei Chino fue estandarizada por un modelo lineal general con una estructura de error lognormal para el total del Atlántico. La captura por talla fue dividida; la captura por edad se utilizó para derivar la captura por unidad de esfuerzo específica de la edad. La captura por unidad de esfuerzo estandarizada para el rabil del total del Atlántico tendía a descender desde 1968 hasta 1975, y a incrementarse desde el nivel más bajo en 1975 hasta el nivel más alto en 1995, seguida de un descenso brusco de nuevo hasta 1998. La captura por unidad de esfuerzo para los grupos de edad 1 y 2; 1 y 3; 2 y 3; y 3 y 5 presentaba una correlación significativa, pero al investigar esta tendencia, los resultados mostraron una clase anual ni fuerte ni débil.
INTRODUCTION
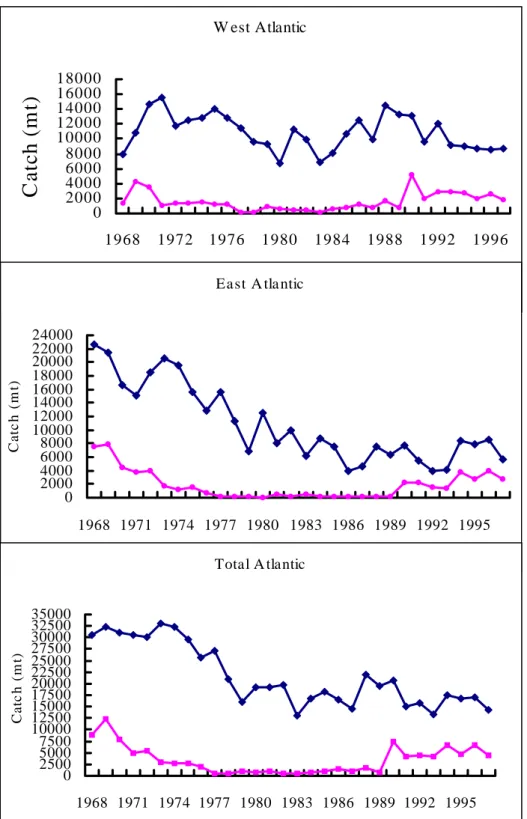
As known as the deep longline fishing type has been applied in the Atlantic to fish bigeye tuna since 1990 by Taiwanese fishermen. Moreover, the catch of yellowfin tuna is still in a by-catch status, but the catch increased significantly from at that time.
Catches of yellowfin tuna in the west, east and total Atlantic (Fig. 1) indic ates that Taiwanese fish the species during the late 1960s and after 1990 (Anon. 1999). The catches are about 40% of the longline catches annually from 1990. Nonetheless, the catches are still minor in comparison with total catches including those by surface gears. Thus, increasing catches recently by Taiwanese longline gear is apparently due to the deep longline fishing type to target bigeye tuna. To respond this special fishery status, the standardized catch per unit effort and standardized age-specif ic catch per unit effort were derived by general linear model in using daily logbook from 1981 to 1998, instead reported previously (Ma and Hsu 1997).
Therefore, this report is to derive the standardized catch per unit effort for the west, east and total Atlantic stocks, and to derive age-specific abundance indices for Taiwanese longline fishery.
MATERIALS AND METHODS 1. Data used
The catch (in number of fish caught), effort (in hooks) and size measurement data (in 1 cm) of Taiwanese longline fishery in the Atlantic were used from 1981 to 1998. Based on data attributes, the data set can be divided into at least two time frames in according to different fishing types to fish the species, i.e., from 1981 to1989 is conventional fishing type, and from 1990 to 1998 the deep longline fishing type. However, which any one of the fishing types is not used to target yellowfin tuna in the Atlantic, a time frame from 1981 to 1998 was used in the standardization for estimating age-specific abundance indices for Taiwanese longline fishery.
Furthermore, for deriving the standardized catch per unit effort of long-term series for Taiwanese longline fishery, the task II data aggregated as 5x5 square catch and effort were used on standardization from 1968 to 1980
2. Standardization of catch per unit effort as abundance indices by ages
Catch at assize was created from 1981 to 1998. The catch and size data were aggregated in 10x20 (latitude x longitude) rectangles in calendar quarter of the year. Eventually a 43 rectangles was mapped as Fig. 2.
2.1. Creation of catch at size data
For creating catch at size and easily comparing the results of yellowfin tuna for longline fishery, the creating proxy and procedure of Miyabe and Okamoto (1998) for bigeye tuna and yellowfin tuna were followed. Their basic characteristics are:
1. Fish are larger in the tropical and subtropical area (20oN-20oS);
2. Fish are more similar in the longitudinal direction than in the latitudinal direction.
3. Fish are more similar between second and third quarters of fourth and first quarter than between first and second quarters or third and fourth quarters.
And the basic substitution used by Miyabe and Okamoto (1998) for bigeye tuna was applied in the present purpose. They designed the substitution scheme into 7 levels in their paper reported previously for the yellowfin tuna (Miyabe and Okamoto 1999). The scheme is:
Level-1 substitution: substitution with neighboring rectangle in the same quarter, priority was given in the order of east, west, lower latitude, higher latitude, lower east, low west, higher east and higher west.
Level-2 substitution: same substitution as Level-1 but neighboring quarter, only between second and third quarters and between fourth and first quarters in the following year except first quarter in the first year and fourth quarter in the last year, in which substitution was made between first and second quarters and between third and fourth quarters, respectively.
Level-3 substitution: All available catch at size, including Level-1 and Level-2 substitutions, was summed for four large areas (north of 20oN, between equator and 20oN between equator and 20oS and south of 20oS) in the Atlantic. Substitution was made with one of them to which that stratum belongs.
Level-4 substitution: Same as Level-3 but neighboring quarter from 2 to 3 and 4 to 1, and vice versa.
Level-5 substitution: Areas were extended to north and south Atlantic in the same quarter. Level-6 substitution: Same as Level-5, but neighboring quarter from 2 to 3 and 1 to 4, and
vice versa.
Level-7 substitution: Area was further extended to total Atlantic in the same quarter. 2.2. Creation of catch-at-age data
The age-length limits were applied from 1998 detail report - yellowfin tuna (Table 1). The lower limit for age slicing (cm) used to create catch at age was defined by upper limit of next year younger age class in the same quarter.
2.3. Standardization of catch per unit effort as abundance indices by ages
A new stratification of fishing area for yellowfin tuna by Taiwanese longline fishery was defined as Fig. 2. Those are five sub-areas in matching with the distributions of effort and nominal catch per unit effort. Sub-area 3 is the tropical area where bigeye tuna was abundant in usual.
The model used for standardizing catch per unit effort was general linear model with log-normal error structure assumption, the model is
:
error
xarea
quarter
area
quarter
year
t
cons
CPUE
n
l k l k j ijkl+
+
+
+
+
=
+
tan
)
0(
µ
l
(1)
for the ith age-group, where
µ
0 is the grand mean; the effects of year, quarter and area and a two-way interaction between quarter and area were designed. The error is assumed to be log-normal with o mean andσ
standard deviation.The data used for standardizing catch per unit effort in the total Atlantic were separated into 3 time frames, (1) data from 1968 to 1980 used 5x5 aggregated catch and effort because the logbooks are not available, (2) data from 1981 to 1991 used logbook daily set as basic data, there was no operation of deep longline fishing type during this period, and (3) data from 1990 to 1998 used the logbook daily set too, but there was of deep longline fishing type operated in the Atlantic. Consequently, model (1) was modified for the three time frames as: (1) from 1968 to 1980
error
xarea
quarter
area
quarter
year
t
cons
CPUE
n
l k l k j ijkl+
+
+
+
+
=
+
tan
)
0(
µ
l
(2)
(2) from 1981 to 1989error
xarea
quarter
area
quarter
year
t
cons
CPUE
n
l k l k j ijkl+
+
+
+
+
=
+
tan
)
0(
µ
l
(3)
(3) from 1990 to 1991
error
xsp
area
xarea
quarter
xsp
quarter
sp
area
quarter
year
t
cons
CPUE
n
m l l k m k m l k j ijkl+
+
+
+
+
+
+
+
=
+
tan
)
0(
µ
l
(4)
Wheresp
m is the species effect, and its interactions with quarter and sub-area. The species effect was defined for bigeye tuna target using the quintile system. Because the catch of bigeye tuna may be negatively related to the catch of albacore, the species effect was defined as the ratio of the catches (in number) of albacore and bigeye tuna:
bigeye
albacore
albacore
R
+
=
Roughly, if R is less than 25%, then the effort is not targeting bigye tuna, and targeting otherwise.
RESULTS
1. Distributions of catch, effort and nominal catch per unit effort
During 1970-1989, the catches of yellowfin tuna by Taiwanese longline fleets were from tropical Atlantic easterly from 35oW, eastern Caribbean Sea and off southeastern coast of South America. This distribution has change during 1990-1998 to only the tropical mid-Atlantic confound by 15oN-10oS and 10oW-40oW (Fig. 3-1).
The high catch in the mid-Atlantic during 1970-1989 was obviously not coincident with that of fishing effort distribution, but they were for other two high catch areas (Fig. 3-2). Apparently, during 1990-1998, the high catch area was pretty matching with the high effort distribution (Figs. 3-1 and 3-2).
The nominal catch per unit effort showed that high density occurred in tropical Atlantic between 15oN and 10oS in according to the fishery-dependent information of Taiwanese longline fishery during 1970-1989 (Fig. 3-3). Accordingly, the nominal catch per unit effort is much more sparse during 1990-1998 (Fig. 3-3 lower).
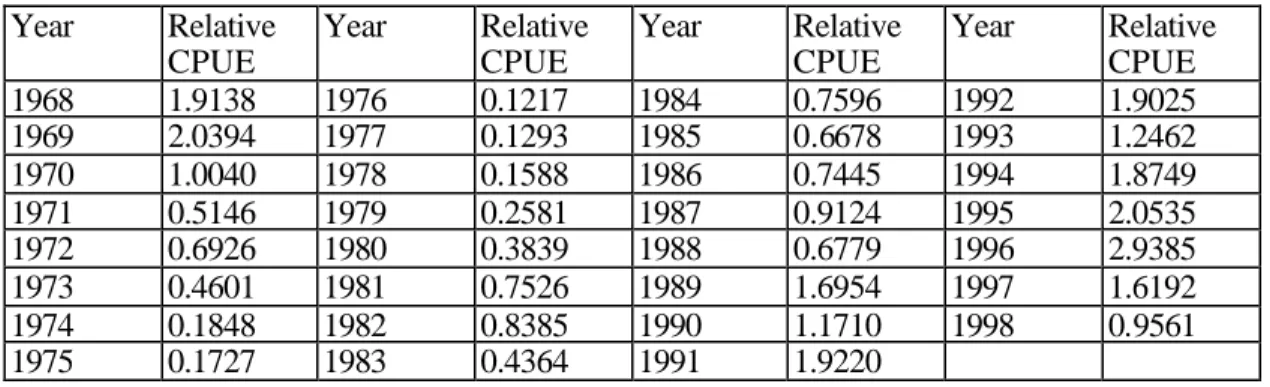
2. Standardized catch per unit effort for total Atlantic stocks
In according to the distributions of nominal catch, effort and catch per unit effort (Fig. 3), the Atlantic was stratified into 5 sub-areas as GLM factors (Fig. 2). The sub-areas were used as “area factor” in models (1) – (4).
The result revealed that the catch rate decreased from 1968 to 1975, and increased then after to the historical highest level in 1995 (Fig. 4 and Table 1), then decreased abruptly again. 3. Standardized age-specific catch per unit effort
Because the yellowfin fishery of Taiwanese longline in the Atlantic is not targeted, the size data are limited in according to the current sampling system (Hsu and Lin 1996). Therefore, the size data were combined in deriving the catch-at-age for standardizing age-specific catch per unit effort. Hence, only the age-specific catch per unit effort was obtained for the total Atlantic instead.
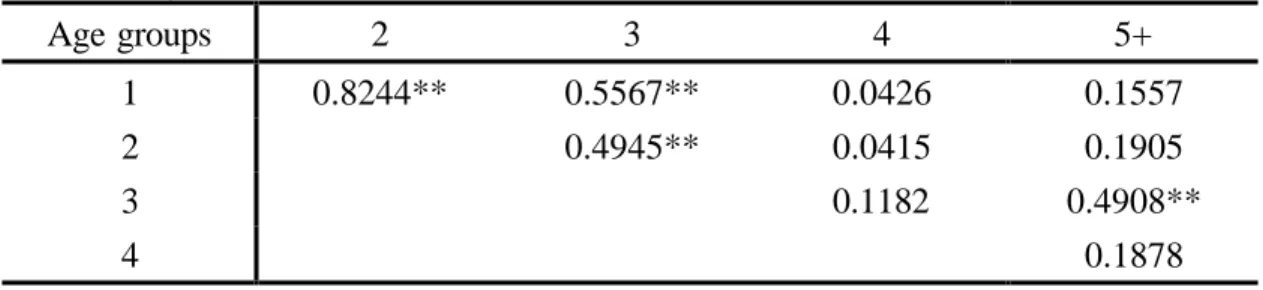
The result was illustrated in Fig. 5 and tabulated in Table 2. Basically, the abundance indices expressed by standardized age-specific catch per unit effort shows age 1 to age 3 have very similar trend that are flat before 1988, significantly fluctuated increasing then after; that of age 4 shows steady tendency, but that of age 5+ group indicates a weak trend compared to those of younger ages (except that of age 3). The correlation coefficients among the age groups were estimated in Table 3.
Although some trends were correlated, age groups 1 and 2; 1 and 3; 2 and 3; and 3 and 5, very obvious either strong or weak year class was not found from this result (Fig. 5).
DISCUSSION
Yellowfin tuna is one of the by-catch species for Taiwanese longline fishery in the Atlantic. The catches of yellowfin tuna vary year to year depending on the area of fishing. Basically, the catch is lower during the 1970s and 1980s, this may be due to the target of Taiwanese longline gear was concentrated on albacore and operated at the higher latitude relatively. The distribution of catches and effort could elucidate this fact (Fig. 1). And the recent increasing catch may be due to the deep longline effort directed to bigeye tuna increased and caught yellowfin tuna incidentally in the tropical area.
The catch distribution of yellowfin tuna seems not coincident with any fishing type by Taiwanese longline fishery (Fig. 3-1). During the 1970 – 1989, catches of yellowfin tuna were mainly from eastern Caribbean Sea, southeastern South America and tropical mid-Atlantic,and during 1990-1998 the catches mainly concentrated on the tropical mid-Atlantic. If comparing to the Taiwanese longline effort distribution (Fig. 3-2), including fishing efforts of the conventional and the deep fishing types, the catches are proportionally related with the fishing efforts deployed except the tropical mid-Atlantic area during 1970-1989.
To investigate the nominal catch per unit effort distribution (Fig. 3-3), it is obvious that the high nominal catch per unit effort occurred between 15oN and 10oS during 1970-1989. Note that there was the lowest fishing effort deployed compared with the others in the Atlantic by Taiwanese longline fishery during 1970-1989 on this area. Thus the high nominal catch per unit effort may result from the low fishing effort. On the other hand, during 1990-1998, the high nominal catch per unit effort seems coming from high fishing effort in the mid-Atlantic region (Figs. 3-2 and 3-2), and the areas off southeastern South America and off southwestern Africa.
The latter areas apparently are of conventional longline fishing effort directed to albacore, and the former is deep longline fishing effort directed bigeye tuna. Consequently, it is obvious that the catch of yellwofin tuna by Taiwanese longline effort is incidental. It is hard to conclude which is the fishing type using to target yellowfin tuna in the Atlantic by Taiwan longline fleet.
The standardized catch per unit effort for yellowfin tuna in the total Atlantic has been derived by Ma and Hsu (1997) in using Taiwanese longline fishery data. However, the different time frame classification and longer time series was used in the present study. The result revealed is much similar Ma and Hsu (1997) have derived. Apparently, three periods could be verified, those were from 1968 to 1975, the index decreased, and increased to the highest level in 1995,then decreased abruptly.
The age -specific standardized catch per unit effort indicated that a similar increasing trend for all age groups (Fig. 5) with large fluctuation after 1990. However, age 4 group showed much more steady increase.
ACKNOWLEDGEMENTS
The work of deriving catch per unit effort for stock evaluation is fully supported by Fisheries Administration, Council of Agriculture, we appreciate them for long-term grant support for the collection and investigation of Taiwanese longline fishery data. Also we thank Mr. C. J. Lin for his kindly help on drawing the figures in this document.
REFERENCES
Anon. 1999. Detail report – Yellowfin tuan, International Commission for the Conservation of Atlantic Tunas, Coll. Vol. Sci. Pap., 49(3).
Hsu, C. C. and M. C. Lin. 1997. The recent catch estimating procedures of Taiwanese longline fisheries. International Commission for the Conservation of Atlantic Tunas, Coll. Vol. Sci. Pap., 46:175-177.
Ma, C. T. and C. C. Hsu. 1997. Standardization of CPUE for yellowfin tuna by Taiwanese longline fishery in the Atlantic. International Commission for the Conservation of Atlantic Tunas, Coll. Vol. Sci. Pap., 46(4):197-204.
Miyabe, N. and H. Okamoto. 1998. Creation of bigeye tuna catch-at-size caught by the Japanese longline fishery in the Atlantic. International Commission for the Conservation of Atlantic Tunas, Coll. Vol. Sci. Pap., 48(2):303-306.
Miyabe, N. and H. Okamoto. 1999. Development of catch-at-size for yellowfin tuna caught by the Japanese longline fishery in the Atlantic. International Commission for the Conservation of Atlantic tuna, Coll. Vol. Sci. Pap., 49(3):466-470.
Table 1 The standardized catch per unit effort series for yellowfin tuna by Taiwanese longline fleets
from 1968 to 1998. The GLM was applied for the standardization and three time frames were used as 1968-1980, 1981-1989 and 1990-1998. All the figures were scaled by the mean of whole series.
Year Relative CPUE Year Relative CPUE Year Relative CPUE Year Relative CPUE 1968 1.9138 1976 0.1217 1984 0.7596 1992 1.9025 1969 2.0394 1977 0.1293 1985 0.6678 1993 1.2462 1970 1.0040 1978 0.1588 1986 0.7445 1994 1.8749 1971 0.5146 1979 0.2581 1987 0.9124 1995 2.0535 1972 0.6926 1980 0.3839 1988 0.6779 1996 2.9385 1973 0.4601 1981 0.7526 1989 1.6954 1997 1.6192 1974 0.1848 1982 0.8385 1990 1.1710 1998 0.9561 1975 0.1727 1983 0.4364 1991 1.9220
Table 2 Standardized catch per unit effort for yellowfin tuna caught by Taiwanese longline fishery in
the Atlantic. Where the ages are referred to Table 4 in Anon. (1999), and figures in the table are in numbers of fish caught per 1000 hooks.
Year
Age 1
Age 2
Age 3
Age 4
Age 5+
1981
0.001109
0.14029
0.18546
0.03676
0.003761
1982
0.002555
0.11785
0.25206
0.03577
0.001019
1983
0.00024
0.06021
0.11886
0.02907
0.004643
1984
0.00217
0.11666
0.20324
0.04382
0.004876
1985
0.002522
0.09609
0.17894
0.04513
0.003314
1986
0.000593
0.14538
0.20288
0.01437
0.000157
1987
0.001489
0.14301
0.25478
0.04591
0.000205
1988
0
0.02696
0.27076
0.03318
0
1989
0.012414
0.25072
0.54634
0.01587
0.002203
1990
0.000171
0.04578
0.3516
0.16072
0.013307
1991
0.010165
0.63571
0.25435
0.03546
0.002536
1992
0.003033
0.31379
0.53186
0.07296
0.007047
1993
0.005361
0.26696
0.26055
0.06764
0.007798
1994
0.002998
0.51522
0.35379
0.03947
0.00369
1995
0.012564
0.59518
0.32976
0.0566
0.008293
1996
0.019671
0.69756
0.54264
0.16152
0.012984
1997
0.0001071
0.13085
0.46502
0.17324
0.02123
1998
0.001233
0.1904
0.20071
0.06368
0.010647
Table 3 The correlation coefficients of standardized catch per unit effort among age groups. Where
** denotes significant at P <0.01.
Age groups
2
3
4
5+
1
0.8244**
0.5567**
0.0426
0.1557
2
0.4945**
0.0415
0.1905
3
0.1182
0.4908**
4
0.1878
W est Atlantic 0 2000 4000 6000 8000 10000 12000 14000 16000 18000 1968 1972 1976 1980 1984 1988 1992 1996
C
a
tc
h
(m
t)
East A tla ntic
0 2000 4000 6000 8000 10000 12000 14000 16000 18000 20000 22000 24000 1968 1971 1974 1977 1980 1983 1986 1989 1992 1995 Ca tc h ( m t) Total A tlantic 0 2500 5000 7500 10000 12500 15000 17500 20000 22500 25000 27500 30000 32500 35000 1968 1971 1974 1977 1980 1983 1986 1989 1992 1995 Year Cat c h ( m t)
Fig. 1 Catches of yellowfin tuna in west, east and total Atlantic by longline (upper)
Fig.3-1 Catch distribution for yellowfin tuna by Taiwanese longline fishery based on 1970-1989
Fig.3-3 Nominal catch per unit effort distribution for yellowfin tuna by
0
0,5
1
1,5
2
2,5
3
1968 1971 1974 1977 1980 1983 1986 1989 1992 1995
Y ear
Relative
C
Fig. 4 The standardized catch per unit effort for yellowfin tuna by Taiwanese longline fishery in the Atlatnic. The figures were scaled
0 0.005 0.01 0.015 0.02 0.025 81 82 83 84 85 86 87 88 89 90 91 92 93 94 95 96 97 98 cpue5 cpue1 o 0 0.1 0.2 0.3 0.4 0.5 0.6 0.7 0.8 81 82 83 84 85 86 87 88 89 90 91 92 93 94 95 96 97 98 cpue2 cpue3 cpue4
Fig. 5 Age-specific catch per unit effort for yellowfin tuna caught by Taiwanese longline fishery in