行政院國家科學委員會專題研究計畫 成果報告
運用新的粒子群演算法求解馬可維茲資產組合選擇模型
研究成果報告(精簡版)
計 畫 類 別 : 個別型 計 畫 編 號 : NSC 99-2221-E-004-003- 執 行 期 間 : 99 年 08 月 01 日至 100 年 07 月 31 日 執 行 單 位 : 國立政治大學資訊管理學系 計 畫 主 持 人 : 陳春龍 計畫參與人員: 博士班研究生-兼任助理人員:曾宇瑞 博士班研究生-兼任助理人員:黃馨瑩 處 理 方 式 : 本計畫可公開查詢中 華 民 國 100 年 10 月 17 日
An Effective Particle Swarm Optimization Algorithm for Portfolio
Selection
Abstract
Particle swarm optimization (PSO), introduced by Kennedy and Eberhart in 1995, is a social population-based search algorithm that have been successfully applied to solve various hard optimization problems. In this research we developed three new strategies to overcome the major drawback of PSO, the swarm stagnation, in order to improve its explorative capability. The proposed PSO has been applied to solve the well-known Markowitz mean-variance portfolio selection model with the five benchmark data sets presented in the OR library. Computational results showed that with the new strategies, the proposed PSO significantly improves the performance of a basic PSO. In addition, the proposed PSO generated better efficient frontiers than genetic algorithm (GA), simulated annealing (SA), and tabu search (TS).
Keywords: Particle swarm optimization, swarm stagnation, Markowitz mean-variance model
1. Introduction
Particle swarm optimization (PSO), introduced by Kennedy and Eberhart [12] in 1995, is a social population-based search algorithm for solving optimization problems. The searching process of PSO for an optimization problem starts with a population with randomly generated solutions (particles). Applying the concept of social influence and social learning of the social-psychological model, each particle in the population searches the solution space by considering the effect of the best solution that all the particles have ever searched (global best) and the effect of the best solution that the particle has ever searched (individual best). The new position of a particle in the next population is determined by its current position plus the effect of the global best solution (social influence) and the effect of the individual best (social learning). This process will continue until a termination criterion is satisfied. Since its introduction, PSO has been successfully applied to solve various hard optimization problems [1, 2]. However, many researches have discovered a critical drawback of PSO, the swarm stagnation, and have proposed different methods to overcome this drawback [11, 14, 17, 18, 19, 21]
The portfolio selection problem is a problem that determines an effective way for allocating resources to a given set of securities or assets. The mean–variance model of Markowitz is one of the most well-known models for solving the portfolio selection problem. The model assumes that the total return of a portfolio can be described using the mean return of the assets and the variance of return among these assets (risk) [3, 10]. In its basic form, this model generates a portfolio of assets which minimizes the risk while achieving a predetermined level of mean return. The combinations of different levels of mean return and the corresponding risk generated by the model constitute an efficient frontier, which provides an effective way for allocating assets under different level of desired mean return. Due to its critical value for researchers and practitioners, several optimization methods, genetic algorithm [3], tabu search [3], simulated annealing [3, 5] and neural networks [9], have applied to solve the model.
In this research, we proposed three new strategies to overcome the swarm stagnation problem of PSO and applied the proposed PSO to solve the Markowitz’s mean-variance model with five benchmark data sets contained in the OR library [3]. For each data set, the OR library provides an exact efficient frontier for reference. Computational results showed that the new strategies help overcome the swarm stagnation problem for a basic PSO and improve its explorative capability. In addition, for each benchmark data set, the proposed PSO algorithm generated an efficient frontier closer to the referred efficient frontier than those generated by genetic algorithms, tabu search, and simulated annealing for all the test data sets. The rest of this paper is organized as follows. Section 2 presents literature reviews on PSO and Markowitz’s model. Section 3 presents the proposed PSO as well as the way to apply it to solve Markowitz’s model. The computational results are discussed in Section 4 and Section 5 concludes some findings in this paper.
2. Literature Review
In this section, we first review the PSO and the parameters that may affect its performance. Then, we describe the standard Markowitz model and illustrate the way to generate the efficient frontier.
2.1 Particle Swarm Optimization
Particle swarm optimization (PSO), similar to evolutionary algorithms, is a population-based search algorithm. Particle, a member in a population, searches a solution space by dynamically adjusting its position (a solution in the solution space) according to its own experience and the experiences of all the particles in the population [1, 12, 13]. The position of a particle is described as follows:
) 1 ( ) ( ) 1 (t x t V t xi i i
(1)
Wherexi(t)denotes the current position of particle i in the search space at time step t. The
position of the particle is changed by adding a velocity Vi(t1)to the current position and ) 1 (t Vi is calculated as follows: )) ( ( () )) ( ( () ) ( ) 1 (t w V t c1 rand p x t c2 rand p x t Vi i i i g i
(2)
Where Vi(t) is the velocity of particle i at time step t. The inertia weight, w, is a parameter used
to weight the contribution of the previous velocity on the new velocity; it is designed as a mechanism to control the exploration and exploitation abilities of PSO [1, 4, 19, 20]. The personal best position, pi , is the best position that particle i has ever visited, and the global best
position, pg, is the best position that all the particles have ever visited. The c1 and c2 are positive constants used to scale the contribution of the personal best solution and the global best solution respectively, and rand() is a random value sampled from a uniform distribution with a range of [0, 1]. Therefore, the term, c1rand()(pi xi(t)), refers to the effect of personal
experience on particle i (social learning) and the term, c2rand()(pg xi(t)) , refers to the
effect of global experience on particle i (social influence). Population size and termination criterion are two other parameters needed to be determined when implementing PSO. The maximum number of time steps, tmax, is a commonly used termination criterion. The procedure of a basic PSO can be summarized as follows:
Step 1: Randomly generate a population with M particles at initial time step (t = 0).
best solution, pi, for each particle and the global best solution, pg.
Step 3: Calculate the new position for each particle using equations (1) and (2). Step 4: If the current time step t is equal to tmax, then stop; else go to Step 2.
Many empirical studies have shown that PSO is an effective optimization approach, but the performance of the PSO is affected by the values of the parameters. Some parameter choices may lead to divergent, cyclic behavior or stagnation. The inertia weight, w, is important to ensure convergent behavior, and to reasonably tradeoff exploration and exploitation. For w ≧1, velocity usually increases over time, accelerating towards the maximum velocity, and swarm diverges. Particles fail to change direction in order to move back towards promising areas. For w ≦1, particles usually decelerate until their velocity reach zero. Therefore, a larger w value will promote global exploration and a smaller w will promote local exploitation. Eberhart and Shi [6] suggested that the w value be initially set to 0.9 and linearly reduced to 0.4 for an optimization run. The constants c1 and c2 are also referred to as trust parameters, where c1
expresses how much confidence a particle has in itself and c2 expresses how much confidence a
particle has in its neighbors. If c1 is larger than c2, each particle is much more attracted to its
own personal best position, resulting in excessive wandering. On the other hand, if c2 is larger
than c1, particles are strongly attracted to the global best position, causing particles to rush
prematurely towards optima. Kennedy and Eberhart [12] suggested that c1 and c2 coexist in a
good balance with a value of 2.
Besides the study of the effects of the parameters, several searchers have developed different methods to improve the exploration capability of PSO in order to overcome the swarm stagnation problem. Van den Bergh and Engelbrecht [21] suggested a new method to select the global best solution for calculating the new velocity in equation (2). In stead of directly selecting the true global best solution, they randomly select a solution from an area within a radius of the global best solution and use it as the global best solution in equation (2). Krink et al. [14] proposed three bouncing strategies to keep the search of PSO from converging into local optima. Riget and Vesterstrm [18] proposed an attractive and repulsive approach; it first calculates the diversity of a population to measure the level of convergence and determine a threshold level of convergence. If a search satisfies the threshold level, the search will be repulsed to explore other solution regions. Ratnaweera et al. [17] proposed a strategy to adjust the values of c1 and c2 in equation (2) so that the search will focuses on exploration in the early
stages and encourage the convergence to a good solution near the end of the optimization process. Integrating PSO with other optimization methods is another approach to improve the performance of PSO. Juang [11] integrated PSO with genetic algorithms (GA) to propose an algorithm, HGAPSO (Hybrid Genetic Algorithm Particle Swarm Optimization). The algorithm selects a number of elite particles in every stage and applies crossover and mutation operations of GA to the particles in order to improve the solutions in each stage and keep the search from trapping into local optima.
2.2 The Markowitz Mean-Variance Selection Model
The problem of optimally selecting a portfolio among N assets was formulated by Markowitz in 1952 as a quadratic minimization problem [3]. In this model, each asset is characterized by a return varying randomly with time. The risk of each asset is measured by the variance of its return. Let
N be the number of assets available,
wi be the proportion of an investor’s wealth allocated to asset i,
ui be the expected return of asset i (i=1,… ,N),
Rexp be the desired expected return,
then the standard Markowitz mean –variance model is presented as follows:
N N =1 =1 N exp =1 (1) subject to = i j ij i j i i i Min w w w u R
N =1 (2) (3) =1 i i w
0wi 1 , = 1,..., i NEquation (1) minimizes the total variance (risk) associated with the portfolio; Equation (2) ensures that the portfolio has an expected return of Rexp; Equation (3) ensures that the proportions add to one. Solving the model with different levels of expected return, we can produce different combinations of expected returns and risks that can trace out an efficient frontier. Chang et al. [3] modified the model by introducing a parameter, λ, to weight the relative importance of the expected return and the risk. The case λ=0 represents a case that maximizes portfolio expected return (without caring the risk), and the case λ=1 is the case that minimizes the total risk with selected portfolio (without caring the expected return). Between the two extreme cases, λ represents a tradeoff between the risk and the expected return.
N N N =1 =1 =1 N =1 - subject to =1 0 1 , = 1,..., i j ij i i i j i i i i Min w w w u w w i N
(10)3. Proposed particle swarm optimization for portfolio selection
We propose three strategies to help overcome the swarm stagnation for the basic PSO and improve its explorative capability. Strategy one proposes to utilize multiple global best solutions for the particles in each population. In this research, the top three solutions, denoted as pg1, pg2, and pg3, are chosen to be the global best solutions. Then in each time step, the
population is equally divided into three groups and pg1 is used as the global best solution for
calculating the velocity for the particles in the first group, pg2 is used as the global best solution
for calculating the velocity for the particles in the second group; however, by trial-and-error, the average of the three global best solutions, (pg1+pg2+pg3)/3, is used as the global best solution for
calculating the velocity for the particles in the third group. Strategy two proposes to use the idea of the mutation operation of genetic algorithms. It sets a threshold value for the velocity for each particle. If, during the search of PSO, the velocity of a particle is less than the threshold
value, a new position (solution) will be randomly generated for the particle. The threshold value, in this research, is set to be 0.000001 by trial-and error. The third strategy proposes to drastically change the searching region for PSO after a predetermined number of time steps so as to keep the search from trapping into local optima. In this research, since all the models include large numbers of variables, from 31 variables up to 225 variables, by trial-and-error, we set the termination criterion (tmax) equal to 3000 for the basic PSO algorithm. When the third strategy is applied, we purposely reinitialize the population by randomly generating positions for all the particles after every 300 time steps, denoted as a phase in this research; however, the global best solutions are retained for every new phase. The search will terminate after 10 phases, which is equal to tmax.
The parameter values used in the proposed PSO are determined as follows. We adopt the idea of Eberhart and Shi [6] to determine the values of inertia weight, where an initial inertia weight 0.9 is linearly decreased to a small value of 0.2, and the inertia weight for time step t, w(t), is calculated using the following equation:
( - ) ( ) ( (0) - ( )) t + ( ) 6 t t t n t w t w w n w n n Where nt is the maximum number of time steps used in each phase, w(0) is the initial inertia
weight and w(nt) is the final inertia weight. When the third strategy is applied, nt is equal to 300
for every phase; otherwise nt is equal to tmax, which is 3000. The values of w(0) and w(nt) are, as
mentioned above, 0.9 and 0.2 respectively. As for the constants c1 and c2, we adopt the
suggestion of Kennedy and Eberhart [12] and set c1 = c2 = 2.0 in this research. Although 40 is
the population size suggested by most of the research for PSO [1], we use 100 as the population size for the proposed PSO because all the models include large numbers of variables.
4. Computational Results
The proposed PSO algorithm has been applied to the Markowitz model. One more subscript, j, is added to the variables in equations (1) and (2) to describe the properties of an individual asset in a solution (a portfolio) for the Markowitz model. For instance, xij(t)denotes the proportion of asset j in portfolio i at time step t. Equations (1) and (2) are rewritten for the Markowitz model as follows:
) 1 ( ) ( ) 1 (t x t V t xij ij ij )) ( ( () )) ( ( () ) ( ) 1 (t w V t c1 rand p x t c2 rand p x t Vij ij ij ij gj ij
Each variable in the initial population, xij(0) , is randomly generated from a uniform distribution with a range of [0, 1]. Since the sum of the proportions in a portfolio must equal one, the proportions are normalized by summing up the proportions first and then dividing each proportion by the sum. Note that as long as a solution is generated, the solution needs to be normalized.
Five test data contained in the OR library are used to test the performance of the proposed PSO algorithm. Chang et al. [3] constructed these data sets by considering stocks involved in five major capital markets indices in the world: Hang Seng 31 in Hong Kong, DAX 100 in Germany, FTSE 100 in UK, S&P 100 in USA and Nikkei 225 in Japan; the number in each data set refers to the number of assets considered in the data set. Using the data in each data set, Chang et al [3] optimally solved the basic Markowitz model (equations (1)-(4)) to produce 2000 pairs of mean return and risk and generate an exact efficient frontier for the data set. Then they used these exact efficient frontiers to evaluate the efficient frontiers generated by three heuristics, genetic algorithms (GA), simulated annealing (SA) and tabu search (TS). For each
data set, these three heuristics were applied to the model (equations (5)-(7)) with fifty different λ values equally spaced in [0, 1] to generate 50 pairs of mean return and risk; the average percentage deviation of the fifty pairs of solutions from the corresponding efficient frontier is used to evaluate the performance of the heuristics.
The proposed PSO was also applied to the model with the same fifty different λ values to generate 50 pairs of mean return and risk for the data sets. We first applied the algorithm with different combinations of the strategies to the first data set, Hang Seng 31, and compared their performance to investigate the effects of the proposed strategies on the basic PSO algorithm. Then we applied the proposed PSO with the best combination of the strategies to the other four data sets and compared the average percentage deviation produced by the proposed PSO with those produced by the three heuristics, GA, SA, and TS, developed by Chang et al [3]. Table 1 presents the average percentage deviations between the efficient frontiers, produced by the proposed PSO with different combinations of the strategies, and the exact efficient frontier for Hang Seng 31. A three-dimension array is used to denote the combinations. The first element in the array refers to the condition of the first strategy: 1 means the strategy is used and 0 means the strategy is not used. The second and the third elements in the array similarly refer to the condition of the second and the third strategy respectively. The proposed PSO with an array (0, 0, 0) refers to the basic PSO algorithm that does not utilize any of the three strategies. The average percentage deviations produced by the proposed PSO with (0, 0, 0), (1, 0, 0), (0, 1, 0) and (0, 0, 1) are 1.77e-03, 4.49e-04, 2.31e-007 and 2.30e-05 respectively. These results show that all the proposed strategies are able to improve the effectiveness of the basic PSO, but the effect of the second strategy is much stronger than the other two strategies. This may conclude that although all the three strategies are able to help overcome the swarm stagnation for the basic PSO algorithm, the second strategy is much more advanced than the other two strategies. Furthermore, the results produced by the proposed PSO with (0, 1, 0), (0, 1, 1) and (1, 1, 0) show that the third strategy further improves the performance of the proposed PSO with (0, 1, 0); it reduces the average percentage deviation from 2.31e-005 to 5.22e-006. However, the results show that the first strategy and the second strategy have strong interaction. The average percentage deviation produced by the proposed PSO with (1, 1, 0) is 6.90e-05, which significantly worsens the average percentage deviation (2.31e-007) produced by the proposed PSO with (0, 1, 0). At last, the results of the proposed PSO with (0, 1, 1) and (1, 1, 1) show that the first strategy slightly improves the performance of the proposed PSO with (0, 1, 1); it reduces the average percentage deviation from 5.22e-006 to 4.30e-006.
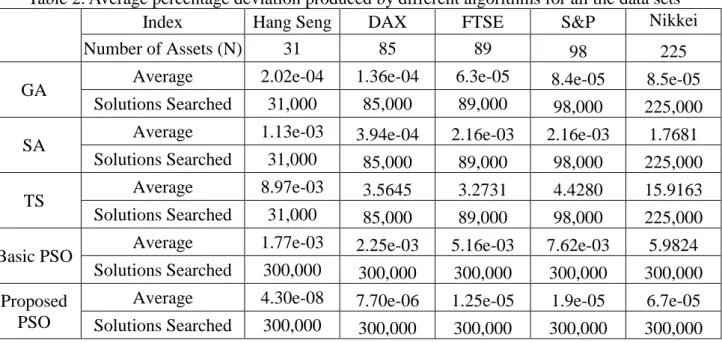
Table 1 concludes that the proposed PSO with (1, 1, 1) produced the best result, so it was applied to the other four data sets. Table 2 presents the average percentage deviations produced by the proposed PSO, the basic PSO, the constriction PSO, and the heuristics, GA, SA and TS, developed by Chang et al. [3] for all the five data sets. The mean percentage deviations show that the proposed PSO outperforms the basic PSO and the constriction PSO in all the data sets. This confirms that the proposed PSO is able to help overcome the swarm stagnation for the basic PSO algorithm and improve its explorative capability. In addition, the mean percentage deviations show that the proposed PSO outperforms GA, SA and TS in all the data sets. This concludes that the proposed PSO is an effective algorithm for the candidate problem. Furthermore, Chang et al. [3] showed that the number of solutions searched using their GA, SA and TS to generate a pair of mean return and risk on an efficient frontier is 1000*N (N is the number of assets in a data set), so the number of solutions searched using Chang et al.’s [3] GA, SA and TS for Hang Seng 31 is 31,000, for DAX 85 is 85,000, and so on. However, the number of solutions searched using the proposed PSO is 300,000 for all the data sets. Therefore, the GA, SA and TS heuristics are more efficient than the proposed PSO.
Table 1. Average percentage deviation produced by the proposed PSO with different combinations of the new strategies
Combination of the proposed strategies
The average percentage deviation
(0, 0, 0) 1.77e-03 (1, 0, 0) 4.49e-04 (0, 1, 0) 2.31e-07 (0, 0, 1) 2.30e-05 (0, 1, 1) 5.22e-08 (1, 1, 0) 6.90e-05 (1, 0, 1) 1.10e-05 (1, 1, 1) 4.30e-08
Table 2. Average percentage deviation produced by different algorithms for all the data sets
Index Hang Seng DAX FTSE S&P Nikkei
Number of Assets (N) 31 85 89 98 225
GA Average 2.02e-04 1.36e-04 6.3e-05 8.4e-05 8.5e-05
Solutions Searched 31,000 85,000 89,000 98,000 225,000
SA Average 1.13e-03 3.94e-04 2.16e-03 2.16e-03 1.7681
Solutions Searched 31,000 85,000 89,000 98,000 225,000
TS Average 8.97e-03 3.5645 3.2731 4.4280 15.9163
Solutions Searched 31,000 85,000 89,000 98,000 225,000
Basic PSO Average 1.77e-03 2.25e-03 5.16e-03 7.62e-03 5.9824
Solutions Searched 300,000 300,000 300,000 300,000 300,000
Proposed PSO
Average 4.30e-08 7.70e-06 1.25e-05 1.9e-05 6.7e-05
Solutions Searched 300,000 300,000 300,000 300,000 300,000
5. Conclusions
In this paper we proposed a new PSO using three strategies to help overcome the swarm stagnation for the basic PSO. The proposed PSO was applied to solve portfolio selection problem based on standard Markowitz mean-variance model. Computational results show that the proposed PSO significantly dominates the basic PSO. This confirms the expectation that the proposed strategies are able to help overcome the swarm stagnation for the basic PSO and improve its explorative capability. In addition, computational results show that the proposed
PSO is more effective than the GA, SA and TS developed by Chang et al. for generating efficient frontiers for the candidate problem with the five benchmark data sets.
As mentioned, many PSO algorithms have been applied to solve complicated optimization problems; the proposed strategies are worthwhile to work with other PSO algorithms for solving optimization problems.
Refereance
1. Banks, A., Vincent, J. and Anyakoha, C., “A review of particle swamp optimization. Part I: background and development,” Natural Computing, 2007, 6, 467-484.
2. Banks, A., Vincent, J. and Anyakoha, C., “A review of particle swamp optimization. Part II: hybridization, combinatorial, multicriteria and constrained optimization, and indicative applications,” Natural Computing, 2008, 7, 109-124.
3. Chang, T.-J., Meade, N., Beasley, E. & Sharaiha, M., “Heuristics for cardinality constrained portfolio optimization,” Computers & Operations Research, 2000, 27, 1271-1302.
4. Carlisle A, Dozier G (2000) Adapting particle swarm optimization to dynamic environments. Proceedings of international conference on artificial intelligence, Vol. 1, pp. 429–434, Las Vegas, NV
5. Crama, Y. & Schyns, M., “Simulated annealing for complex portfolio selection problems,” European Journal of Operational Research, 2003, 150 (3), 546-571.
6. Eberhart RC, Shi Y (2000) Comparing Inertia Weights and Constriction Factors in Particle Swarm Optimization. Proceedings of IEEE congress evolutionary computation, San Diego, CA, pp 84–88.
7. Eberhart RC, Simpson P, Dobbins R (1996) Computational Intelligence PC tools. AP Professional, San Diego, CA, Chapter 6, pp. 212-226.
8. Engelbrecht, A. P. (2005) Fundamentals of Computational Swarm Intelligence, John Wiley & Sons, Ltd.
9. Ferna’ndez, A. & G’omez, S. (2007) Portfolio selection using neural networks. Computers & Operations Research, 34: 1177-1191.
10. Fieldsend, J. E., Matatko, J. & Peng, M. (2004) Cardinality constrained portfolio optimization” Proceedings of Intelligent Data Engineering and Automated Learning (IDEAL 2004). Volume 3177 of Lecture Notes in Computer Science. Springer Verlag. Exeter, UK 788-793.
11. Juang, C. F. (2004) A hybrid of genetic algorithm and particle swarm optimization for recurrent network design. IEEE Transactions on Systems, Man, and Cubernetics Part B: Cybernetics, 34: 997-1006.
12. Kennedy, J. & Eberhart, R. C. (1995) Particle swarm optimization. Proceedings of the IEEE International Conference on Neural Network, pp. 1942-1948.
13. Kennedy, J., Eberhart, R. & Shi, Y. (2001) Swarm Intelligence. San Francisco. Morgan Kaufmann.
14. Krink T, Vestertroem JS, Riget J (2002) Particle swarm optimization with spatial particle extension. Proceedings of the IEEE congress on evolutionary computation (CEC 2002), Honolulu, Hawaii.
15. Markowitz, H. M., 1952, Portfolio Selection, Journal of Finance, 7: 77-91.
16. Maringer, D. & Kellerer, H. (2003) Optimization of cardinality constrained portfolios with a hybrid local search algorithm. OR SPECTRUM, 25: 481-495.
17. Ratnaweera A, Halgamuge SK, Watson HC (2004) Self-organising hierarchical particle swarm optimizer with time-varying acceleration coefficients. IEEE Transactions on Evolutionary Computation, 8: 240–255.
18. Riget J, Vesterstrøm JS. (2002) A diversity-guided particle swarm optimizer – the ARPSO. EVALife Technical Report no 2002-02.
international conference on evolutionary computation, pp 69–73. IEEE Press, Piscataway, NJ.
20. Trelea IC (2003) The particle swarm optimization algorithm: convergence analysis and parameter selection. Information Processing Letter 85: 317–325.
21. Van Den Bergh F, Engelbrecht AP (2002) A new locally convergent particle swarm optimizer. Proceedings of IEEE conference on systems, man and cybernetics, Hammamet, Tunisia.
國科會補助計畫衍生研發成果推廣資料表
日期:2011/10/15國科會補助計畫
計畫名稱: 運用新的粒子群演算法求解馬可維茲資產組合選擇模型 計畫主持人: 陳春龍 計畫編號: 99-2221-E-004-003- 學門領域: 作業研究無研發成果推廣資料
99 年度專題研究計畫研究成果彙整表
計畫主持人:陳春龍 計畫編號: 99-2221-E-004-003-計畫名稱:運用新的粒子群演算法求解馬可維茲資產組合選擇模型 量化 成果項目 實際已達成 數(被接受 或已發表) 預期總達成 數(含實際已 達成數) 本計畫實 際貢獻百 分比 單位 備 註 ( 質 化 說 明:如 數 個 計 畫 共 同 成 果、成 果 列 為 該 期 刊 之 封 面 故 事 ... 等) 期刊論文 0 0 100% 研究報告/技術報告 0 0 100% 研討會論文 0 0 100% 篇 論文著作 專書 0 0 100% 申請中件數 0 0 100% 專利 已獲得件數 0 0 100% 件 件數 0 0 100% 件 技術移轉 權利金 0 0 100% 千元 碩士生 0 0 100% 博士生 2 2 100% 博士後研究員 0 0 100% 國內 參與計畫人力 (本國籍) 專任助理 0 0 100% 人次 期刊論文 0 0 100% 研究報告/技術報告 0 0 100% 研討會論文 0 0 100% 篇 論文著作 專書 0 0 100% 章/本 申請中件數 0 0 100% 專利 已獲得件數 0 0 100% 件 件數 0 0 100% 件 技術移轉 權利金 0 0 100% 千元 碩士生 0 0 100% 博士生 0 0 100% 博士後研究員 0 0 100% 國外 參與計畫人力 (外國籍) 專任助理 0 0 100% 人次其他成果