Po/ymer Drp’durion and Stahiliry 54 ( I YY6) 365-37 I 0 1996 Elsevier Science Limited
EI.SEVIER
Printed in Northern Ireland. All rights reserved
PII: SO141-3910(96)00064-X 0141.3910/96/$15.(X)
The thermal degradation of phosphorus-
containing copolyesters
Shinn-Jen Chang, Yuung-Ching Sheen, Rong-Shuh Chang & Feng-Chih Chang
Institute of Applied Chemistry, National Chiao Tung University, Hsinchu, Taiwan, R.O.C.
Two series of phosphorus-containing copolyesters were synthesized by poly- condensation of phosphorus-containing monomers: poly(ethylene terephthal- ate)-co-poly(ethylene phenylphosphonate)s [PET-co-PEPPs] and poly(ethylene
terephathalate)co-poly(ethylene DDP)s [PET-co-PEDDPs]. Both series are
considered as flame retardants in polyester fibers and polyester plastics. The phosphorus-containing polymers were characterized by NMR, IR, TGA and acid titration. Experimental results indicated that for the PET-co-PEPP higher phosphorus content results in lower thermal stability. However, an insig- nificant effect on thermal stability was observed in the case of PET-co- PEDDPs. Thus, the incorporation of the phosphorus linkage into the main chain results in less thermal stability than that having the phosphorus linkage as a pendant group, i.e. PET-co-PEDDPs are more stable than PET-co- PEPPs. 0 1996 Elsevier Science Limited
1 INTRODUCTION
Phosphorus compounds have been used as flame retardants since the nineteenth century.’ Con- siderable advances have been made during the past five decades in synthesizing various phos- phorus compounds, either alone or in conjunc- tion with nitrogen and/or halogen.*& Organo- phosphate esters currently comprise the largest market in phosphorus flame retardants.5 Moreover, the increasing demand for phosphorus compounds as flame retardants has been forecast to grow even further in light of environmental and health considerations. The requirements for less volatile flame retardants eliminating prob- lems such as blooming and thermal instability during compounding have stimulated investiga- tions involving the preparation of phosphorus compounds of a high molecular weight. Such compounds also have a good compatibility with base resins.
The conventional approaches include chemi- cally incorporating phosphorus groups on the polymer molecules either from the synthesis stage in the reactor or through reactive extrusion during compounding. For instance, the commer- cial product Trevira FR polyester fiber by
365
Hoechst2,3 utilizes phosphinate groups as a comonomer with glycol and dimethyl terephtha- late such that the phosphorus moieties are chemically linked onto polymer main chain and impart flame resistance to the polyester fibers. A similar approach has also been employed with the phosphorus groups pendant on the side chain of the flame retardant fabrics: curtains, up- holstery fabrics, hospital bedding and sleeping bags.4
In a continuing effort to develop non-halogen flame retardants for practical applications, our laboratory has successfully prepared a series of high molecular weight phosphorus copolyesters of different phosphorus contents through a novel design of synthetic schemes and catalytic systems.
Organophosphorus flame retardants primarily function in the condensed phase as carbonaceous char promoters.‘.’ However, only limited infor- mation involving the structural effects on efficiency and thermal stability is available in the literature.‘~‘” This paper examines the thermal stability of the polymeric phosphorus-containing copolyesters by varying the phosphorus contents in two series of structures, namely the phos- phorus groups in the main chain and as pendant groups.
2 EXPERIMENTAL
Scheme 1 shows that the phosphorus-containing copolyesters of PET-co-PEPP were prepared by melt polycondensation of terephthalic acid (TPA), ethylene glycol (EG), phenylphosphonic acid (PPA) and catalysts of zinc acetate and antimony oxide. The preparation was made according to a method described by Hideo YC ~1.” The phosphorus-containing copolyesters of PET- co-PEDDP by polycondensation of terephthalic acid and, ethylene glycol and 9,10-dihydro- lo-[2,3 di( hydroxycarbonyl)propyl] - lo-phospha- phenanthrene-IO-oxide (DDP) were prepared in a similar manner to the above procedure with tetrabutyl orthotitanate as the catalyst as shown in Scheme 2. Scheme 3 shows that the DDP comonomer was prepared by an addition reaction 9,10-dihydro-9-oxa-lo-phosphaphenanthrene-lo-
oxide (DOP) with itaconic acid. The intrinsic viscosities at 30°C in phenol/tetrachloroethane (60/40 wt/wt) solution of the copolyesters were determined by an Ubbelohde viscometer.
The melting points (77,) of the phosphorous- containing copolyesters were determined by a Du Pont 910 DSC at a heating rate of 20”C/min under nitrogen atmosphere. The weight loss as a function of temperature was monitored by a Du Pont 951 TGA under oxygen/nitrogen atmo- sphere with a flow rate of 20 ml/min and a heating rate of 20”C/min. The isothermal weight loss of copolyesters at 290°C was also measured by TGA under oxygen atmosphere with a flow rate of 20 ml/min. The isothermal weight loss of copolyesters at 290°C under nitrogen atmosphere at a flow rate of 20 ml/min was also measured for comparison.
The copolyesters were held at 130°C under oxygen atmosphere and the test samples were removed at a time interval of 2 h for analysis. The carboxyl contents (acid values) of the samples (dissolved in benzyl alcohol) were
Scheme 1. DDP TI(OBU) 0 0 estcrlflcatlon + ~-__---~ ---*HC-(!~-!~OCH,CH,O-)n polycondc!nsaL1or PET-co-PEDDP at 230°C at 275°C
determined by titrating with KOH/benzyl alcohol standard solution, using phenol red as the indicator.” Also, the proton nuclear magnetic resonance (NMR) spectra of the samples, before and after heat treatment at 130°C under oxygen atmosphere for 12 h, were determined by a Bruker AM 400 NMR. The IR spectra of the samples, before and after heat treatment under oxygen atmosphere at 130°C for 12 h, were
determined by a Bio-RAD FTS-40 FTIR
Spectrophotometer.
3 RESULTS AND DISCUSSIONS
The charged compositions and the resultant intrinsic viscosities of the phosphorus-containing copolyesters are listed in Table 1. Essentially all the intrinsic viscosities measured were greater than 0.5 dl/g (equivalent to the weight average molecular weight greater than 30,000). All the molecular weights are rather high and the effect of molecular weight on the thermal stability can be considered to be less significant than that of the composition.
Table 1 indicates that the melting points (7J of both types of copolyesters (PET-co-PEPPs and PET-co-PEDDPs) are lower than that of PET (257°C) and has a trend showing lower melting point with increase in phosphorus content. Figure 1 shows the thermogravimetric curves of PET and the two types of the phosphorus-containing copolyesters under nitrogen atmosphere. Table 2
DDP Itaconlc acid
Scheme 3.
Thermal degradation of phosphorus-containing copolyesters 367 Table 1. Compositions, intrinsic viscosities (IV) and melting temperatures (T,) of phosphorus-
containing copolyesters
Sample PET-co-PEPP PET-co-PEDDP IV (Wg) T., (“C)
P Content % (PPA mol %) P Content % (DDP mol %)
PET A B C D E F G H 0 1.0 2.0 3.0 4.0 - 7.4 13.0 17.4 24.2 0 0.63 257 0.59 237 0.55 170 0.51 148 - 0.50 131 0.7 4.5 0.60 235 1.2 7.9 0.62 228 2.0 15.0 0.64 18X 3.0 22.6 0.50 1x0
reveals that PET has the highest thermal stability of PET-co-PEDDPs than PET-co-PEPPs is obvious from the above data.
A comparison of thermal degradation of Sample C, Sample H and PET under nitrogen atmosphere reveals that PET has a higher
thermal decomposition temperature than
Samples C and H. However, the data obtained under oxygen atmosphere are unexpected. Sample H has a higher thermal decomposition temperature than PET and Sample C. This is despite the fact that a flame retardant is expected to have a material with a lower Td value than the base polymer. Table 4 summarizes the initial decomposition temperatures ( Td,) at various weight loss levels for PET and Sample H. In this table, the Tdi values of initial weight loss (l-3%) of Sample H are still lower than PET. However, the formation of a protected char layer derived from flame retardant (under oxygen) raises the
Tdi values (initial weight loss >3%) of Sample H higher than that of PET.
The DSC determined T, results are displayed decomposition temperature ( Td = 417”C), fol-
lowed by PET-co-PEDDPs (between 403 and 378”C), and PET-co-PEPPs have the lowest ones (311-380°C). A trend of lowering the Td with increase in phosphorus content was also observed in the latter case. Figure 2 shows the thermogravimetric curves of PET and the two types of phosphorus containing copolyesters under oxygen atmosphere. The Td values measured under oxygen were listed in Table 2, Td = 381-394°C in the case of PET-co-PEDDPs, Td = 382°C for PET and Td = 338-361°C for PET-co-PEPPs. The weight losses of these phosphorus-containing copolyesters were also studied at 290°C under nitrogen and oxygen atmosphere. Table 3 reveals that PET-co-PEPPs have higher weight losses than PET-co-PEDDPs except for Sample E. Thus, a better thermal
I I
200 400 Temperature (“C)
Fig. 1. Thermogravimetric curves of copolyesters: (1) PET, (2) Sample H, (3) Sample C under nitrogen atmosphere.
Table 2. The decomposition temperature (Td) of copolyesters under nitrogen/oxygen
atmosphere
Sample Under NZ Under O2
WC) Td (“C) PET 417 382 A 380 358 B 376 361 C 363 338 D 311 339 E 398 386 F 378 3x1 G 401 387 H 403 394 ____
0 200 JO0
Tempersture (“C)
Fig. 2. Thermogravimetric curves of copolyesters: (1)
Sample H. (2) PET, (3) Sample C under oxygen
atmosphere.
in Table 1. The T, of all copolyesters are above 130°C. The thermal stability was studied at a temperature below their T,,,. The heat treatment of copolyesters at 130°C under oxygen atmo- sphere can be considered as an accelerated test condition for the material life. Furthermore, their degradation can be monitored by the change of acid values at various time intervals. Figure 3 shows only a limited change in the acid value (from 38.7 to 48.4 meq/kg) for PET after 12 h thermal treatment. For PET-co-PEDDP copol- yesters (e.g. Sample H), the acid values only increase slightly from 39.0 to 58.0 meq/kg. Significantly more acid value increases have been observed for the PET-co-PEPP copolyesters, e.g. Sample C. The extent of acid value increase during heat treatment depends on the phos- phorus content, i.e. the higher the phosphorus content the greater the increase in acid value.
Table 4. Initial decomposition temperature (Tdi) at l-5% weight loss of PET and Sample H under oxygen at a heating
rate of ZO”C/min
Sample
I “4,
Heat treatment of these copolyesters was performed at 130°C under oxygen atmosphere for 12 h and at 300°C under nitrogen atmosphere for 10 min to study the mechanism of thermal degradation. The decomposed residual organic compounds were analyzed via NMR and IR spectroscopy. Figure 4 shows the IR spectra of Sample C before and after heat treatment at 130°C under 0, atmosphere for 12 h. The assignments and relative peak intensities of Sample C are displayed in Table 5. The absorption peaks of Sample C before and after heat treatment were consistent with the chemical structure. Furthermore, the relative peaks inten- sity of the P=O, PO-C and P=O peaks decreased after heat treatment, thereby implying that phosphonate units were lost during the heat treatment. Thus, the ethylene phosphonate unit was more readily attacked under such treatment. Before heat treatment, the relative indensity of P-O is 15.8; after heat treatment, it has decreased to 14.2. The decrease in relative intensity was due to the P-O bond cleavage. The same relative intensity ratios were observed at PO-C and P-O (72: 64.9 = 1.11: 1, 15.8: 14.2 = 1.11: 1) since the PO-C absorption decreased simultaneously as P- -0 bond cleavage occurred.
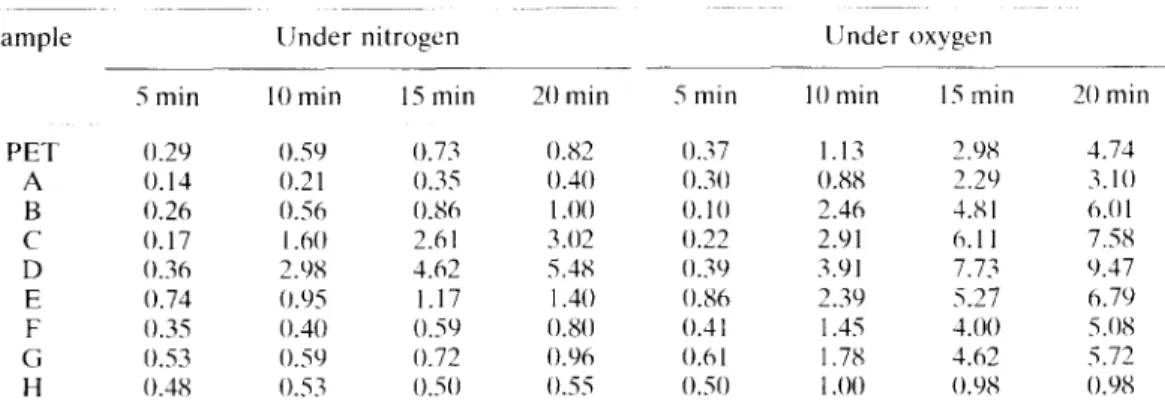
Table 3. The weight loss (%) of copolyester under nitrogen/oxygen atmosphere at 290°C Sample PET A B c D E F c; H 5 min 0.29 0. I4 0.26 0.17 0.36 0.74 0.35 0.53 0.38 linder nitrogen IO min IS min O.SY 0.73 0.21 0.35 0.56 0.86 1 .hO 2.hl 2.98 3.62 0,‘)s 1.17 0.40 0.5Y 0.50 0.72 0.s.i 0.50 20 min 0.82 0.10 I .oo 3.02 5.48 I .40 0.80 O.Y)6 0.55 5 min 0.;7 OM 0.10 0.22 0.3Y 0.86 0.3 I 0.6 I 0.50 llnder oxygen 10 min 15 min 1.13 2.YX 0.8X 2.29 2.46 1.81 2.91 6.1 I 3.91 7.73 2.3Y 5.27 I .45 1.00 1.7x 3.62 1 .oo NY8 ._ 20 min 4.74 3.10 h.Ol 7.58 Y.37 h.7Y 5.08 5.72 O.YX
Thermal degradation of phosphorus-containing copolyesters 369
Heating time (hrs)
Fig. 3. Acid value versus heating time for polymer: (1) PET, (2) Sample C, (3) Sample H under oxygen.
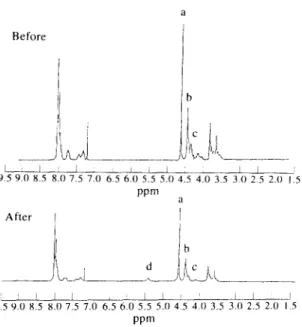
The NMR spectra of Sample C before and after heat treatment under nitrogen atmosphere at 300°C for 10 min are shown in Fig. 5. The peak assignments and their relative peak areas (integrated intensity) are listed in Table 6. The resonance peaks of methylene proton of Sample C exhibited triplet. Scheme 4 displays the meth- ylene peak assignment for various sequences. The chemical shifts of methylene protons of T-E-T, T-E-P (P-E-T) and P-E-P sequences are located at 4.70, 4.52 and 4.43 ppm, respectively. The spectra of Sample C before heat treatment are consistent with the chemical structure. From peak a and peak c (peak area ratio =lOO: 32.5), the mol% of PPA (base on diacids) was found to be 24.3 which is close to the charged value. The NMR spectrum of Sample C after heat treatment showed the appearance of an small peak at
Table 5. The assigment peaks of IR absorption and relative intensity of Sample C before and after heat treatment at
130°C under oxygen atmosphere for 12 h Functional group
Wave number (cm -‘) Relative intensity before
heat treatment
P=O P-0-C P-O c=o 1228 1131 970 1721 82.5 72.0 15.8 100.0 Relative intensity after
heat treatment
81.0 64.9 14.2 100.0
5.54ppm. Thus, the chemical structure has been changed, to some extent, to generate the vinyl group after heat treatment. Although only qualitative results could be obtained from this additional small peak, the peak area ratio of peaks a and b, a and c provided further information. The ratio of peaks a and b was 100: 83.3 for Sample C before heat treatment and 100: 64.6 after heat treatment. The ratio of peaks a and c was 100: 32.5 for Sample C before heat treatment and 100:17 after heat treatment. Such an occurrence indicated that phosphonate units were lost after heat treatment. It appears that the ethylene phosphonate unit can be attacked readily under such heat treatment conditions, and results in a faster thermal degradation rate with higher ethylene phosphonate content in the copolyesters.
The IR and NMR spectra of PET-co-PEDDP (Sample H) before and after heat treatment are shown in Figs 6 and 7. The spectrum variation, before and after heat treatment, is insignificant.
Before
4000 3500 3000 2500 2000 1500 1000 500
Wavenumbers
I I I 1 I I I 9 5 Y 0 X.5 8.0 7.5 7.0 6.5 6.0 5.5 5.0 4.5 4.0 3.5 3 0 2 5 2.0 1.5 wm il After I I I I I , 9.5 9.0 X.5 X.0 7.5 7.0 6.5 6.0 5.5 5.0 4 5 4 0 3.5 3.0 2.5 2.0 I 5 wm
Fig. 5. NMR spectra of Sample C before and after thermal treatment at 300°C under nitrogen for 10 min.
These results exhibit the same trend as those obtained from the change in acid value and weight loss of TGA. As mentioned earlier (Fig. 3), relative to PET-co-PEDDPs, the acid values of PET-co-PEPPs increased quite substantially after heat treatment at 130°C under oxygen atmosphere for 12 h. If the degradation is initiated from the chain end, the acid value should have changed only slightly. Experimental results indicate that the degradation is a main chain scission process. The IR and NMR data indicated that the ethylene phosphonate unit was more easily attacked, which provided additional evidence of a main chain scission process. Data show that the acid value increased as ethylene phosphonate content was increased. If a de- gradation process is from the chain ends, the thermal stability will be less dependent on the composition, Experimental results verified the insignificant effect on PET-co-PEDDPs after heat treatment. This is because of the incorporation of phosphorus linkage as a pendant groups. When Table 6. The assignment of protons and relative peak area of Sample C before and after heat treatment under nitrogen
atmosphere at 300°C 10 min Protons
(indicated in Fig. 5)
Chemical shift (ppm) 4.70 4.52 4.43 5.54
Relative peak area before 100.0 83.3 32.5
heat treatment
Relative peak area after 100.0 64.6 17.0 1X.5
heat treatment
,I _~ ,I __ ,’
Scheme 4.
the P-O bond cleavage occurs at the pendant groups, the copolyester backbone should still be maintained. Thus, the thermal stabilities of PET-co-PEDDPs are expected to be similar to those of PET.
4 CONCLUSIONS
The thermal stabilities of phosphorus-containing copolyesters have been investigated. The thermal stability of copolyesters decrease as the phos- phorus content is increased as shown by
Before *i i i i_ _‘-.^i l- .~ ~..~ ---- 3500 3000 2500 2000 I so0 I on0 500 Wavenumbers
Fig. 6. IR spectra of Sample H before and after thermal treatment at 1300°C under oxygen for I2 h.
Thermal degradation of phosphorus-containing copolyesters 371 Rcfore I I I 1 1 1 1 ’ ’ ’ 1 ’ ’ ’ ’ ’ 9.5 9.0 X.5 8.0 7.5 7.0 6.4 6.n 5.5 5.0 4.5 4.0 3.5 3.0 2.5 2.0 l.S PPm After 9,s 9.0 8.5 8.0 7.5 7.0 6.5 6.0 5.5 5.0 4.5 4.0 3.5 3 0 2.5 2.0 1.5
Fig. 7. NMR spectra of Sample H before and after thermal treatment at 300°C under nitrogen for 10 min.
thermogravimetric and carboxylic value analyses.
Greater thermal stability was found for copolyes- ters at 290°C under inert gas. The presence of
oxygen significantly enhances the thermal de-
gradation of the copolyesters. At 130°C (a
temperature lower than T,) under oxygen
atmosphere, the PET-co-PEPPs degraded sig-
nificantly as indicated by the rapid increase of the
acid value. On the contrary, PET-co-PEDDPs
degraded insignificantly under the same heat
treatment condition. The thermal stabilities are:
PET > PET-co-PEDDPs > PET-co-PEPPs. The
incorporation of the phosphorus linkage into the
main chain backbone results in lower thermal
stability of PET-co-PEPPs. On the contrary, the
phosphorus linkage as pendant groups (PET-co-
PEDDP) does not cause main chain scission and maintains better thermal stability. IR and NMR
spectrum analyses revealed that the ethylene
phosphonate unit (P-O bond) is more readily
attacked, therefore, the thermal stability of the
phosphorus-containing copolyesters decreases
with increasing phosphorus content.
REFERENCES 1. 2. 3. 4. 5. 6. 7. 8. 9. 10. 11. 12.
Lyons, J. W., Flame Retardants, ed. C. J. Hilado. Technomic Publications, Conn., 1973.
Hoechst, A. G. Co., U.S. Patent 3,941,752; 1976. Hoechst, A. G. Co., U.S. Patent 4,033,936; 1977. Toyobo Co. Ltd. Germany Patent 2,646,218; 1977. SRI International, Flame Retardants, in speciality chemicals-A Maltichent Report November, 1993. Aronson, A. M., Phosphorus Chemistry Developments
in American Science, eds E.N. Walsh, E.J. Griffith,
R.W. Parry & L.D. Quin. Acs, Washington D.C., 1992. Chang, S. J., J. Appl. Polym. Sci., 39 (1990) 225. Chang, S. J., Polym. Degrad. Stab., 23 (1989) 239. Zimmerman, H., Polym. Engng Sci., 20 (1980) 680. Ponnusamy, E., Polym. Engng .I., 19 (1987) 1209. Toyobo Co. Ltd. Japan Patent 04,281; 1979, 016. Passalacqua, V., Polymer, 17 (1976) 1044.