Happiness and social determinants across age cohorts in Taiwan Abstract
The purpose of this study was to examine happiness and social determinants across age cohorts in Taiwan. The data were obtained from the 2011 Taiwan Social Change Survey (aged 18 +, n=2,135). The social determinants to happiness included socioeconomic status and social connection. Happiness was not different across the age groups. Receiving less family support, less formal support, more social trust and more control over life were significant for the younger group. Being married and having more social participation were significant for the middle-aged. Receiving less family support and having a higher economic status were significant for the older group.
Key words: happiness, cohort difference, social connection, social capital, social support, socioeconomic status
Introduction
Security and social connection are basic needs of humans. Based on Maslow’s theory of the hierarchy of needs (Maslow, 1943), when physiological and safety needs are met,
love/belonging (from friendship, family, intimacy) is the social need for connection with individuals, which links to subjective happiness; the esteem and self-actualization are then considered. Psychological research has explored the factors related to happiness, including social dimensional factors, such as socioeconomic status (Bishop et al., 2010; Oishi et al., 2011; Waldinger and Schulz, 2010), social network, social contact, social support, and social capital (Cooper et al., 2011a; Cooper et al., 2011b; Litwin and Shiovitz-Ezra, 2011).
Research also has found there is a U-shaped relationship between age and happiness
(Blanchflower and Oswald, 2008; de Ree and Alessie, 2011). The socioeconomic status and social connection in different age cohorts may be very different because of the life course transitions. However, there is little research exploring the relationship between social determinants and happiness across different age cohorts. The aim of this study was to examine to the relationship between happiness and social determinants across younger, middle, and older aged cohorts in Taiwanese adults.
Social Determinant and Theoretical Explanations
There are several theoretical explanations of happiness: (1) Seligman’s trinity: Seligman (2003) indicates that happiness is positive psychology, and happiness is composed of three desirable lives: the pleasant life, the good life, and the meaningful life. (2) Rank income hypothesis: Boyce et al. (2010) found that the rank positions of income, not absolute income or reference income, affected happiness. This can be explained by the results of social comparison. (3) Social contagion effect: Clark & Etilé (2011) found that subjective wellbeing is related to the partner’s situation. (4) Social capital: Social capital is the accessible or mobilized resources through purposeful actions in the social structure. There are three forms
of social capital: the obligation, expectation and trust, the information tunnel, and the norm and effective punishment (Coleman, 1988). Social capital may promote health through strengthening the individual’s social capital and collective social capital (Eriksson, 2011). Thus, the psychological wellbeing, including happiness, is positively related to social capital. Empirical studies have found that happiness is related to a higher social support, a larger social network, and a higher social trust (Calvo et al., 2012; Nyqvist et al., 2008; Oishi et al., 2011). This is also true for the population in East Asia (Yamaoka, 2008). A diverse social network and a larger social contact are related to happiness (Cooper et al. 2011a; Cooper et al. 2011b; Litwin and Shiovitz-Ezra, 2011). (5) Marital status (social causation and social selection): Social causation theory and social selection theory were used to explain the relationship between marital status and happiness (Joung et al., 1997; Mastekaasa, 1992). Marriage provides emotional support, financial support, the care of physical health, and social integration for married individuals; thus, marriage is beneficial to physical and
psychological health (Stack and Eshleman, 1998). Studies have found that marital status and marital satisfaction are related to happiness (Giordano and Lindström, 2011; Murray et al., 2011; Peiró 2006; Waldinger and Schulz, 2010).
Based on the Happiness trinity framework, meeting the basic desire of life needs is related to happiness, which is consistent with the findings of a positive relationship between socioeconomic status and happiness (Bishop et al. 2006; Boyce et al. 2010; Oishi et al. 2011; Waldinger et al. 2010). The trinity framework also proposes that when life is meaningful, individuals are more likely to be happy. Empirical studies have also demonstrated that individuals who participate in social participation, work, or volunteering (Borgonovi, 2008; Waldinger et al., 2010) are more likely to be happy. Supporting others (Dunn et al., 2008) may make an individual happy, particularly when spending money on the strong social ties (Aknin et al., 2011). Thus, it is hypothesized that individuals more likely feel happy if (a)
they are satisfied with their economic status; (b) they are able to provide support to other individuals; and (c) they participate in social groups or volunteering for activities that are beneficial for others. Based on the rank income hypothesis and the social contagion effect, when individuals are with other individuals better than their status, they are less likely to be happy. In contrast, if they are with individuals with a worse status, they are more likely to be happy. Thus, it is hypothesized that individuals are happier if their social class ranking is higher than others. From the perspective of social capital, it is hypothesized that the individuals with a higher social capital, i.e., a larger social network, receiving more social support, or having a higher general trust towards the community or society are more likely to be happy.
Age and happiness
Studies have found a U-shaped relationship between age and happiness (Blanchflower and Oswald, 2008; de Ree and Alessie, 2011; Schatz et al., 2012). Thus, it is hypothesized that the happiness level would be higher for the younger group and the older group, but lower for the middle–aged group. Due to the different life courses that the individuals in each group experience, the factors related to happiness for the different age cohorts are hypothesized to be different.
Other factors related to happiness
Diverse variables are also related to happiness in the existing research, such as living in a rural area (Mair and Thivierge-Rikard, 2010), a coping and positive mind (Kim et al., 2012) and personality (Moltafet et al., 2010), religiosity and attending religious activity (Cooper et al. 2011b; Lewis et al., 2005; Stavrova et al., 2013), the environment and politics (Boehnke and Wong, 2011; Summers et al., 2012), life events (Ballas and Dorling, 2007), daily activities (Oerlemans et al., 2011), physical health (Bishop et al. 2006; Bishop et al. 2010), and a healthy lifestyle, such as non-smoking, drinking alcohol, and exercise (Nyqvist et al.
2008; Peiró 2006; Shahab and West, 2009; Zander et al., 2013). In addition, the internet use has been the main pathway of social interaction recently, particularly for the younger generations. For the older population, internet use can be a good approach to social
connection (Beringer and Smixsmith, 2013). Yet, the effect of online friends or social media on happiness is not consistent in the existing research (Helliwell and Huang, 2013;
Grabowicz et al., 2012). The internet access in Taiwan has achieved 70% or above (Sixsmith et al., 2013). Some studies also showed that positive influences of internet use on happiness or quality of life of the elderly in Korea, where is in a fast developed internet network (Seo, 2014; Yoo and Son, 2012).
Social determinants occupy an important role for all factors related to happiness. Although related factors associated with happiness were examined in previous research, the cohort differences have not been previously compared. Social factors related to happiness may show different effects on happiness across the life course. Thus, the purpose of this study was to examine the social factors related to happiness across younger, middle-aged, and older cohorts in Taiwanese individuals. The finding about the relationship between social factors and happiness in the different life courses is expected to provide implications for further research about happiness and subjective wellbeing.
Methods
Data and samples
The data were obtained from the 2011 Taiwan Social Change Survey (TSCS), which was first initiated by the National Science Council in 1985. Since 1990, the TSCS has utilized two annual survey modules: one is to repeat major research topics, such as family, social stratification, mass communication, and religion, every five years; the other one is designed for other social phenomena important in social science and Taiwan’s society. The data used
in this study were from the 2011 TSCS Health questionnaire module, and 2,199 individuals completed the survey.
Measures Happiness
The dependent variable assessed if the participants lived a happy life in general. The item was coded from 1 to 5, indicating very unhappy to very happy, respectively.
Age group
The samples were divided by age into 3 cohort groups: young (aged 18 to 39), middle-aged (middle-aged 40 to 64), and elderly (middle-aged 65 or more).
Social determinants
The social determinants were divided into two groups: socioeconomic status and social connection.
(1) Socioeconomic status included educational years, working status (no/yes), subjective economic status (from insufficient to very sufficient, scored from 1 to 5), as well as social class and life control. Social class referred to how the respondents rated their social status from 1 to 10. A higher score indicated a higher social status. Life control rated the degree of freedom in choosing and controlling the individual’s life and was scored from 1 to 10. A higher score indicated more choice.
(2) Social connection included marital status (having a spouse or not), social support, social group participation, and social trust. Social support referred to how often the
participants received emotional, monetary, or instrumental help from family/relatives, friends/colleagues/neighbors, and support from formal providers (such as social workers, therapists, or home helpers). The score for each item was coded from 1 to 5, representing received help from none to always, respectively. The total score for each category of social support ranged from 3 to 15. Social group participation referred to the frequency of
participating in social groups and ranged from 1 to 5, indicating never to often, respectively. Social trust was a general trust feeling towards individuals. The score ranged from 1 to 4, which indicated always being cautious to always trustful, respectively.
Other factors
Other factors related to happiness included:
(1) Demographics: Gender (male/female), living environment (urban/town/rural), living arrangement (alone/with others), and religious belief (no/yes).
(2) Health and lifestyle-related factors included body mass index (BMI), chronic diseases, self-rated health, negative affect, smoking, drinking alcohol, regular exercise, internet use, and the quality of life. BMI was defined as the weight (Kg) divided by the square of the height (Km). Chronic disease was coded as having a chronic disease or not having a chronic disease (yes/no). Self-rated health was rated from poor to excellent and was coded good/poor. Negative affect was measured by the frequency, in the past month, of the following situations: feeling pain, depressed, loss of confidence, feeling unable to conquer a difficulty, low and blue, and peaceful. Each item was rated by the frequency, which ranged from never to always (score 1 to 5, respectively), and the “peaceful” item score was reversed. Then, the total scores of the 6 items were summed as the negative affect and scored from 6 to 30. Smoking (never/quit/current smoking) and drinking alcohol were coded as never, social (once a month or less), light (couple times a month), or heavy (several times a week or every day). Regular exercise was coded as no (less than once per week) or yes (several times per week or every day). Internet use was coded as no/yes. The quality of life rated how satisfied an individual felt with life.
Analysis
The data were analyzed by descriptive analysis, Chi-square tests and one-way ANOVA tests by age groups and a linear regression analysis of happiness by all samples and 3 age
groups. All continuous independent variables were centered in the regression models. The analysis was weighted by the sampling proportion.
Results
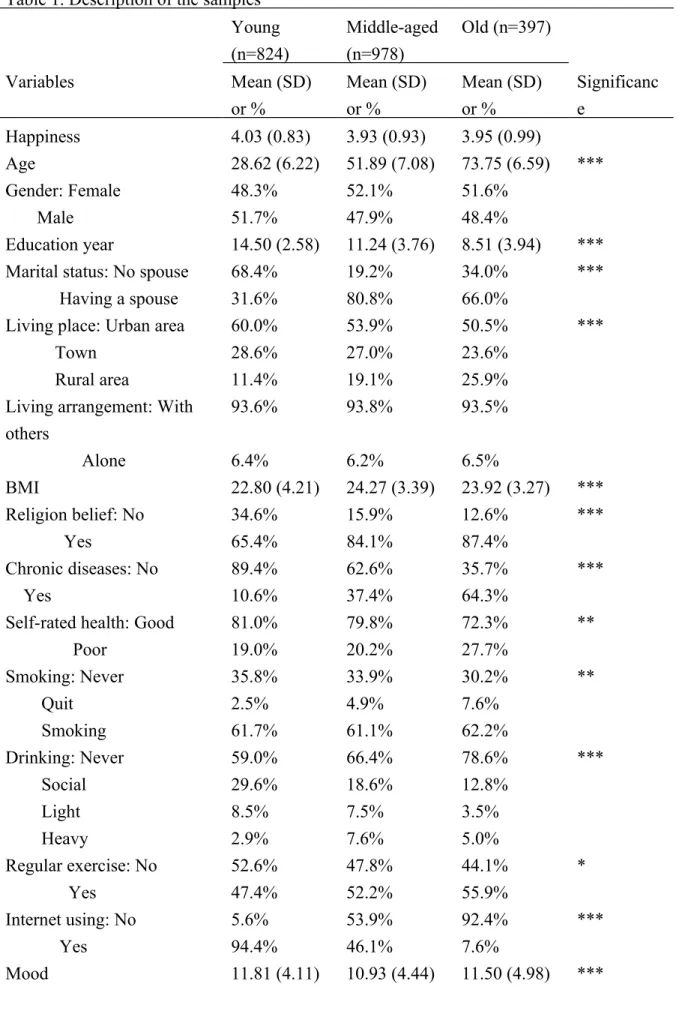
Table 1 shows the sample descriptions of the three age groups. Most characteristics were significantly different across the age groups. However, happiness was not different.
Table 2 shows the linear regression analysis of all samples, including the young group, the middle-aged group, and the older group. The total explanation of the variance for all samples was 44.1%. In the total sample model, being younger (β=−0.064), less educated (β=−0.065), a non-smoker (β=−0.186 for smokers), a social drinker (β=0.106) or a light drinker (β=0.134), having less negative affect (β=−0.276), receiving less social support from family (β=−0.042), more participation of social groups (β=0.049), more social trust
(β=0.047), a higher subjective economic status (β=0.048), more life control (β=0.018), and a higher quality of life (β=0.317) were related to higher happiness. Gender, marital status, living place, living arrangement, BMI, chronic disease, self-rated health, support from friends and formal providers, and working status were not significant.
In the younger group model, the total explanation of the variance was 43.6%. Being female (β=0.120), a non-smoker (β=−0.184 for smokers), a light drinker (β=0.171), less negative affect (β=−0.225), receiving less support from family (β=−0.081) and formal providers (β=−0.052), more social participation (β=0.051), a higher social trust (β=0.089), a higher social control (β=0.112) and a higher quality of life (β=0.272) were related to more happiness for the younger group. Compared with the total samples, age, education, subjective economic status, and social class were not significant.
In the middle-aged group, the explained variance was 46.8%. Being a non-smoker (β=−0.184 for smokers), and having a spouse (β=0.151), less negative affect (β=−0.273), more social participation (β=0.072), and a higher quality of life (β=0.343) were related to
more happiness for the middle-aged participants. Social support, social trust, social class, or life control were not significant.
In the older group, the model explained the variance was 54.4% and was the highest of the subgroups. In the older participants, being less educated (β=−0.147) and having less negative affect (β=−0.415), a higher subjective economic status (β=0.160), and a higher quality of life (β=0.358) were related to higher happiness. Health-related variables, social support, social trust or social participation were not significant.
Discussion
This study used cross-sectional survey data to examine the factors related to happiness for different age cohorts in Taiwan. In general, the consistent predictors of happiness across the three age cohort groups were negative affect and quality of life. Healthy behaviors, social capital (receiving social support, social group participation, and social trust) and the degree of life control had larger effects for the younger and the middle-aged groups. Marital status was particularly important for the middle-aged group. Education and subjective economic status were more important to determine happiness for the older group. Thus, social connection factors seemed to be more related to the younger and middle-aged generations than the older cohort, while socioeconomic status determined happiness for the elderly.
The relationship between social connection and happiness showed different patterns across the three age groups. Receiving social support from family and formal providers was negatively related to happiness only for the younger group, whereas receiving any category of social support was not significant for the other two groups. It is possible that receiving support from formal providers may represent a vulnerability for the younger group, and the support provided by family may not always be positive (Krause, 2001). However, for the older generation, support population, receiving formal support may be recognized differently with younger generation. Although receiving formal support was not significant for the older
individuals, the relationship was positive and the coefficient was large. This finding implies providing formal support is not just a service but also has a function of emotional care for the older individuals. Through the visit by the formal service workers, the older individuals would feel cared for and happier. This result is very similar with previous Asian study, that formal support has positive effects on positive psychological well-being of elderly (Yoo and Son, 2012). Marital status is also viewed as a kind of social support. However, having a spouse was only positively related to happiness for the middle-aged group. It is possible that the number of married individuals in the younger group was lower and being a family caregiver for a spouse in the older group is more like a burden and less related to happiness.
In addition to social support, the second indicator of social connection is social participation. Social participation has been related to subjective wellbeing and happiness (Borgonovi, 2008; Waldinger et al., 2010). In this study, the working status was not significant, and the social group’s participation was positively related to happiness for the younger and the middle-aged groups but not for the older group. It is possible that the
participation in social networks and social groups mean a lot for the younger and middle-aged individuals compared with the elderly. Through the process and the engagement of social participation, individuals obtain social capital and the chance to prove the value of
themselves. The older Taiwanese individuals are less likely to participate in social groups because in the traditional society, individuals think that the wellness for the elderly does not work or involves social matters (Hsu, 2007). The percentage of social group participation is not high for the current Taiwanese elderly cohort. However, this concept is changing; more individuals accept the idea of active aging and have become more willing to be volunteers or participate in social groups when they get older. It is expected that social group participation will be more prevalent and more related to happiness in older individuals in the future.
Another indicator of social capital is social trust. Past research has found that general trust is related to self-rated health (Mansyur et al., 2008; Nyqvist et al., 2008) and subjective wellbeing (Calvo et al., 2012; Nyqvist et al., 2008; Oishi et al., 2011). In this study, social trust was positively related to happiness in the whole population, but it was significant only for the younger group. It is possible that social trust and social capital are different across age groups (Cooper et al., 2010b); the younger group had a higher trust than the middle-aged group and the older group. There was little discussion about the age differences in social trust in previous studies. If social trust decreases over time, then social capital would also decrease when the individuals get older. Furthermore, there will be less social connections for older individuals, and the happiness from social connections is expected to be much less for the elderly.
While social connection was significantly related to happiness for the younger and middle-aged groups, socioeconomic status was more important for the older cohort. The older cohort has usually experienced a poor and insecure youth because of previous wars, and economic security has been reported as a successful aging component for the Taiwanese elderly (Hsu, 2007). However, the older individuals with a higher education were less happy. It is possible that the individuals with a higher education expect more in life, but they are not satisfied with their current status. The statement “content is happiness” is most likely true.
The subjective rating of quality of life showed the biggest effect on happiness of all the predictors in all three age groups. The subjective rating of the quality of life is similar to the concept of subjective wellbeing, and past research has indicated that happiness is a
component of subjective wellbeing (Bishop et al., 2010). If the quality of life was explained as an overall rating of the multiple dimensions in our lives, then improving the quality of life in all dimensions will make individuals happier. These findings suggest the quality of
related to happiness for individuals. The policy makers should consider how to improve these realistic issues to make individuals happy about their lives.
Happiness is usually viewed as the maximum of positive affect. Diener et al. (1991) argued that happiness is the frequency of positive affect versus negative affect. In this study, negative affect was significantly related to happiness, which is consistent with previous research (Moreno et al., 2014). Furthermore, the centered effect of negative affect was larger in the older group than the younger and the middle-aged groups. Negative affect or
psychological distress may be a more serious problem for older individuals, and thus affected their happiness.
Past studies have found that living a healthy lifestyle is related to happiness (Nyqvist et al., 2008; Peiró, 2006; Shahab and West, 2009; Zander et al., 2013). In this study, we found that the smokers of all age groups were less happy. Smoking is sometimes a coping strategy for individuals when they are under stress or feel depressed (Kleinket et al., 1982). Research has also demonstrated that smoking may be related to depressive symptoms (Patton et al., 1998; Kendler et al., 1993). This study found that the social and light drinkers were more likely to be happy than the non-drinkers, particularly for the middle-aged group; heavy drinkers reported less happiness although the finding was not significant. Research has found that moderate drinking is related to better psychological wellbeing (Ferreira and Weems, 2008). In addition, social drinking may represent an active social life, which is the actual reason for happiness. Regular exercise was not significantly related to happiness as expected. However, regular exercise was positively related to happiness for the older group, even though the health indicators (self-rated health and chronic disease morbidity) were controlled. This finding implies that doing regular exercise does not only promote physical health but also may be beneficial for emotional health in older individuals. The use of the internet was not significantly related to happiness for any age group. However, using the internet was
negatively related to happiness for the younger group and the middle-aged group, but
positively related to the older group. In Taiwan, almost all young individuals use the internet for study, work, leisure or social networking. It is also common for middle-aged individuals to use the internet for work and leisure. Determining whether there is an internet addiction problem for the younger and middle-aged groups, and therefore, less connect with the real world needs further research.
There are some limitations of this study. First, the data were cross-sectional; thus, the causal relationship between happiness and the related factors cannot be confirmed. Second, secondary data were used for the analyses, and thus, some of the variables may be
unavailable in the data, such as personality and an evaluation of the social environment. Third, the samples included Taiwanese individuals. There may be cultural differences in the expression of happiness and related factors. Thus, the results may not be generalized to individuals in other areas.
Conclusion
Happiness was not different across different age cohort groups in Taiwanese people. However, the social factors related to happiness showed different relationships with
happiness across the age groups. Socioeconomic status was more significant in determining happiness for older individuals, while a social relationship was more important for the younger and middle-aged individuals. The findings suggest that the dynamic changes in social relationships in the life course may affect psychological well-being. It is suggested that the dynamic changes in the social factors in the life course and the effects on happiness should be investigated in future research. It is also suggested that to maintain social support, encourage social engagement, and reduce the social disparity, it would be important to improve the psychological wellbeing in the policy.
The research was supported by grants from the Ministry of Science and Technology, Taiwan, Republic of China (MOST 103-2410-H-468-013-MY2), and by the National Research
Foundation of Korea Grant funded, Republic of Korea (NRF-2013S1A3A2054886). The data was provided by the Survey Research Data Archive, Academic Sinica, Taiwan ROC.
Declaration of Conflicting Interests
The authors declare that there is no conflicts of interest. References
Akin LB, Sandstrom GM, Dunn EW, Norton M I (2011) It’s the recipient that counts: Spending money on strong social ties leads to greater happiness than spending on weak social ties. Plos ONE 6: e17018. doi:10.1371/journal.pone/0017018
Ballas D, Dorling D (2007) Measuring the impact of major life events upon happiness. International Journal of Epidemiology 36: 1244-1252.
Beringer R, Smixsmith A (2013) Videoconferencing and social engagement for older adults. In: Sixsmith A, Gutman G (Ed.) Technologies for Active Aging. New York: Springer, pp. 189-199.
Bishop AJ, Martin P, Poon L (2006) Happiness and congruence in older adulthood: a structural model of life satisfaction. Aging & Mental Health 10: 445-453.
Bishop AJ, Martin P, MacDonald M, Poon L, for the Georgia Centenarian Study (2010) Predicting happiness among centenarians. Gerontology 56: 88-92.
Blanchflower DG, Oswald AJ (2008) Is well-being U-shaped over the life cycle? Social Science & Medicine 66: 1733-1749.
Boehnke K, Wong B (2011) Adolescent political activism and long-term happiness: a 21-year longitudinal study on the development of micro- and macrosocial worries. Personality and Social Psychology Bulletin 37: 435-477.
and self-reported health and happiness. Social Science & Medicine 66: 2321-2334. Boyce CJ, Brown GDA, Moore SC (2010) Money and happiness: rank of income, not
income, affects life satisfaction. Psychological Science 21: 471-475.
Calvo R, Zheng Y, Kumar S, Olgiati A, Berkman L (2012) Well-being and social capital on planet earth: Cross-national evidence from 142 countries. PloS ONE 7: e42793. doi: 10.1371/journal.pone.0042793.
Clark AE, Etilé F (2011) Happy house: spousal weight and individual well-being. Journal of Health Economics 30: 1124-1136.
Coleman JS (1988) Social capital in the creation of human capital. American Journal of Sociology 94(Suppl): 95-120.
Cooper C, Bebbington P, Livingston G (2011a) Cognitive impairment and happiness in old people in low and middle income countries: results from the 10/66 study. Journal of Affective Disorders 130: 198-204.
Cooper C, Bebbington P, King M, Jenkins R, Farrell M, Brugha T, et al. (2011b) Happiness across age groups: results from the 2007 National Psychiatric Morbidity Survey. International Journal of Geriatric Psychiatry 26: 608-614.
de Ree J, Alessie R (2011) Life satisfaction and age: dealing with underidentification in age-period-cohort models. Social Science & Medicine 73: 177-182.
Dunn EW, Aknin LB, Norton MI (2008) Spending money on others promotes happiness. Science 319: 1687-1688.
Diener E, Sandvik E, Pavot W (1991) Happiness is the frequency , not the intensity, of positive versus negative affect. In: Strack F, Argyle M, Schwarz N. (Ed.) Subjective well-being: an interdisciplinary perspective. Oxford: Pergamon Press, pp. 119-140. Eriksson M (2011) Social capital and health- implications for health promotion. Global
Ferreira M P, Weems MK (2008) Alcohol consumption by aging adults in the United States: health benefits and detriments. Journal of the American Dietetic Association 108: 1668-1676.
Giordano GN, Lindström M (2011) Social capital an change in psychological health over time. Social Science & Medicine 72 1219-1227.
Grabowicz PA, Ramasco JJ, Moro E, Pujol, JM, Eguiluz VM (2012) Social features of online networks: the strength of intermediary ties in online social media. PLoS ONE 8: e29358. doi: 10.1371/journal.pone.0029358.
Helliwell JF, Huang H (2013) Comparing the happiness effects of real and on-line friends. PLoS ONE 8(9): e72754. doi: 10.1371/journal.pone.0072754.
Hsu HC (2007) Exploring elderly people’s perspective on successful aging in Taiwan. Ageing & Society 27: 87-102.
Joung IMA, Stronks K, van de Mheen H, van Poppel FWA, van der Meer JBW, Mackenbach JP (1997) The contribution of intermediary factors to marital status differences in self-reported health. Journal of Marriage and Family 59: 476-490.
Kendler KS, Neale MC, MacLean CJ, Health AC, Eaves LJ, Kessler RC (1993) Smoking and major depression: a causal analysis. Archives of General Psychiatry 50: 36-43.
Kim J, Suh W, Kim S, Gopalan H (2012) Coping strategies to manage acculturative stress: meaningful activity participation, social support, and positive emotion among Korean immigrant adolescents in the USA. International Journal of Qualitative Studies on Health Well-being 7: 10.3402/qhw.v7i0.18870.
Kleinke CL, Staneski RA, Mason JK (1982) Sex differences in coping with depression. Sex Roles 8: 877-889.
Krause N (2001) Social support. In: Binstock RH, George LK, (Ed.) Handbook of Aging and the Social Sciences, 5th ed (pp. 272-294.). San Diego: Academic Press.
Lewis CA, Maltby J, Day L (2005) Religious orientation, religious coping and happiness among UK adults. Personality and Individual Differences 38: 1193-1202.
Litwin HL, Shiovitz-Ezra S (2011) Social network type and subjective well-being in a national sample of older Americans. The Gerontologist 51: 379-388.
Mair CA, Thivierge-Rikard RV (2010) The strength of strong ties for older rural adults: regional distinctions in the relationship between social interaction and subjective well-being. International Journal of Aging and Human Development 70: 119-143.
Mansyur C, Amick BC, Harrist RB, Franzini L (2008) Social capital, income inequality, and self-rated health in 45 countries. Social Science & Medicine: 66, 43-56.
Maslow AH (1943) A theory of psychological motivation. Psychological Review 50: 370-396.
Mastekaasa A (1992) Marriage and psychological well-being: some evidence on selection into marriage. Journal of Marriage and Family 54: 901-911.
Moreno RL, Godoy-Izquierdo D, Pérez MLV, Garcia AP, Serrano FA, Garcia JFG (2014) Mutidimensional psychosocial profiles in the elderly and happiness: a cluster-based identification. Aging & Mental Health 18: 489-503.
Moltafet G, Mazidi M, Sadati S.(2010) Personality traits, religious orientation and happiness. Procedia Social and Behavioral Science 9: 63-69.
Murray SL, Griffin DW, Derrick JL, Harris DB, Aloni M, Leder S (2011) Tempting fate or inviting happiness?: Unrealistic idealization prevents the decline of marital satisfaction. Psychological Science 22: 619- 626.
Nyqvist F, Finnäs F, Jakobsson G, Koskinen S (2008) The effect of social capital on health: the case of two language groups in Finland. Health & Place 14: 347-360.
Oerlemans WM, Bakker AB, Veenhoven R (2011) Finding the key to happy aging: a day reconstruction study of happiness. Journal of Gerontology, Series B: Psychological
Sciences and Social Sciences 66: 665-674.
Oishi S, Kesebir S, Diener E (2011) Income inequality and happiness. Psychological Science 22: 1095-1100.
Patton GC, Carlin FJB, Coffey C, Wolfe R, Hibbert M, Bowes G (1998) Depression, anxiety, and smoking initiation: a prospective study over 3 years. American Journal of Public Health 88:1518-1522.
Peiró A (2006) Happiness, satisfaction and socio-economic conditions: some international evidence. Journal of Socio-Economics 35: 348-365.
Schatz E, Gómez-Olivé X, Ralston M, Menken J, Stephen T (2012) The impact of pensions on health and wellbeing in rural South Africa: Does gender matter? Social Science & Medicine 75: 1864-1873.
Seligman MEP (2003) Positive psychology: Fundamental assumptions. Psychologist 16: 126–127.
Seo HR (2014) An exploratory study on internet usage of the elderly in an urban-rural region. Journal of the Institute of Social Science 21:, 235-256.
Shahab L, West R (2009) Do ex-smokers report feeling happier following cessation? Evidence form a cross-sectional survey. Nicotine & Tobacco Research 11: 553-557. Sixsmith A, Carrillo M, Phillips D, Lansley P, Woolrych R (2013) International initiatives in
technology and aging. In: Sixsmith A, Gutman G (Ed.) Technologies for Active Aging. New York: Springer, pp. 201-221.
Stack S, Eshleman R (1998) Marital status and happiness: a 17-nation study. Journal of Marriage and Family 60: 527-536.
Stavrova O, Fetchenhauer D, Schlösser T (2013) Why are religious people happy? The effect of the social norm of religiosity across countries. Social Science Research 42: 90-105. Summers JK, Smith LM, Case JL, Linthurst RA (2012) A review of the elements of human
well-being with an emphasis on the contribution of ecosystem services. Ambio 41: 327-340.
Waldinger RJ, Schulz MS (2010) What’s love go to do with it?: Social functioning, perceived health, and daily happiness in married octogenarians. Psychology & Aging 2: 422-431. Yamaoka K (2008) Social capital and health and well-being in East Asia: a population-based
study. Social Science & Medicine 66: 885-899.
YooYS, Son HJ (2012) Research on relationships between internet use and the elderly's life quality. The Korea Contents Society 12: 235-244.
Zander A, Passmore E, Mason C, Rissel C (2013) Joy, exercise, enjoyment, getting out: a qualitative study of older people’s experience of cycling in Sydney, Australia. Journal of Environmental and Public Health ID 547453, 6 page, doi: 10.1155/2013/547453.
Table 1. Description of the samples Young (n=824) Middle-aged (n=978) Old (n=397) Variables Mean (SD) or % Mean (SD) or % Mean (SD) or % Significanc e Happiness 4.03 (0.83) 3.93 (0.93) 3.95 (0.99) Age 28.62 (6.22) 51.89 (7.08) 73.75 (6.59) *** Gender: Female 48.3% 52.1% 51.6% Male 51.7% 47.9% 48.4% Education year 14.50 (2.58) 11.24 (3.76) 8.51 (3.94) ***
Marital status: No spouse 68.4% 19.2% 34.0% ***
Having a spouse 31.6% 80.8% 66.0%
Living place: Urban area 60.0% 53.9% 50.5% ***
Town 28.6% 27.0% 23.6%
Rural area 11.4% 19.1% 25.9%
Living arrangement: With others 93.6% 93.8% 93.5% Alone 6.4% 6.2% 6.5% BMI 22.80 (4.21) 24.27 (3.39) 23.92 (3.27) *** Religion belief: No 34.6% 15.9% 12.6% *** Yes 65.4% 84.1% 87.4% Chronic diseases: No 89.4% 62.6% 35.7% *** Yes 10.6% 37.4% 64.3%
Self-rated health: Good 81.0% 79.8% 72.3% **
Poor 19.0% 20.2% 27.7% Smoking: Never 35.8% 33.9% 30.2% ** Quit 2.5% 4.9% 7.6% Smoking 61.7% 61.1% 62.2% Drinking: Never 59.0% 66.4% 78.6% *** Social 29.6% 18.6% 12.8% Light 8.5% 7.5% 3.5% Heavy 2.9% 7.6% 5.0% Regular exercise: No 52.6% 47.8% 44.1% * Yes 47.4% 52.2% 55.9% Internet using: No 5.6% 53.9% 92.4% *** Yes 94.4% 46.1% 7.6% Mood 11.81 (4.11) 10.93 (4.44) 11.50 (4.98) ***
Family social support 7.27 (3.10) 7.63 (3.93) 7.66 (3.95) Friends/colleagues/neighbor
s social support
5.97 (1.83) 4.82 (1.73) 4.23 (0.09) ***
Formal social support 2.96 (0.77) 2.92 (0.85) 2.90 (0.89)
Work: No 23.3% 31.0% 83.8%
Yes 76.7% 69.0% 16.2%
Social group participation 2.18 (1.08) 2.03 (1.07) 1.84 (1.16) ***
Social trust 2.33 (0.79) 2.06 (0.87) 1.99 (0.80) ***
Subjective economic status 3.04 (.17) 2.87 (1.14) 2.68 (1.13) *** Social class 5.03 (1.45) 4.91 (1.64) 4.86 (1.77)
Life control 6.74 (1.94) 6.88 (2.12) 6.89 (2.43) Quality of life 2.83 (0.58) 2.83 (0.62) 2.85 (0.59) Note 1: The test were conducted by one-way ANOVA or Chi-square test. Note 2: N=2199. *p<0.05.**p<0.01.***p<0.001.
Table 2. Happiness and social determinants by age groups
Variables Total (n=1918) Young (n=789) Middle-aged (n=888) Old (n=241)
Constant 3.878 (0.102)*** 4.074 (0.172)*** 4.035 (0.168)*** 3.713 (0.341)***
Age -0.064 (0.028)* -0.020 (0.033) -0.024 (0.029) 0.023 (0.055)
Gender (Female) 0.063 (0.034) 0.120 (0.052)* 0.003 (0.055) -0.035 (0.111)
Education year -0.065 (0.023)** -0.048 (0.027) -0.058 (0.033) -0.147 (0.059)*
Marital status (Having a spouse) 0.037 (0.038) 0.010 (0.066) 0.151 (0.070)* -0.091 (0.120)
Living place (town) 0.024 (0.035) 0.053 (0.053) 0.007 (0.064) -0.024 (0.113)
(rural area) -0.044 (0.044) 0.004 (0.074) -0.071 (0.064) -0.074 (0.124)
Living arrangement (Alone) -0.115 (0.068) -0.061 (0.100) -0.066 (0.110) -0.239 (0.206)
BMI 0.015 (0.016) 0.032 (0.025) 0.018 (0.024) 0.017 (0.047)
Chronic diseases (Yes) -0.039 (0.040) -0.030 (0.079) -0.035 (0.052) -0.044 (0.101)
Self-rated health (Poor) -0.068 (0.042) -0.105 (0.063) -0.082 (0.064) 0.228 (0.121)
Smoking (Quit) -0.020 (0.082) 0.080 (0.151) -0.157 (0.117) 0.093 (0.192)
(Smoking) -0.186 (0.035)*** -0.184 (0.052)*** -0.184 (0.054)** -0.191 (0.107)
Drinking (Social) 0.106 (0.039)** 0.043 (0.055) 0.179 (0.063) -0.010 (0.140)
(Light) 0.134 (0.059)* 0.171 (0.085)* 0.053 (0.092) 0.126 (0.250)
(Heavy) -0.021 (0.069) 0.002 (0.136) -0.056 (0.090) 0.307 (0.211)
Regular exercise (Yes) -0.018 (0.032) -0.037 (0.049) -0.015 (0.048) 0.068 (0.098)
Internet 0.005 (0.048) -0.118 (0.106) -0.013 (0.060) 0.144 (0.164)
Negative affect -0.276 (0.017)*** -0.225 (0.026)*** -0.273 (0.026)*** -0.415 (0.059)***
Religion belief (Yes) 0.053 (0.037) 0.082 (0.050) 0.020 (0.063) 0.088 (0.142)
Friends/colleagues/neighbors’ social support 0.022 (0.017) 0.020 (0.024) 0.011 (0.024) 0.034 (0.048)
Formal social support -0.300 (0.157) -0.052 (0.023)* -0.024 (0.024) 13.091 (52.086)
Working status (no) 0.005 (0.036) 0.054 (0.058) -0.016 (0.056) 0.011 (0.136)
Social group participation 0.049 (0.016)** 0.051 (0.025)* 0.072 (0.025)** -0.003 (0.048)
Social trust 0.047 (0.016)** 0.089 (0.024)*** 0.009 (0.024) -0.007 (0.048)
Subjective economic status 0.048 (0.018)** 0.029 (0.026) 0.046 (0.028) 0.160 (0.056)**
Social class 0.047 (0.018)** 0.038 (0.027) 0.052 (0.027) 0.074 (0.055)
Life control 0.018 (0.005)*** 0.112 (0.026)*** 0.048 (0.026) -0.050 (0.050)
Quality of life 0.317 (0.018)*** 0.272 (0.026)*** 0.343 (0.027)*** 0.358 (0.059)***
R square 0.441 0.436 0.468 0.544
Note: Linear regression model was applied for the analysis. Data samples were weighted, and the continuous independent variables were centered. The reference groups were: Gender (male), marital status (no spouse), living place (urban area), living arrangement (living with others), religion belief (no),chronic diseases (no), self-rated health (good), smoking (never), drinking (never), regular exercise (no), use of internet (no), and working status (no). *p<0.05, **p<0.01, ***p<0.001.