國立交通大學
應用化學系
博士論文
奈米鉑修飾電化學偵測器及微流道電泳晶片結合電
化學偵測器之研究
The study of platinum nanoparticles modified electrochemical
detection and microchip electrophoresis integrated with indium tin
oxide electrochemical detection
研 究 生:林冠文
奈米鉑修飾電化學偵測器及微流道電泳晶片結合電化學偵測器之研究 學生:林冠文 指導教授:謝有容 博士 國立交通大學應用化學系博士班 摘要 本論文之研究主要以電化學為基礎,分別在電化學工作電極表面進行奈米材料修 飾,以及將電化學偵測器整合至微流道晶片中進行分析應用。在電化學工作電極的修飾 部分,選用了奈米材料作為修飾劑,藉由改變電極表面性質,可有效提升工作電極對於 分析物的穩定度、靈敏度以及應用層面。本論文應用電沈積法在工作電極表面修飾奈米 鉑,經由最佳的修飾條件,本修飾電極對乙醇展現了優良的偵測效果,不但擁有極佳的 穩定性與再現性,還具備了高選擇性,可以在稀釋的含酒精飲料以及人類血清中,直接 偵測乙醇的存在並進行定量,此修飾電極對於乙醇在飲料中的含量以及在生化臨床上的 檢測,提供了一種快速而又簡單的應用。 微流道晶片目前在分離科學上的應用非常廣泛,在一個微型晶片中整合了進樣、處 理、分離以及偵測等步驟,可以有效率地提升大量篩檢的效率。然而在微流道晶片的製 程改進上,目前仍然有著相當大的改進空間。本論文針對微流道晶片新製程的研發以及 電化學偵測器的整合加以研究,採用了乾式光阻作為微流道晶片的流道,再以自行設計 的夾具固定整個晶片主體,成為可拆卸式的微流道晶片裝置,微流道可以拆卸清洗並重 複使用,有效避免微流道污染,並增進微流道晶片製作的精準度與再現性,整個晶片系 統對於兒茶酚胺(catecholamine)系列神經傳導物質的分離與偵測有著相當良好的分析效
果。而電化學偵測器的整合部分,則利用銦錫氧化物塗佈(indium tin oxide coating)玻璃, 結合微影蝕刻製程,製作出精準的薄膜式電化學電極組,包含了高壓電阻斷器、工作電 極等,可將之整合至微晶片流道中,有效解決了自製電化學微流道晶片最常見的滲漏問 題,並且以兒茶酚胺類化合物成功驗證其分析效能。以上兩種製程均對於電化學微流道 晶片的製作方面,提供了新的製程發展。
The study of platinum nanoparticles modified electrochemical detection and microchip electrophoresis integrated with indium tin oxide electrochemical detection
Student: Kuan-Wen Lin Advisor: Dr. You-Zung Hsieh
Department of Applied Chemistry National Chiao Tung University
Abstract
The study of this dissertation is based on electrochemistry, including the modification of nano-materials on electrode for electrochemical detection, and the fabrication of microchip capillary electrophoresis (CE) in conjunction with electrochemical detection. In the part of modification of nano-materials on electrode, the platinum nanoparticles were used for the surface modification on working electrode by electrodeposition. In the optimal conditions of electrodeposition, the platinum nanoparticles modified electrode performed good detecting results for ethanol sensing. The performances of this modified electrode included good sensitivity, response time, selectivity, and reproducibility. The response time and sensitivity for different type of alcohol samples, including alcoholic beverages and human serum, was measured to evaluate the selectivity. The storage stability of the sensor was also evaluated. These characteristics allowed its application for direct detection of ethanol in biosensing and controlling.
The applications of microchip CE are getting extensively. Microchip CE is characterized by a number of analytical advantages, including its rapidity, a small sample requirement and the potential for integration. However, the fabrication of microchip CE, including the chip
microchip using a combination of photolithographic and hot-roll lamination techniques was employed in this study to improve the fabrication of microchip. The microchannel pattern was prefabricated in a dry-film photoresist tape using photolithographic methods. The integrated microchip device was then fixed in a laboratory-built Plexiglas holder prior to its application to microchip electrophoresis. The performance of this device as an electrochemical sensor was evaluated for the separation of neurotransmitters. The fabrication procedure described in this study is time- and cost-effective; it has great potential for use in the design and
prototyping of disposable microscale analytical systems for a range of chemical and biochemical separations. A microchip integrated with electrochemical sensor which uses indium tin oxide (ITO) film electrodes as a working electrode and a decoupler was developed. The ITO film on a glass substrate was patterned by photolithography and wet etching as the decoupler and working electrode. This fabrication provided a way to solve the problem that the off-channel electrochemical detector integrated with microchip. The performance of this electrochemical sensor was evaluated by the separation of catecholamine. Excellent efficiency and resolution were obtained. This approach has a great potential for use in the fabrication of off-channel electrochemical microscale analytical systems for chemical and biochemical separations.
誌
謝
本論文能順利付梓,首先必須感謝我的指導教授 謝有容教授,多年來辛苦的指導 與教誨,無論是在研究或是做人處事上,均給予學生莫大的教導與鼓勵,對您的感謝筆 墨難以言喻,在此獻上由衷的感謝。感謝口試委員許千樹教授、裘性天教授、楊末雄教 授與黃賢達教授在百忙之中撥冗指導學生論文,並給予許多建議以及鼓勵,並讓學生的 論文能夠更臻完善,也在此獻上最大的感謝。 感謝慶昇學長在研究以及生活上的許多協助與幫忙;感謝元謙學長提供了許多資源 讓研究進行更順利;感謝修平學長在我初入博士班時,給予許多觀念上、研究上、以及 生活上的指導和協助:感謝煥毅學長提供許多業界的相關資訊增長我的見聞。彥愷、滄 浩、亦文、志倫、佩潔、豔如,謝謝你們在研究與實驗上願意與我共同努力;還有秀麗、 瑜婷、敏慈、蘭英、雪怡、婉君,與你們在實驗室的這段日子相處非常地愉快;以及承 宇、昱成、沂玶,雖然和你們在實驗室的相處時間不長,但你們開朗的歡笑聲,也讓我 和你們建立起深厚的友誼。因為你們的支持與相伴,讓我在實驗室的研究與生活都充滿 了美好的回憶。感謝許多好友與大學同學們,有你們的陪伴與安慰,讓我有更大的勇氣 在博士班的道路繼續走下去。 感謝我親愛的父母,無怨無尤地支持我長達二十多年的讀書生涯,感謝你們給予我 的一切,能成為你們的兒子是我這一生最大的幸福,僅以此學位,感謝你們的辛勞與付 出。最後,感謝交通大學應用化學系,提供良好的研究與學習環境順利完成我的學位, 更要感謝國科會(NSC 94-2113-M-009-003、NSC 95-2113-M-009-033-MY3),以及教育部 發展一流大學暨頂尖研究中心計畫(MOE ATU)的經費資助,讓我的研究能夠順利進展。
Contents
Page
Abstract (Chinese) ... I Abstract (English) ... III Acknowledgement (Chinese) ... V Contents ... VI Figure List ... VIII Table List ... IX
Part I. The study of nano-materials modified electrochemical detection ... 1
I.1 Introduction ... 1
I.1.1 Basic principles of analytical electrochemistry ... 1
I.1.1.1 Cyclic voltammetry ... 1
I.1.1.2 Chronoamperometry ... 3
I.1.2 The applications of modifiers for electrochemical detection ... 5
I.1.2.1 Platinum nanoparticle modified carbon paste electrode for ethanol sensing . 5 I.1.2.2 Carbon nanotubes modified ITO electrode for catecholamines sensing ... 7
I.1.2.3 Gold-Prussian blue nanocomposite modified ITO for cysteine sensing ... 11
I.2 The measurement of ethanol based on disposable platinum nanoparticles modified electrochemical biosensor ... 16
I.2.1 Experimental ... 16
I.2.1.1 Reagents and apparatus ... 16
I.2.1.2 Preparation of modified ethanol biosensor ... 16
I.2.1.3 Electrochemical measurements ... 17
I.2.1.4 Preparation of real samples ... 17
I.2.2 Results and discussions ... 17
I.2.2.1 Optimal Pt nanoparticles modified biosensor composition and characterization ... 17
I.2.2.2 Chronoamperometry ... 20
I.2.2.3 Reproducibility and long-term stability ... 21
I.2.2.4 Analysis of alcohols ... 24
I.2.2.5 Analysis of alcoholic beverages and serum ... 24
I.2.3 Conclusion ... 26
Part II. The fabrication of microchip capillary electrophoresis integrated with electrochemical detection ... 27
II.1.1.1 Materials ... 27
II.1.1.2 Fabrications ... 29
II.1.2 The integrations of electrochemical detection with microchip ... 33
II.1.2.1 Integrating a dry-film photoresist-based microchip with electrochemical detection ... 33
II.1.2.2 Reversible sealed microchip electrophoresis integrated with electrochemical detection for phenolic acid analysis... 34
II.1.2.3 In-channel simplified decoupler with renewable electrochemical detection for microchip CE ... 36
II.2 Integrating a dry-film photoresist-based microchip with an electrochemical sensor for the analysis of neurotransmitters ... 41
II.2.1 Experimental ... 41
II.2.1.1 Reagents and apparatus ... 41
II.2.1.2 Microchip fabrication ... 42
II.2.1.3 Electrophoresis ... 43
II.2.2 Results and discussions ... 43
II.2.2.1 Fabrication of a dry-film photoresist-based microchip ... 43
II.2.2.2 Hydrodynamic voltammetry of analytes ... 44
II.2.2.3 Analysis of neurotransmitters ... 45
II.2.2.4 Analysis of neurotransmitters in a spiked urine sample ... 48
II.2.3 Conclusion ... 49
II.3 Development of microchip integrated with electrochemical sensor in conjunction with indium tin oxide electrode ... 51
II.3.1 Experimental ... 51
II.3.1.1 Chemicals and apparatus ... 51
II.3.1.2 Microchip fabrication ... 52
II.3.1.3 Electrophoresis ... 55
II.3.2 Results and discussion ... 55
II.3.2.1 Hydrodynamic voltammetry ... 55
II.3.2.2 The properties of microchip ... 56
II.3.2.3 Analysis of catecholamines ... 57
II.3.3 Conclusion ... 60
Part III. References ... 61
Figure List
Part I
Figure I-1. Potential-time excitation signal in CV ... 2
Figure I-2. Typical cyclic voltammogram for a reversible. ... 3
Figure I-3. Chronoamperometric experiment ... 5
Figure I-4. (A) A column with hexagon structure of CNT. (B) The closed-shell of Fullerene with the pentagon topological defect ... 8
Figure I-5. SEM images of (a) Nafion and (b) CNT/Nafion films on ITO ... 9
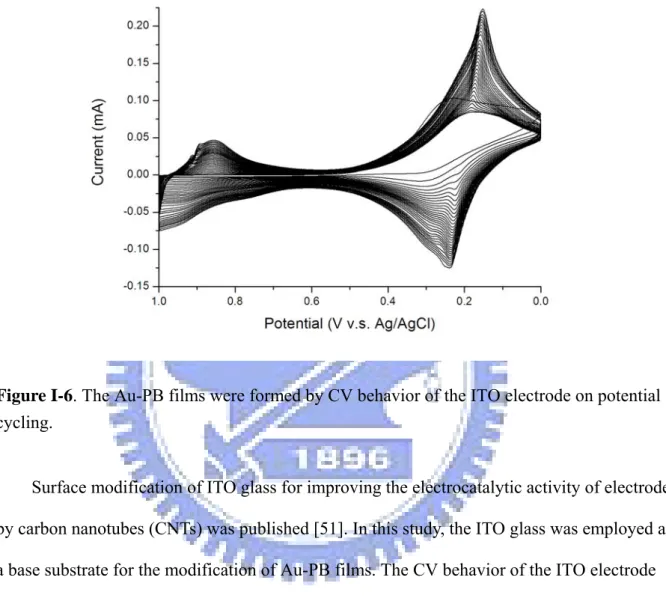
Figure I-6. The Au-PB films were formed on ITO electrode. ... 13
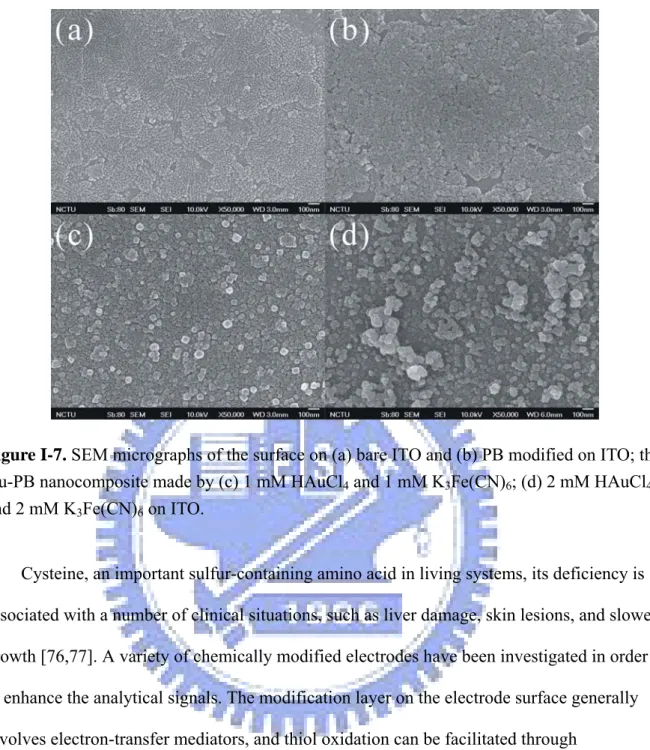
Figure I-7. SEM micrographs of the surface on ITO ... 14
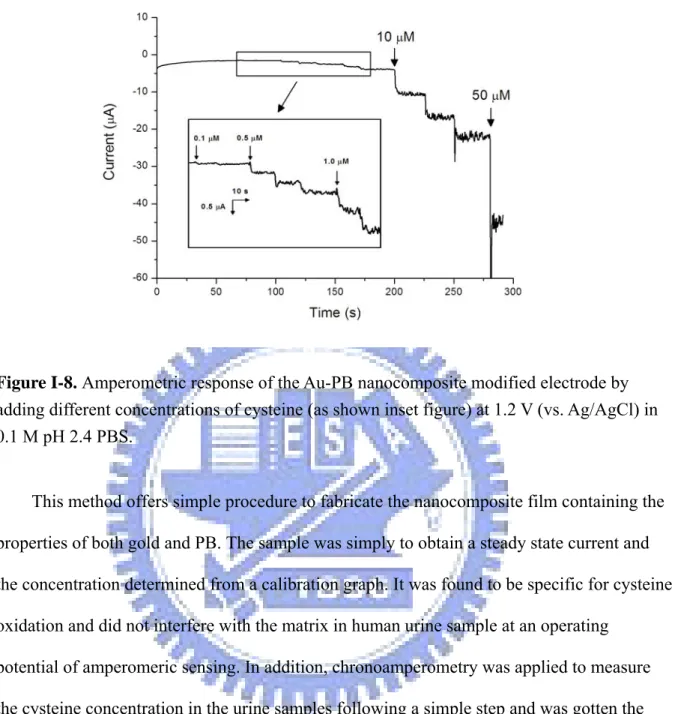
Figure I-8. Amperometric response of the Au-PB modified electrode ... 15
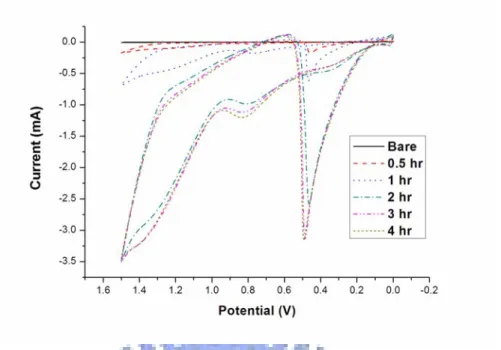
Figure I-9. Cyclic voltammograms of ethanol by the biosensor ... 18
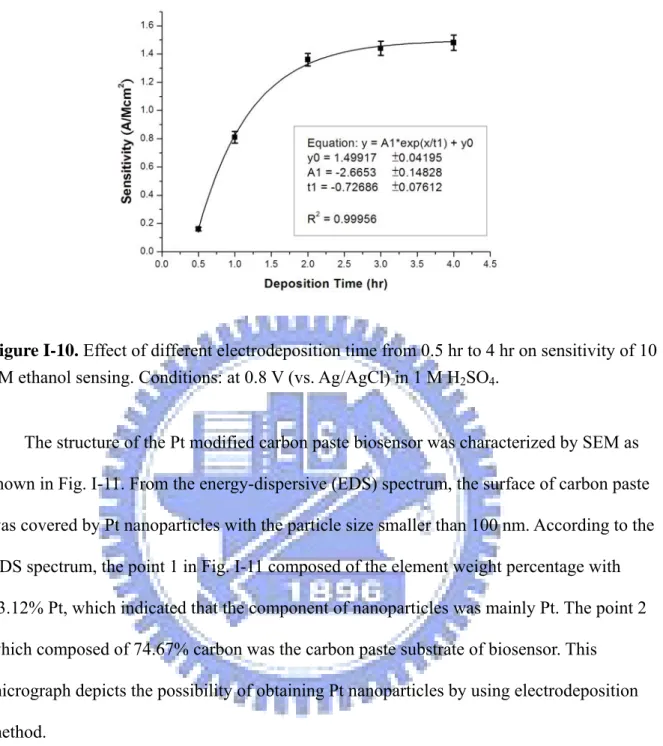
Figure I-10. Effect of different electrodeposition time for ethanol sensing. ... 19
Figure I-11. SEM micrographs of Pt nanoparticles modified biosensor ... 20
Figure I-12. Amperometric response of the Pt nanoparticles modified sensor ... 21
Figure I-13. The reproducibility of measurements with a single sensor ... 22
Figure I-14. The long-term stability of a single sensor ... 23
Figure I-15. Amperometric response of alcohols sensing ... 24
Part II
Figure II-1. Fabrication procedures of off-channel detection microchip ... 31Figure II-2. The assembling processes of reversible sealed clamping apparatus ... 32
Figure II-3. Electropherogram of coffee sample ... 36
Figure II-4. Procedure for the fabrication of the in-channel decoupler/renewable electrode microchip CE-EC system ... 39
Figure II-5. Electropherograms displaying the performance of the renewable electrode microchip CE-EC system ... 40
Figure II-6. Schematic illustration of the dry-film photoresist-based chip ... 44
Figure II-7. Hydrodynamic voltammograms of neurotransmitters and uric acid ... 45
Figure II-8. Electropherograms of neurotransmitters and uric acid ... 46
Figure II-9. Electropherograms of a urine sample spiked with neurotransmitters ... 49
Figure II-10. Fabrication procedure for ITO-microchip ... 53
Figure II-11. (a) Pattern design of ITO-electrode. (b) Pattern design of microchannel ... 54
Figure II-12. Hydrodynamic voltammograms of neurotransmitters solutions obtained using ITO-microchip ... 56
Figure II-13. The effect of different concentrations of SDS ... 58
Table List
Part I
Table I-1. Figures of merit for the determination of catecholamines ... 10
Table I-2. Response characteristics of the ethanol biosensors ... 23
Table I-3. Results for the determination of ethanol in alcoholic beverages ... 25
Table I-4. Results for the determination of ethanol in serum ... 25
Part II
Table II-1. Results of analytes’ theoretical plate numbers (plates/cm) versus the applied separation voltage. ... 47Table II-2. Figures of merit for the determination of neurotransmitters by dry-film based microchip CE ... 48
Table II-3. The results of regression analysis. ... 59
Part I. The study of nano-materials modified electrochemical detection
I.1 Introduction
The applications of electrochemical detection are getting more and more, especially in the field of modified electrode. By modifying the surface of working electrode, such as dynamic coating, electrodeposition, and films deposition, the modified electrode improves the performance for the analysis. Therefore, the main point of this study is the modification of nano-materials for the electrochemical detection. Platinum nanoparticles, carbon nanotubes, and gold-Prussian blue nanocomposite are introduced in the below sections.
I.1.1 Basic principles of analytical electrochemistry
I.1.1.1 Cyclic voltammetry
Cyclic voltammetry (CV) is the most widely used technique for obtaining qualitative information during electrochemical reactions. The use of cyclic voltammetry results from its ability to rapidly provide considerable information on the thermodynamics of redox processes, on the kinetics of heterogeneous electron-transfer reactions, and on coupled chemical
reactions or adsorption processes. CV is often the first experiment performed in an electrochemical study. In particular, it offers a rapid location of redox potentials of the electroactive species, and convenient evaluation of the effect of media upon the redox process.
CV consists of scanning linearly the potential of a stationary working electrode, in an unstirred solution, using a triangular potential waveform as shown in Fig. I-1. Depending on the information explored, single or multiple cycles can be performed. The meter measures the current resulting from the applied potential during the potential sweep. The resulting plot of
current versus potential is termed a “cyclic voltammogram”. The cyclic voltammogram is a complicated, time-dependent function of a large number of physical and chemical parameters.
Figure I-1. Potential-time excitation signal in cyclic voltammetric ecperiment [1].
A reversible redox couple during a single potential cycle is illustrated the expected response in Fig. I-2. It is assumed that only the oxidized form O is present initially. Therefore, a negative-scanning potential is chosen for the first half-cycle, staring from a value where no reduction occurs. As the applied potential approaches the characteristic E0 for the redox
process, a cathodic current begins to increase, until a peak is reached. After traversing the potential region in which the reduction process takes place, the direction of the potential sweep is reversed. During the reverse scan, R molecules are reoxidized back to O and an anodic peak results.
The characteristic peaks in the cyclic voltammogram are caused by the formation of the diffusion layer near the electrode surface. These can best be understood by carefully
examining the concentration-distance profiles during the potential sweep. Therefore, the increase to the peak current corresponds to the achievement of diffusion control, while the current drop exhibits a t-1/2 dependence. For the above reasons, the reversal current has the same shape as the forward one [1].
Figure I-2. Typical cyclic voltammogram for a reversible O + ne- R redox process [1].
I.1.1.2 Chronoamperometry
The basis of all controlled-potential techniques is the measurement of the current response to an applied potential. There exist a multitude of potential excitations, including a ramp, potential steps, pulse trains, a sine wave, and various combinations thereof. The present session reviews chronoamperometry that is widely used.
Chronoamperometry involves stepping the potential of the working electrode from a value at which no faradic reaction occurs to a potential at which the surface concentration of the electroactive species is effectively zero (as shown in Fig. I-3a). A stationary working electrode and unstirred solution are used. The resulting current-time dependence is monitored. As mass transport under these conditions is solely by diffusion, the current-time curve reflects the changes in the concentration gradient in the vicinity of the surface. This involves a gradual
expansion of the diffusion layer associated with the depletion of the reactant, and hence decreased slope of the concentration profile as time progresses (Fig. I-3b). Accordingly, the current decays with time (Fig. I-3c), as given by the Cottrell equation:
Such an it1/2 constancy is often termed “Cottrell behavior”. Deviations from such behavior occur at long times as a reaults of natural convection effects, or when using microelectrodes with high perimeter-to-area ratios. A time-independent current is obtained for t > 0.1 s due to a large redial diffusion contribution. Similar considerations apply to spherical electrodes whose current response following a potential step contains a time-dependent and
time-independent terms. Recall also that for small values of t (t < 50 ms) the
chronoamperometric signal contains a background contribution of the charge current. Additional transient background contributions are common to solid-electrode
chronoamperometric experiments.
Chronoamperometry is often used for measuring the diffusion coefficient of electroactive species or the surface area of the working electrode. Analytical applications of
chronoamperometry rely on pulsing of the potential of the working electrode repetitively at fixed time intervals. Chronoamperometry can also be applied to the study of mechanisms of electrode processes. Particularly attractive for this task are reversal double-step
Figure I-3. Chronoamperometric experiment: (a) potential-time waveform; (b) change of
concentration profiles with time; (c) the resulting current-time response [1].
The potential-step experiment can also be used to record the charge versus time
dependence. This is accomplished by integrating the current resulting from the potential step. Such a charge measurement procedure, as known chronoamperometry, is particularly useful for measuring quantity of adsorbed reactants. A plot of the charge (Q) versus t1/2 yields an
intercept at t = 0 corresponds to the sum of the charge due to the reaction of the adsorbed species and the double-layer charging. The former can be estimated by subtracting the intercept obtained in an identical experiment carried out in the blank solution [1].
I.1.2 The applications of modifiers for electrochemical detection
especially in the control of drunk driving. Recently, a variety of methods and strategies had been reported for the determination of ethanol including gas chromatography [2,3], liquid chromatography [4,5], refractometry [6], and spectrophotometry [7]. These methods which are relatively expensive and complex to perform; therefore, an amperometric biosensor may be the most promising method due to their convenience, simplicity and accuracy.
The fabrication of an electrochemical alcohol biosensor has been achieved using either alcohol dehydrogenase (ADH) [8-12] or alcohol oxidase (AOD) [8,13,14], by immobilising these enzymes onto suitable transducers based on the detection of β-nicotinamide adenine dinucleotide (NADH) or hydrogen peroxide (H2O2). The biosensors which are based on
alcohol dehydrogenase require the presence of NAD+ as cofactor which increases the overall
cost of manufacture [15]. In addition, the cofactor needs to be close to the electrode surface where the enzyme is deposited, without becoming irreversibly entrapped, or linked, onto the electrode surface [16]. However, such problems lead to a decrease in sensitivity and life-time of sensors. In addition to enzymes, other materials for use in electrochemical ethanol sensors have been developed. The carbon nanotubes (CNTs) [17-19], sputtered complex nano-metals [20], and rhodium oxide (RuO2) [21] modified sensor for determination of ethanol were
developed. The results of measurement for ethanol were showed a good performance with sensitivity and novel fabrication process.
An amperometric ethanol biosensor modified with Pt nanoparticles and based on carbon paste substrates was reported. Ethanol undergoes catalytic splitting on platinum (Pt)
electrodes and presents a high potentiality for future applications on technological systems, such as fuel cells [22-24]. Due to the high electrooxidation ability of ethanol, the Pt was applied as the modifier based on the biosensor. Pt nanoparticles with precisely controlled shape exhibit unique catalytic properties of ethanol. The faceted platinum nanoparticles exhibit a higher catalytic activity as compared to spherical particles. To prevent the pollution
during the sensing procedure, the property of disposable is very important in biosensor. Because the Pt modifier was in the nano-scale and the sensor substrates was a mass-printed film, the cost of this Pt nanoparticles modified biosensor was as low as disposable.
The performance of this present modified biosensor for determination of real samples was used to measure the ethanol in alcoholic beverages and serum. CV and chronoamperometry were employed to analyze its electrochemical behavior, while different electrode modified conditions were investigated to optimize the sensing characteristics. The characteristics and performance of this ethanol sensor such as its response time, linear range, sensitivity, reproducibility, and long-term stability were also performed.
I.1.2.2 Carbon nanotubes modified ITO electrode for catecholamines sensing
Since their initial discovery by Iijima in 1991 and subsequent report of their synthesis by Ebbesen and Ajayan in 1992, carbon nanotubes (CNTs) have been the subject of many
experimental and theoretical investigations [25-27], the structure of CNTs is shown as in Fig. I-4. Two kinds of CNTs are known: single-wall carbon nanotubes (SWNTs) and multiwall carbon nanotubes (MWNTs). They have attracted much attention as a result of their unique structures and chemical and physical properties, which make them suitable for use in a range of potential applications [25,28-31], such as high sensitivity microbalances [32], gas detectors [33,34], catalyst supports [35,36], electron sources in field emission-mode displays [37], tiny tweezers for nanoscale manipulation [38], and probe tips for scanning probe microscopy [39]. Theoretical calculations have indicated that, depending on their symmetry and diameter, CNTs can exhibit metallic or semiconductive behavior [40-42].
Figure I-4. (A) A column with hexagon structure of CNT, the hybrid orbital between carbon
atoms is sp2 type. (B) The closed-shell of Fullerene with the pentagon topological defect [43].
Furthermore, CNTs are more highly conductive than graphite [44]. The large surface areas and abundances of functional groups presented on nanomaterials make them suitable for specific electroanalytical reactions of certain substances when incorporated into electrodes. For example, CNTs have the ability to mediate electron transfer reactions of electroactive species in solution, exhibiting catalytic effects on the electrochemical behavior of dopamine [45], proteins [46], and oxygen [47].
A conventional approach toward fixing CNTs onto the surfaces of working electrodes is through spin-coating of a film of, for example, Nafion mixed with CNTs [48]. Nafion, a cation exchange polymer, forms films that are highly permeable to cations but almost impermeable to anions. CNTs lacking any additional functional groups can be dissolved completely in Nafion solutions. Using glassy carbon electrodes (GCEs) modified with CNTs increases the sensitivity of CV toward the detection of analytes [48].
Modified GCEs are, however, still susceptible to poor reproducibility because of the need to clean the GCE surface. One approach to solving this problem is the use of a
disposable material as an electrode base; this material must have low cost and be readily available and easily modified. Carbon paste is a widely used material for fabricating disposable electrodes [49]; screen-printing techniques can be employed for their mass production. Indium tin oxide (ITO) is another possible material that has recently become widely used industrially for thin display panels; thus, it is easy to purchase at standard
specifications [50]. ITO is an excellent photoelectric material because of its high conductivity and photo-penetrability. Although it can decrease electrical resistance when used as an
electrode substrate, the electroanalytical activity of ITO is relatively low when compared with most other types of detectors. Surface modification of ITO glass is one means to increasing its electroanalytical activity. We suspected that modifying ITO with CNTs would provide a substrate exhibiting the pure properties of CNTs without any interference from graphite. The images of CNTs modified ITO are shown in Fig. I-5.
Figure I-5. SEM images of (a) Nafion and (b) CNT/Nafion films on ITO electrodes;
magnified by a factor of 10,000 [51].
nervous systems [52], intensive efforts have been made to determine their levels in vivo and in vitro using selective electrochemical techniques [53–55]. Ideally, we would like to establish simple, rapid, and selective methods for the routine analysis of catecholamines.
The electroanalytical performance of CNT/Nafion-modified ITO electrodes for the detection of catecholamines, including dopamine, epinephrine, and
3,4-dihydroxyphenylalanine (DOPA) was described. Nafion is an effective solubilizing agent for CNTs, and the resulting CNT/Nafion films exhibited very good adhesion on the ITO surface. Because various activation procedures influence the electrochemical reactivity of electrodes, the effects of chemical pretreatment of the CNTs and the pH of the buffer on the electroanalytical behavior of CNT/Nafion-modified ITO electrodes were studied. The electrooxidation toward catecholamines at CNT/Nafion-modified ITO electrodes was investigated.
Table I-1. Figures of merit for the determination of catecholamines [51]
Catechol Dopamine Epinephrine DOPA Coefficient of Determination (r2) 0.997 0.995 0.998 0.997 Linear Range (μM) 1 – 103 1 – 103 10-1 – 103 1 – 103 Linear Regression of Conc. y = 0.122x + 0.380 y = 0.208x – 0.789 y = 0.409x – 1.676 y = 0.309x – 0.966 LOD (μM) 3.87 × 10⁻¹ 2.24 × 10⁻¹ 3.91 × 10⁻² 2.02 × 10⁻¹ Amplification Factora 96.2 75.7 97.1 124.6 N = 10
a. Amplification factor was calculated for the detection current, relative to that from a bare ITO electrode, at 0.5
mM of the analyte.
CNT/Nafion-modified ITO electrodes exhibit excellent electrocatalytic activity towards the redox reactions of catecholamines, the results of detection are summarized in table I-1. The modified electrode enhanced the peak currents and lowered the overpotentials. Nafion
was a useful solubilizing agent for preparing the CNT-modified ITO electrodes. Such CNT/Nafion-modified ITO electrodes are easy to prepare and exhibit good reproducibility, remarkable electrocatalytic properties, and low detection limits for catecholamines.
Consequently, these modified ITO electrode could be employed as electrochemical sensors exhibiting high selectivity and sensitivity toward catecholamines, without interference from the presence of ascorbic acid. Furthermore, photolithography can be used to fabricate ITO glass into specific electrode patterns that are readily integrated into biosensors.
I.1.2.3 Gold-Prussian blue nanocomposite modified ITO for cysteine sensing
The transition metal hexacyanometallates form an important class of the insoluble mixed valence compounds. Prussian blue (PB) is a classical prototype of metal hexacyanoferrates with well-known electrochemical [56,57] and potential analytical applications [58,59]. The structural aspects and electrochemistry of PB have been previously reviewed in several articles [60]. As the transition between PB and its reduced form, Prussian white (PW) is associated with relatively faster electron-transfer kinetics and serves as the redox mediator in catalysis and electroanalysis [61]. The CV of the modified electrode revealed the classic and today well-known form of the reversible reduction and oxidation of PB.
The traditional synthesis methodology of PB and its analogues with the general composition K3Fe(CN)6 is based on a direct precipitation reaction of the potassium cations
and the Fe(CN)63- anions in a neutral aqueous solution. A versatile method for the preparation
of Prussian Blue modified electrodes based on a simple electrochemical reduction of a ferric–ferricyanide solution was addressed [62-64]. It is well known that PB has a small solubility product constant, indicating that upon direct mixing Fe2+ coordinates immediately with Fe(CN)63- to form PB. PB has been prepared by both chemical [65] and electrochemical
A thin surface derivative layer of PB often imparts fast electron-transfer characteristics to the substrate. This electrocatalytic phenomenon is useful from both analytical (i.e., sensor) and electrosynthetic viewpoints. PB and its analogues have been considered as another class of interesting materials for electrocatalysis of reduction of hydrogen peroxide (H2O2).
Through its redox states, the PW state has been recognized as reducing H2O2 and acting as an
electron-transfer mediator between the electrode and H2O2 for its reduction to occur at low
potentials. To improve the traditional synthesis methodology and using a slow reaction process, the synthesis of PB film with Au nanoparticles by CV was used. Even though PB formation can take place on Au from a single ferric cyanide solution under low pH conditions [68-70], the growth was found to cease after a few number of cycles. When ferric cyanide solution is used in an acidic medium for potential cycling, the only solid phase that is formed on the electrode surface is PB, because the acid medium promotes release of ferric/ferrous ions that can combine with the solution ferric cyanide. In this approach, the mixture solution of HAuCl4 and ferric cyanide was used for the formation of gold- Prussian blue (Au-PB)
nanocomposite films. The advantage of the interactions of HAuCl4 and ferric cyanide such as
(a) Au-catalyzed decomposition of ferric cyanide under low pH conditions for the supply of ferrous ions; (b) low interfacial pH arising from aqueous HAuCl4 and (c) anodic oxidation of
Au are contributed for the modification [71].
For these applications PB modification has been fully tested with many electrode materials such as glassy carbon [64] and graphite [72]. In order to improve the application, a disposable material as the base substrate was employed. Recently, an application of PB with screen-printed electrodes (SPEs) which has been widely used as a disposable electrode
substrate has the advantages of low cost and easy operation [73,74]. Indium tin oxide (ITO) is another possible material that has recently become widely used industrially for thin display panels; thus, it is easy to purchase at standard specifications [75]. ITO is an excellent
photoelectric material because of its high conductivity and photo-penetrability. Although it can decrease electrical resistance when used as an electrode substrate, the electrocatalytic activity of ITO is relatively low when compared with most other types of detectors.
Figure I-6. The Au-PB films were formed by CV behavior of the ITO electrode on potential
cycling.
Surface modification of ITO glass for improving the electrocatalytic activity of electrode by carbon nanotubes (CNTs) was published [51]. In this study, the ITO glass was employed as a base substrate for the modification of Au-PB films. The CV behavior of the ITO electrode on potential cycling to form the Au-PB films is shown in Fig. I-6. The structure of the Au-PB nanocomposite modified on ITO electrode was characterized by SEM as shown in Fig. I-7. The Au-PB nanocomposite structures are getting more and larger with the concentration increasing of ferric cyanide containing HAuCl4.
Figure I-7. SEM micrographs of the surface on (a) bare ITO and (b) PB modified on ITO; the
Au-PB nanocomposite made by (c) 1 mM HAuCl4 and 1 mM K3Fe(CN)6; (d) 2 mM HAuCl4
and 2 mM K3Fe(CN)6 on ITO.
Cysteine, an important sulfur-containing amino acid in living systems, its deficiency is associated with a number of clinical situations, such as liver damage, skin lesions, and slowed growth [76,77]. A variety of chemically modified electrodes have been investigated in order to enhance the analytical signals. The modification layer on the electrode surface generally involves electron-transfer mediators, and thiol oxidation can be facilitated through
electrocatalytic conversion. The direct electrochemical determination of cysteine in real biosamples has been less-often reported, mainly because of substantive interference. To achieve this attractive goal, the detection selectivity has to be greatly improved. In the present report, the electrochemical oxidation of cysteine at an Au-PB nanocomposite films modified ITO electrode was studied. The continuing amperometric sensing result of cysteine is shown in Fig. I-8.
Figure I-8. Amperometric response of the Au-PB nanocomposite modified electrode by
adding different concentrations of cysteine (as shown inset figure) at 1.2 V (vs. Ag/AgCl) in 0.1 M pH 2.4 PBS.
This method offers simple procedure to fabricate the nanocomposite film containing the properties of both gold and PB. The sample was simply to obtain a steady state current and the concentration determined from a calibration graph. It was found to be specific for cysteine oxidation and did not interfere with the matrix in human urine sample at an operating
potential of amperomeric sensing. In addition, chronoamperometry was applied to measure the cysteine concentration in the urine samples following a simple step and was gotten the cysteine recovery from urine sample more than 94.8%. Without complex electrochemical analytical method and any sample treatment procedures, this work provides efficient method for determination of cysteine in real biosamples.
I.2 The measurement of ethanol based on disposable platinum nanoparticles modified electrochemical biosensor
I.2.1 Experimental
I.2.1.1 Reagents and apparatus
The carbon paste sensor substrates were printed by carbon ink (Electrodag 423ss) was purchased from Acheson colloids Co. (Ontario, CA, USA). The chloroplatinic acid (H2PtCl6)
was purchased from Sigma (St. Louis, MO, USA) and dissolved by water in 6.5 mM as a stock solution. The sulfuric acid was purchased from Riedel-de Haën (Morris, NJ, USA). The alcohols, including methanol, ethanol, n-propanol, and iso-propanol, were purchased from Tokyo Chemical Industrial (Tokyo, Japan). All solutions were prepared using deionized (DI) water from a Milli-Q water purification system (Millipore Corporation, USA).
The detection system was an electrochemical analyzer (model 8121b, CHI, USA) coupled with the three electrodes detecting system, including working, auxiliary, and
reference electrodes through sockets. The socket of working was connected with the modified ethanol biosensor, the sockets of auxiliary and reference are connected with Pt wire and Ag/AgCl electrode (MF-2052, Bioanalytical System, USA) respectively. The model of centrifuge is EBA21 (Hettich, Germany). Scanning electron microscope (SEM) image were obtained using S-4700I microscope (Hitachi, Japan).
I.2.1.2 Preparation of modified ethanol biosensor
The sensors were prepared from the carbon paste substrates. The carbon paste was printed on the polyacetate film, and the sensing area was controlled in 0.25 cm2 by epoxide. The Pt nanoparticles were electrodeposited at +2.0 V by 0.2 mM H2PtCl6 in 0.5 M H2SO4 on
preconditioned at +0.8 V in 1 M H2SO4 for 10 minutes before electrochemical analysis, and
then was dried in 60℃ for 30 min. The performance and characteristics were performed by CV and chronoamperometry for ethanol determination.
I.2.1.3 Electrochemical measurements
In a typical measurement, a three-electrode electrochemical cell was used as the sensing system. The cell was filled with 20 mL 1 M H2SO4 as electrolyte. All potentials were
specified relative to the reference electrode, Ag/AgCl (in saturated aqueous NaCl). The CV was set a potential range from 0.0 V to 1.5 V with a scan rate 0.1 V s-1 for deciding a suitable ethanol oxidation potential. The chromoamperometric detection was performed under the condition at 0.8 V (vs. Ag/AgCl) working potential after preconditioning (10 min). When the current reached a baseline in the absence of substrate, every 30-40 s, ethanol was added.
I.2.1.4 Preparation of real samples
The alcoholic beverages were diluted with 1 M H2SO4 in 100-fold and used without any
pretreatment. The serum sample was centrifuged from the blood of a healthy adult male in 3000 rpm for 10 min, and then was diluted with 1 M H2SO4 in 100-fold. The amperometric
determinations of ethanol were performed using the standard addition method.
I.2.2 Results and discussions
I.2.2.1 Optimal Pt nanoparticles modified biosensor composition and characterization To investigate the electrocatalytic ability of the Pt nanoparticle modified biosensor for the electrochemical oxidation of ethanol, which was characterized by CV ranging from 0.0 V to 1.5 V (vs. Ag/AgCl). As shown in Fig. I-9, the cyclic voltammograms were obtained in addition of 5% ethanol in 1 M H2SO4.
Figure I-9. Cyclic voltammograms of 5 % ethanol in 1 M H2SO4 by the biosensor with
different Pt electrodeposition time from 0.5 hr to 4 hr. The scan range was from 0.0 V to 1.5 V (vs. Ag/AgCl) with 0.1 V s-1 scan rate.
The bare carbon paste sensor had a weak response current of ethanol that even can be ignored. The five different electrodeposition times of modified biosensor were from 0.5 hr to 4 hr for CV. The cyclic voltammograms indicated the oxidation potential of ethanol is at 0.8 V. The higher potentials have higher response current, but the exceeding high potential will decrease the life time of modified biosensor. 4 hr electrodeposition time modified biosensor get the largest response current. The Fig. I-10 indicated the effect of different
electrodeposition time on the sensitivity by sensing 10 μM ethanol. The 4 hr electrodeposition time showed the largest sensitivity (1.48±0.05 A M-1 cm-2) and the 0.5 hr showed the smallest sensitivity (0.16±0.01 A M-1 cm-2). The relation between electrodeposition time of Pt and the sensitivity of biosenser are the amount of Pt on the surface of biosensor. The electrodeposition time in 2 hr showed a good sensitivity (1.37±0.05 A M-1 cm-2) around 92% efficiency
comparing to the 4 hr electrodeposition time. The following modification of Pt nanoparticles was chosen 2 hr as the condition of electrodeposition time.
Figure I-10. Effect of different electrodeposition time from 0.5 hr to 4 hr on sensitivity of 10
μM ethanol sensing. Conditions: at 0.8 V (vs. Ag/AgCl) in 1 M H2SO4.
The structure of the Pt modified carbon paste biosensor was characterized by SEM as shown in Fig. I-11. From the energy-dispersive (EDS) spectrum, the surface of carbon paste was covered by Pt nanoparticles with the particle size smaller than 100 nm. According to the EDS spectrum, the point 1 in Fig. I-11 composed of the element weight percentage with 83.12% Pt, which indicated that the component of nanoparticles was mainly Pt. The point 2 which composed of 74.67% carbon was the carbon paste substrate of biosensor. This micrograph depicts the possibility of obtaining Pt nanoparticles by using electrodeposition method.
Figure I-11. SEM micrographs of Pt nanoparticles modified biosensor with 2h
electrodeposition time. The EDS spectrum indicated the nanostructures on the sensor are Pt.
I.2.2.2 Chronoamperometry
The typical current–time response of the prepared biosensor at an applied potential of 0.8 V (vs Ag/AgCl) is shown in Fig. I-12. After the background current was stable, the ethanol solution was added to the electrochemical cell. The concentrations of adding ethanol solution were 10 μM, 20 μM, and 40 μM, respectively. Each concentration was added three times continuously during chronoamperometry. The steady state values of the response current of amperometric sensing were plotted against the concentration of ethanol as shown as
additional curve in Fig. I-12. The typical calibration curve of ethanol was from 0.005 mM to 2.308 mM with a good correlation of coefficient (R2=0.9997). In this case, the response time
sensitivity of this prepared sensor was 1.36±0.04 A M-1 cm-2.
Figure I-12. Amperometric response of the Pt nanoparticles modified sensor by adding (a) 10
μM, (b) 20 μM, and (c) 40 μM ethanol at 0.8 V (vs. Ag/AgCl) in 1 M H2SO4, and typical
calibration curve form 0.005 to 2.308 mM with R2=0.9994.
I.2.2.3 Reproducibility and long-term stability
The reproducibility of successive measurements with a single sensor is shown in Fig. I-13. The Pt nanoparticles modified biosensor in this test was prepared using 2 hr
electrodepostion time. When the ethanol sensing test was carried out in 20 repeat
measurements with a single biosensor, the sensitivity showed a range from 1.31 to 1.46 A M-1 cm-2. The overall measurements showed the average of sensitivity in 1.37 AM-1cm-2, and the coefficient of variation is 3.25%. The fact that the measured low sensitivity fluctuates during successive measurements illustrates the stability of the Pt nanoparticles modified on the carbon paste substrates.
Figure I-13. The reproducibility of measurements repeated 20 times with a single sensor by
detecting 10 μM ethanol at 0.8 V (vs. Ag/AgCl) in 1 M H2SO4.
Not only reproducibility of a modified biosensor is an important issue, but long-term stability. Fig. I-14 shows the long-term stability test with a single biosensor during a week and 10 measurements per day. The sensitivity was 1.37±0.05 A M-1 cm-2 in the first day of ethanol sensing. After a week of long-term tests, the sensitivity declined to 1.24±0.08 A M-1 cm-2. The results showed about 10% decay and still had 90% efficiency of ethanol sensing. The long-term stability of this modified biosensor was performed.
Figure I-14. The long-term stability of this sensor during a week with a single sensor, 10
measurements per day. The other conditions are the same as Fig. I-13.
The analytical performances for this modified biosensors was summarized in Table I-2. The present Pt nanoparticles modified ethanol biosensor exhibited fast response time, wide linear range, good sensitivity, and long-term stability compared to those modified ethanol biosensors as summarized in Table I-2. These advantageous characteristics of the present ethanol biosensor provided a simple method to manufacture and without using any enzyme.
Table I-2. Response characteristics of the ethanol biosensors based on different
immobilization matrices.
Response time
(s) Linear range (mM) Sensitivity (A M-1 cm-2) Long-term stability Reference
Ptnano on carbon paste 7 0.005-2.308 1.38 90% after 1 week This study
Ni/Pt/Tinano on Al2O3 27 0.083-0.498 3.08 N/A [21]
RuO2 on Ni 13 21.7-217* 0.23* 60 days (RSD=29%) [22]
CNT paste 10 5-30 0.63 78% after 6 months [19]
PVA–CNT–ADH on GCE 8 0.013-1.5 0.28 88% after 1800s [13]
*. Conversed from 100-1000 ppm and 4.92 μA ppm-1cm-2 N/A: data not available
I.2.2.4 Analysis of alcohols
The response of this modified biosensor toward alcohols decreases in the order methanol
> ethanol > n-propanol > iso-propanol as shown in Fig. I-15. The higher activity of methanol
compared with ethanol is probably caused by the smaller molecular weight of methanol.
Figure I-15. Amperometric response of alcohols sensing including methanol, ethanol,
n-propanol, and iso-propanol. Conditions: at 0.8 V (vs. Ag/AgCl) in 1 M H2SO4.
This suggests that an increase in the linear chain length of alcohols increases the lipophilicity which will reduce its transportation from the aqueous phase to the interface of the sensing electrode. It is concluded that this Pt nanoparticles modified biosensor is sensitive with alcohols, especially for methanol and ethanol. Thus, this kind of sensor is suitable for use in medical and brewing applications.
I.2.2.5 Analysis of alcoholic beverages and serum
In order to estimate the application of the methodology, the present ethanol biosensor was tested by determining the ethanol concentration in two different alcoholic beverages: beer, and red wine. The determined results were summarized in Table I-3. The alcoholic samples
were diluted in 100-fold. In this dilution fold, the concentration of ethanol in the sample was fitted in the linear range of this biosensor. To decrease the matrix effect, a higher dilution fold which was necessary was obvious in the determined results. This Pt nanoparticles modified biosensor showed a good performance to determine the ethanol in alcoholic beverages.
Table I-3. Results for the determination of ethanol in alcoholic beverages using Pt
nanoparticles modified biosensor
Sample Nominal (%, v/v) Biosensor (%, v/v)
Beer 4.5 4.3 ± 0.1
Red Wine 13 13.2 ± 0.8
N=5
In the analysis of blood, serum was generally applied for the measurement of blood alcohol level. Therefore, the matrix effect from serum was an important issue for the
electrochemical biosensor. A standard addition method was applied for the determination of ethanol in serum, the results of ethanol recovery were summarized in Table I-4.
Table I-4. Results of determination for the standard addition of ethanol in serum using Pt
nanoparticles modified biosensor
Added ethanol conc. (μM) Recovery (%)
5 86.1 ± 2.6 10 89.3 ± 2.1 20 91.4 ± 2.8 50 95.8 ± 3.7 100 96.2 ± 3.9 N=3
The serum sample was obtained the recovery from 86.1 (±2.6)% in 5 μM to 96.2 (±3.9)% in 100 μM additional ethanol. The matrix effect of serum was only obviously appeared in low concentration of additional ethanol. The concentration of additional ethanol at 5 μM was approached the minimum of linear range, the ratio between ethanol and matrix
the concentration of additional ethanol was getting higher, the recovery was near to 100% and was showed the lower matrix effect. The present Pt nanoparticles modified biosensor
exhibited the good potential of the application for the measurement of ethanol in the diluted serum sample.
I.2.3 Conclusion
In this study, we demonstrated that a sensitive and stable ethanol biosensor can be constructed based on Pt nanoparticles modified electrochemical biosensor, and its
characteristics were investigated. The relationship between current and ethanol concentration was linear with ethanol concentrations from 0.005 to 2.308 mM. The present modified biosensor has exhibited remarkably fast response time within 7 s, good reproducibility, and long-term stability (90% efficiency after a week). The sample was simply to obtain a steady state current and the concentration determined from a calibration graph. In addition,
chronoamperometry was used to measure the ethanol concentration in the real samples following a simple dilution step. This biosensor could readily be applied to the determination of ethanol in alcoholic beverages. For human serum analysis, this biosensor can be assist by standard addition method to indentify the concentration of ethanol. Therefore, the present Pt nanoparticles modified electrochemical biosensor can be applied in sensing and monitoring for ethanol analysis in medicine, brewing, fermentation, and possible in the blood alcohol level sensing of drunk driving.
Part II. The fabrication of microchip capillary electrophoresis integrated
with electrochemical detection
II.1 Introduction
The miniaturized microfluidic devices integrated with capillary electrophoresis separated technique, also called microchip CE, including sample treatment, separation, and detection in a whole analytical process are an interesting topic. The one of advantage of microchip CE is the variable fabrications. Different fabrications of microchip CE have different functions and properties. The detections of microchip are including two main parts, the optical and
electrochemical systems. The laser induced fluorescence (LIF) and ultraviolet (UV) are often used as optical detections for microchip. The main limitation of optical detections is always from the optical reaction of analytes. In order to prevent this issue, a pre-treatment for analyte derivative is necessary. The electrochemical detection for microchip CE can prevent the main limitation of optical detections. However, the integration of electrochemical detection with microchip CE becomes an important issue. Different integrations cause different detecting results. In the present studies, the off-channel electrochemical detection was applied in the microchip CE. In addition, the fabrications in conjunction with the electrochemical detection are another interesting topic in this field.
II.1.1 The introduction of microchip
II.1.1.1 Materials
Miniaturized microfluidic devices in which features of photolithographic technologies and capillary electrophoresis (CE) are combined, have recently become a major focus of interest for the preparation of micro total analysis systems (μTAS, also known as
lab-on-a-chip systems). Microfluidic devices have been used in electrophoretic separations of a variety of biochemical and chemical analytes [80–83]. These devices have typically been prepared from glass [84–88], quartz, silicon, and a range of polymeric materials [89–95]. Polymeric materials, such as PMMA [89–92] and PDMS [93–95], have great potential for the large-scale fabrication of disposable microfluidic device for use in analytical systems, due to their ease of fabrication, low cost, and great versatility. For polymeric devices, a number of processing techniques can be used to create the required network of microchannels, and all of these approaches have been employed and examined for use in the fabrication of polymeric microfluidic devices including photolithography, wire imprinting, hot embossing, powder ablation, laser photoablation, casting, and injection molding [96–102].
In recent years, disposable plastic-based substrates have become extremely popular for use in microfluidic applications owing to the fact that they are easily and inexpensively fabricated. Sudarsan and Ugaz demonstrated the use of printed circuit technology for the fabrication of plastic-based microfluidic devices [103]. do Lago et al. established a dry process for the production of microfluidic devices based on a xerographic process and the lamination of laser-printed polyester films [104].
Microchip photoresists are used mostly for protecting patterns on the bottom substrate during the etching process. Photoresists exist in both liquid and dry-film forms and are categorized as having either positive or negative responses toward exposure. Generally, negative photoresists operate within a larger temperature and humidity range than positive ones [105]. Although photoresists are generally considered sacrificial materials, liquid-type negative photoresists have been used to create microchannels within microchips [106,107], and they may play an important role as a principal component of a microchip. In a microchip that uses a photoresist as a subject material, the thickness of the photoresist determines the size of the channel. Therefore, control over its thickness is extremely important. Spin coating
is used to control the thickness of liquid-type photoresists in a chip, but dry-film photoresists have a specific thickness [108,109]. In addition, dry-film photoresists have many advantages over their liquid counterparts including good conformability, no liquid handling, high
processing speeds, excellent uniformity of thickness, ease of handling, low cost, short processing time and near-vertical sidewalls [108-110]. Taking all of these properties into account, we used a negative dry-film photoresist (an acrylate-based photopolymer) as the material for fabricating a dry-film photoresist-based microchip.
II.1.1.2 Fabrications
The development and fabrications of the channels on microchip are variety. For silica based microchip, the most widely used fabrications are hot embossing, powder ablation, laser photoablation; in the other hand, for polymer based microchip, wire imprinting, casting, injection molding, and photolithography are the well-known fabrications [96–102].
The silica based microchip has the properties that similar to the fuse silica capillary has better abilities of electrophoresis (i.e. electroosmotic flow, EOF) than the other materials. However, the procedures of fabrication for silica based microchip are expensive and
time-consuming. The polymers, such as PMMA, polycarbonate, polyethylene, and PDMS, are becoming the main material for the fabrication of microchip.
Even if PMMA has the great potential for the large-scale fabrication of disposable microfluidic device for use in analytical systems, due to its low cost, the property of surface for electrophoresis couldn’t provide a stable EOF. Therefore, the PDMS, a silicone based polymer, is replacing the uses of PMMA gradually. PDMS has been applied most widely to microchip fabrication because it exhibits several favorable characteristics: (i) its optical diaphaneity down to 230 nm makes it suitable for optical detection; (ii) it cures at low temperatures so that molding is readily replicated through a process of master formation,
prototyping, and soft lithography; (iii) it can be sealed reversibly to itself and other materials with the clear smooth surface at room temperature through van der Waals contacts; (iv) it can be sealed permanently to itself and glass; and (v) its surface chemistry can be controlled to form an EOF using plasma techniques [111]. Microchip CE utilizing a PDMS slice combined with a glass substrate was first developed by Effenhauser [112]; since then, many applications of PDMS in microchip CE-EC and microfluidic channel design have been reported [113]. Moreover, the fabrication of photoresist for microchip was described in the section 1.2.1 of part II. A typical fabrication of PDMS/glass slice in conjunction with electrochemical
detection is shown in Fig. II-1.To prevent the leakage of buffer solution on the microchip, the sealing is an important issue for the fabrication of microchip. The silica and PMMA based microchip always apply the hot pressed to seal the microchip but need expensive equipment to get the high temperature. The PDMS based microchip are widely used the plasma to treat the PDMS surface to form the chemical bonding between the two PDMS slice to seal [111]. This fabrication is the most effective procedure for PDMS based microchip. However, it can’t fabricate reusable microchip.
Figure II-1. Fabrication procedures of off-channel detection microchip. The microchannel
was molded by PDMS from patterned silica wafer. The decoupler (Pd) and working electrode electric conduction layer (Au) were coated by electro beam evaporator on glass slide. The working electrode was printed a layer of carbon ink on Au electric conduction layer as a carbon paste electrode [114].
In the present study, a clamping apparatus for microchip as a reversible sealed microchip system was designed to solve the leaking problem. The assembling processes of reversible sealed clamping apparatus are shown in Fig. II-2.
Figure II-2. The assembling processes of reversible sealed clamping apparatus. The system is
a sandwich construct with microchip is fixed by six stainless screws [114].
The material of clamping apparatus is PMMA which was accurately fabricated and patterned by computer numerical control (CNC) milling machine. This clamping apparatus is not only fixed the microchip but provide the reservoirs for buffer solution. Whole clamping apparatus with microchip which is a sandwich construct is fixed by stainless screws. The microchip can be disassembled and cleaned reversely.
II.1.2 The integrations of electrochemical detection with microchip
II.1.2.1 Integrating a dry-film photoresist-based microchip with electrochemical detection Microchip CE is characterized by a number of analytical advantages, including its rapidity, a small sample requirement and the potential for integration [115-117]. The main materials currently used for the cores of such microchips are glass, silica and polymers. Unfortunately, silica materials have limited potential for further microminiaturization of channel widths and cost reduction because the fabrication technologies typically
employed—photolithography, wet etching and thermal bonding—are low-production, time-consuming and expensive processes. Because of the cost of glass microchip devices, polymer materials are more commonly used. Polymer-based devices are inexpensive and easy to manufacture relative to silica-based devices. The major techniques for fabricating
polymer-based microchips include imprinting, hot embossing and injection molding [118-120]. A number of polymers have been used for the fabrication of replica microchips. Although these published fabrication procedures can supply stable, high-quality and useful microchips, the techniques remain challenging. Because commercial microchips are expensive, most researchers choose to fabricate their own; thus, simple procedures for the fabrication of microchips are still in demand. Photoresists are used mostly for protecting patterns on the bottom substrate during the etching process in the fabrication of microchip. The basic properties and the applications of photoresists were described in the section 1.1.1 of part II, especially the dry-film type.
The most frequently used methods of detection for microchips can be divided roughly into optical and electrochemical approaches. The commonly used electrochemical detection methods can be further classified into amperometry- [116,121-124] and conductivity-based [125,126] systems. The most important advantage of electrochemical detection is that the compounds need not be labeled with fluorescent dye as long as they can be reduced or
oxidized. In addition, by changing the kind of electrochemical sensor, the selectivity and sensitivity during the detection can be controlled.
II.1.2.2 Reversible sealed microchip electrophoresis integrated with electrochemical detection for phenolic acid analysis
The development of miniaturized devices for chemical analysis is becoming increasingly important, particularly for multifunctional applications and simplified fabrications. Such “lab-on-a-chip” devices have the potential to be the portable analytical tools, including the efficiencies of sample preparation, delivery, and analysis [80]. Capillary electrophoresis (CE) offers the fast, simple and efficient for microchip separation. The advantages of these devices include lower analyte and sample consumption, rapid analysis time, and high-resolution separations using extremely small volumes relative to liquid chromatograph (LC). Fabrication of microchip CE devices also provides benefits, including excellent precision, reproducibility, and cheap mass fabrication of complicated microstructure [127].
The needs of multiple detection methods is increasing since microchip CE devices grow in popularity. In common use of optical detection methods that require labeling, such as laser induced fluorescence (LIF) and ultraviolet (UV), have been explored for microchip CE [128-130]. In contrast to some optical methods, electrochemistry is unique because miniaturization of electrodes does not decrease the detecting performance [131] and opaque material can be utilized a microchip [132]. The electrochemical (EC) detection is recently being widely used for microchip. EC detection has shown potential for many applications and provides mass sensitivity levels similar to LIF, and the most important advantage of which is the compounds need not to be labeled with any fluorescent dye, so long as they can be reduced or oxidized [133-135].
and reversible sealed clamping apparatus, for rapid measurements of catecholamines and phenolic acid. Microfluidic devices have shown attractive possibilities in biochemical analysis [136]. The ability to perform reversible sealed microchip offers significant advantages to catecholamines, phenolic acid analysis and modified electrode in terms of versatility, performance, miniaturization, stability, recycle-used, reproducibility and cost. Carbon paste modified electrode, combining the analytical advantages of microfluidic devices with the stability and simple fabrication of EC detection [106]. Commonly used working electrode materials for chip-based EC detection include platinum [124], gold [137], and various forms of carbon [138,139], with each material offering certain advantages and disadvantages for a given application. Furthermore, amperometric (end-column or off-column) detection requires relatively high operating potentials results in higher background noise and often leads to surface passivation. The carbon paste modification, facilitates low potential detection, imparts enhanced sensitivity, and leads to enhanced stability. Carbon paste which is modified on gold base electrode is easily to erase by acetone and to modify a new carbon paste on the same base again. The deactivation of working electrode is easily avoided, and reached a real low-cost and low-waste modified electrode.
Phenolic acids are an important group of secondary metabolites, which are synthesized by plants as a result and relate with biotic and abiotic stress conditions (infection, wounding, water stress, cold stress, high visible light). Protective phenylpropanoid metabolism in plants has been well investigated. In recent researches, phenolic acids have attracted great interest from researchers because polyphenols are antioxidants with redox properties, which allow them to perform reducing agents, hydrogen donators, and singlet oxygen quenchers. Many epidemiological studies have shown that consumption of edible plants rich in phenolic acids is associated with a lowered risk of degenerative diseases such cancers, cardiovascular diseases, and immune dysfunctions. A detection method that allows the presence of phenolic
acids in coffee sample to be monitored by reversible sealed microchip integrated with carbon paste modified electrode was shown in Fig. II-3. Such advantages of the carbon paste modified detection for microchip CE are reported in the following sections, along with detailed characterization.
Figure II-3. Electropherogram of coffee sample. (a) Diluted 30-fold coffee and (b) added 25
μM chlorogenic acid, caffeic acid, sinapic acid, and 100 μM vanillic acid in (a). The peaks are (1) chlorogenic acid, (2) sinapic acid, (3) caffeic acid, and (4) vanillic acid, separately [114].
II.1.2.3 In-channel simplified decoupler with renewable electrochemical detection for microchip CE
Microchip CE is a useful separation technique that enables rapid detection of analytes within small sample volumes. Since the introduction of miniaturized CE systems over a decade ago [140], microchip CE has become increasingly popular, especially for high-throughput analyses, because of its low consumption of reagents, low generation of waste, high disposability and portability, the ability to integrate pre-treatment and post-separation processes, and the ability to perform multiplexed analysis [133,141-144]. Although laser-induced fluorescence (LIF) is the most commonly utilized optical detection
achieved only when the analyte is derivatized prior to analysis. Unlike optical methods, the performance of electrochemical (EC) detection systems does not decline upon miniaturizing the electrodes [131]; in addition, EC allows opaque materials to be used in the microchips [132]. Thus, EC detection for microchip CE analyses is becoming increasingly popular [133,142,148]. Of the three EC methods—amperometry [149,150], conductimetry [125,151], and voltammetry [152]—that have been applied to microchip CE detection, amperometric detection is the most popular. Examples of microchip CE-EC applications are found in enzyme assays, immunoassays, neurotransmitter analysis, clinical diagnostics, and environmental monitoring [153-156]. Many of the methods used to fabricate microfluidic channels can also be employed to construct microchip CE-EC systems. A fully integrated microchip containing electrodes for both electrophoresis and EC detection has been demonstrated [157].
There are three main approaches to integrating EC with microchip CE: end-channel, in-channel, and off-channel detection [158]. For end-channel detection, the working electrode is positioned in the exit of microchannel. The effect of the separation field on the working electrode is minimized through use of extremely low separation currents. Although the detection noise due to the separation current decreases when the working electrode is positioned further from the microchannel outlet, the detection sensitivity also decreases as a result of the loss of analytes through diffusion in the detection cell [159]. In-channel and off-channel detection systems can be employed to prevent such loss of analytes, but interference from the high electric field and electrophoretic current on the EC measurement can be problematic, leading to a larger EC background current and a shifted redox potential [158]. An in-channel amperometric detection system lacking a decoupler has been developed; it uses an electrically isolated potentiostat [160]. In the off-channel arrangement, the separation potential must be grounded before the analyte reaches the microchannel outlet to
eliminate interference from the separated electric field and to protect the EC detector from damage resulting from surges in current. A decoupler placed in front of the working electrode can be used to protect the EC detection system from interference [106,161-164]. Currently, several types of decoupler have been fabricated, including thin film [106,161-164] and microwire [163] electrodes. A solid Pd film integrated directly into the CE microchip across the separation channel has been prepared using microfabrication techniques; it replaced the decoupler in a joint connection-type system [161]. The reason why Pd metal was adopted is that platinum (Pt)-group metals, such as Pd and Pt, effectively reduce and absorb hydrogen ions. Because molecular hydrogen diffuses faster on a Pd surface, it is eliminated from the Pd decoupler before the development of hydrogen bubbles in the electroosmotic flow (EOF), maintaining the efficiency of the decoupler [161,162]. A Pd microelectrode wire decoupler and metal wire working electrode have been integrated within a microchip CE-EC system to eliminate the microfabrication steps used to construct the electrodes [163].
The fouling of metal working electrodes is a serious concern affecting microchip CE-EC [165]. Inactivation of electrodes upon repeated injection or varying analyte concentrations affects the sensitivity, limit of detection, and reproducibility of microchips. Although surface regeneration of an electrode can improve its performance, an optimized cleaning procedure applied to a specific electrode might not be applicable to routine retuning of all electrodes.
Most CE microchips have been fabricated from glass or quartz because such materials are suitable for optical detection and readily generate EOFs. Unfortunately, the fabrication of glass substrate microchips requires clean-room processing and high-temperature thermal bonding; thus, it is difficult to perform in most general laboratories [136]. A more amenable approach is the use of polymers, such as PMMA, polycarbonate, polyethylene, and PDMS, rather than glass or silicon, to form CE microfluidic channels [137].
microchip CE-EC devices was presented. The procedures used to place the metal wires and assemble the microchip are illustrated in Fig. II-4. The Pt wire electrode serving as a decoupler and the Cu working electrode were incorporated into the PDMS sheet. Catechol and dopamine as analytes to demonstrate the separation efficiency of the microchip CE-EC system and to evaluate the performance of the renewable working electrode were employed. The performance of this renewable working electrode microchip CE-EC system is shown in Fig. II-5. The extended reuse of such renewable working electrodes coupled with these simple microchip fabrication techniques will increase the usability of microchip CE-EC systems.
Figure II-4. Procedure for the fabrication of the in-channel decoupler/renewable electrode
![Figure I-1. Potential-time excitation signal in cyclic voltammetric ecperiment [1].](https://thumb-ap.123doks.com/thumbv2/9libinfo/8411768.179881/12.892.129.802.205.821/figure-potential-time-excitation-signal-cyclic-voltammetric-ecperiment.webp)
![Figure I-2. Typical cyclic voltammogram for a reversible O + ne- R redox process [1]](https://thumb-ap.123doks.com/thumbv2/9libinfo/8411768.179881/13.892.124.804.106.839/figure-typical-cyclic-voltammogram-reversible-o-redox-process.webp)
![Figure I-3. Chronoamperometric experiment: (a) potential-time waveform; (b) change of concentration profiles with time; (c) the resulting current-time response [1]](https://thumb-ap.123doks.com/thumbv2/9libinfo/8411768.179881/15.892.127.794.104.834/chronoamperometric-experiment-potential-waveform-concentration-profiles-resulting-response.webp)
![Figure I-5. SEM images of (a) Nafion and (b) CNT/Nafion films on ITO electrodes; magnified by a factor of 10,000 [51]](https://thumb-ap.123doks.com/thumbv2/9libinfo/8411768.179881/19.892.122.802.414.982/figure-images-nafion-nafion-films-electrodes-magnified-factor.webp)
![Table I-1. Figures of merit for the determination of catecholamines [51]](https://thumb-ap.123doks.com/thumbv2/9libinfo/8411768.179881/20.892.119.789.435.919/table-i-figures-merit-determination-catecholamines.webp)