國立交通大學環境工程研究所
碩士論文
利用海水沉澱法所製備之碳酸鈣與碳酸鎂
捕獲二氧化碳
Sea water precipitated calcium and magnesium
oxides sorbents for CO
2capture
研 究 生:Rosa Amarilis Dubón Mazariegos
指導教授:白曛綾教授
利用海水沉澱法所製備之碳酸鈣與碳酸鎂捕獲二氧化碳
Sea water precipitated calcium and magnesium oxides
sorbents for CO
2capture
研 究
生
:杜若思 Student:Rosa Amarilis Dubón Mazariegos
指導教授:白曛綾 Advisor:Hsunling Bai
國 立 交 通 大 學
環 境 工 程 研 究 所
碩 士 論 文
A Thesis
Submitted to Institute of Environmental Engineering
College of Engineering
National Chiao Tung University
In Partial Fulfillment of the Requirements for the Degree of
Master In Environmental Engineering
October 2010
Hsinchu, Taiwan, Republic of China
ACKNOWLEDGMENT
First, I would like to thank GOD for giving me the strength and the patience to fulfill my Master degree. Thanks to my family: my Mother, Dora Marina Mazariegos for always praying for my security and my good life; my Father, Cristobal Alfredo Dubón, for supporting me all the time, my brothers Freddy and Sarita for their love and comprehension during all this time.
I thank the Ministry of Education in Taiwan and Consejo Superior Universitario de centroamérica (CSUCA) for providing the financial support for the achievement of this Master degree. Thanks for all the staff of the Environmental Engineering Department that helped me in my studies. I thank National Chiao Tung University (NCTU) for the opportunity of pursuing my degree within their walls. I thank to Power Research Institute, Taiwan for the support in this research. I would like to express my heartiest thanks to my advisor Hsunling Bai, for letting me know the spirit and attitude to do research, and for her encouragement and support throughout the last two years. Also to Professors M.Karthik, Sue-min Chang, Chuen-Jinn Tsai, for sharing their knowledge during the courses I took with them.
Last but not least thanks to my Taiwanese, foreign friends, every one of my lab-mates, and friends back home for their friendship and support. All the people that make me feel at home during these two years on this beautiful island.
Sea water precipitated calcium and magnesium oxides sorbents
for CO
2capture
Student: Rosa Dubón Advisor: Hsunling Bai Institute of Environmental Engineering
National Chiao Tung University
Abstract
Calcium based sorbent for cyclic calcination/carbonation is considered as one of the promising CO2 capture technologies. But the
prevention of CaO sintering and deterioration is a challenge for the development of CaO technology. In the present study the mechanical mixing method between sea water precipitated CaO and MgO to enhance the sorption capacity during cyclic capture is demonstrated. The cyclic CO2 capture capacities of the sorbents were evaluated by thermo
gravimetric analysis (TGA). The results indicated that by adding only 5 wt. % of MgO into the CaO sorbent (CaO-MgO), the CO2 absorbed
amount can be improved by 17% compared to the original CaO sorbent. Instead of passing CO2 only during the sorption period, passing CO2 right
after the calcination process is completed (i.e. during the cooling and sorption periods) can greatly improve the capacity and stability of the cyclic absorption. The heating and cooling rates also affect the sorbent performance significantly.
Keywords: CO2 capture and storage (CCS), greenhouse gas, greenhouse
effect, limestone, calcium oxide, chemical looping.
CONTENT
CHAPTER ONE INTRODUCTION ... 1
1.1 Research background ... 1
1.2 Motivation ... 3
1.3 Objectives ... 4
CHAPTER TWO LITERATURE REVIEW ... 5
2.1 System to Capture CO2 ... 5
2.1.1 Capture from industrial process streams ... 5
2.1.2 Pre combustion capture ... 6
2.1.3 Post combustion capture ... 7
2.1.4 Oxy fuel combustion capture ... 9
2.2 Types of CO2 capture technologies ... 10
2.2.1 Separation with sorbents/solvents ... 11
2.2.2 Separation with membranes ... 12
2.2.3 Distillation of a liquefied gas stream and refrigerated separation ... 12
2.3 Modes of CO2 storage ... 12
2.4 CO2 utilization ... 13
2.4.1 New process for CO2 abatement ... 14
2.4.2 Capture of CO2 in biomass (plants and algae) ... 14
2.4.3 Mineral carbonation ... 15
2.6 Absorption system to capture CO2 ... 16
2.7 Carbonation and calcination cycles in the CaO-CO2 absorption process ... 18
2.8 Sorbent deactivation ... 21
2.9 Cost assessments ... 22
2.10 Magnesium carbonate ... 22
2.11 CaO sorbents mixed with other metals ... 23
CHAPTER THREE EXPERIMENTAL METHOD ... 26
3.1 Procedure and method ... 26
3.2 Sorbent preparation technique ... 26
3.3 Characterization ... 29
3.4 Equipment and chemicals component ... 30
3.5 Experimental apparatus TGA System ... 30
3.6 Packed column test system ... 33
CHAPTER FOUR RESULTS AND DISCUSSION ... 35
4.1 Characterization ... 35
4.1.1 X-ray diffraction (XRD). ... 35
4.1.2 ICP-MS analysis ... 37
4.1.3 BET surface area analysis ... 38
4.2 CO2 absorption temperature range ... 41
4.2.1 Determination of the optimal absorption temperature ... 41
4.2.2 Effect of the cooling rate to determinate the optimal absorption temperature ... 44
4.3 Desorption temperature ... 45
4.4 CO2 absorption at constant absorption temperatures ... 47
4.5 Cyclic test at different absorption temperatures ... 49
4.6 Effect of heating and cooling rate ... 51
4.6.1 Effect of cooling rate on the CO2 absorption process at 20°C/min and 60°C/min ... 51
4.6.2 Effect of heating rate in the CO2 absorption process at 40 k/min, 50 k/min and 60 k/min ... 52
4.7 Effect of passing CO2 in the cooling process. ... 53
4.8 Mixture of CaCO3 (95%) and MgCO3 (5%) ... 54
4.9 SEM images CaCO3 after CO2 23 cycles at different temperatures ... 60
4.10 SEM images Mg-Ca Mixture after CO2 after carbonation/calcinations cycles at 700°C using TGA ... 63
4.11 Packed column adsorption test ... 64
CHAPTER FIVE CONCLUSIONS AND RECOMMENDATION ... 68
5.1 Conclusions ... 68
5.2 Recommendation ... 69
REFERENCES ... 70
LIST OF TABLES
Table 2-1 CO2 Capacity of metal oxides………..16
Table 2-2 Performance of some absorbents for CO2 capture………….. 25
Table 3-1 Typical test condition for the cyclic test of carbon dioxide capture using TGA………... 32
Table 3-2 Change in parameters for finding the optimal conditions for the carbon dioxide capture using TGA ………..32
Table 3-3 Test condition for the carbon dioxide capture using packed column………..………34
Table 4-1 Concentration for metallic impurities in CaCO3 and MgCO3 sea
water precipitates by ICP-MS…….………..37
Table 4-2 CaCO3 and MgCO3 precipitates from sea water surface area
LIST OF FIGURES
Figure 2-1 Pre combustion system for CO2 capture ... 7
Figure 2-2 Post combustion system for CO2 capture ... 8
Figure 2- 3 Oxyfuel combustion system for CO2 capture ... 9
Figure 2- 4 Types of CO2 capture technologies. ... 10
Figure 2- 5 Overviews of geological storage options. ... 13
Figure 2- 6 Non-reacted and reacted particle of CaCO3 ... 19
Figure 2-7 Decomposition pressure of carbon dioxide over calcium carbonate ... 20
Figure 3-1 Flow chart of the experimental study ... 27
Figure 3-2 Calcium and Magnesium carbonate mixture procedure. ... 28
Figure 3-3 Schematic of TGA system for absorption ... 31
Figure 3-4 Schematic of packed column system for absorption ... 33
Figure 4-1 XRD of the calcium carbonate, magnesium carbonate precipitates fresh sample and CaO-MgO mixture sorbent after carbonation/calcination cycles ... 36
Figure 4-2 (a) Pore size distribution CaCO3 precipitates from sea water ... 39
Figure 4-2 (b) Pore size distribution MgCO3 precipitates from sea water. ... 39
Figure 4-2 (c) Pore size distribution CaO after carbonation/calcination cycles ... 40
Figure 4-2 (d) Pore size distribution CaO-Mg after carbonation/ calcination cycles ... 40
Figure 4-3 (a) CO2 absorption curve. Decreasing temperature from 850°C
to 20°C at 20°C/min ... 42
Figure 4-3 (b) CO2 Absorption rate curve. Decreasing temperature from
850°C to 20°C at 20°C /min ... 42 Figure 4-4 (a) CO2 absorption curve. Increasing temperature from 20°C
to 850°C at 20°C /min ... 43
Figure 4-4 (b) CO2 Absorption rate curve. Increasing temperature from
20°C to 850°C at 20°C /min ... 43
Figure 4-5 (a) CO2 absorption curve. Effect of cooling rate at 10, 20 and
60°C/min. ... 44 Figure 4-5 (b) Absorption rate curves at different cooling rates ... 45 Figure 4-6 (a) CO2 desorption rate. At 800°C, 825°C and 850 °C... ... 46
Figure 4-6 (b) CO2 absorption curves. Desorption temperatures at 800°C,
825 °C, and 850°C, carbonation temperature at 700°C …... 47 Figure 4-7 (a) CO2 absorbed amount at 650°C, 700°C, 730°C, and 760 °C
Desorption temperate 850°C. Absorption time 30 min………48 Figure 4-7 (b) CO2 absorption rates 650°C, 700°C, 730°C, and 760 °C.
Desorption temperate 850°C ... 49 Figure 4-8 CO2 absorption cyclic tests at 650 °C, 700 °C, and 730 °C.
Carbonation time 10 min, calcination time 1 min at 850 °C, heating rate 40 °C/min, cooling rate, 60°C/min ... 50 Figure 4-9 Effect of cooling rate at 20° C/min and 60 °C/min in the CO2
cyclic absorption. Heating rate at 40°C/min, absorption time 10 min at 700°C, desorption time 1min at 850°C. ... 51
Figure 4-10 Effect of heating rate on the cyclic absorption process at 40 °C/min, 50 °C/min and 60 °C/min. Cooling rate 60°C/min,
absorption temperature 700°C, desorption temperature 850°C ... 52
Figure 4-11 Effect of passing CO2 in the cooling process from 850 °C to
700 °C for absorption. Desorption 1 min at 850°C. Heating rate 40°C/min, cooling rate 60°C/min ... 53
Figure 4-12 CO2 cyclic absorption test for Ca-Mg mixture and pure CaO
sorbent. Aborption time 10 min at 700 °C, calcination time 1min at 850°C, heating rate 40°C/min, cooling rate 60°C/min. ... 55
Figure 4-13 CO2 cyclic absorption test for CaO-MgO mixture and pure
CaO sorbent. Passing CO2 during the cooling time, absorption
time 10 min at 700 °C, calcination time 1 min at850°C, heating rate 40°C/min, cooling rate 60°C/min. ... 56
Figure 4-14 (a) cyclic absorption test for CaO-MgO mixture sorbent with and without passing CO2 in the cooling time and pure
CaO. Carbonation time 10 min at 700°C, calcination time 1 min at 850°C, heating rate of 40°C/min and cooling rate of
60°C/min ... 57 Figure 4-14 (b) cyclic absorption test for CaO-MgO mixture sorbent
passing CO2 in the cooling time and pure chemical limestone
carbonation temperature 700°C, calcination temperature 850°C at heating rate of 40°C/min and cooling rate of 60°C/min.. ... 58 Figure 4-15 CaO-MgO mixture sorbent absorbent amounts at heating rate
of 40 °C/min and 60°C /min passing CO2 in the cooling time.
Carbonation temperature 700°C, calcination temperature 850°C. ... 59
Figure 4-16 SEM images CaCO3 precipitates from se water. a) Fresh
sample b) 650°C c) 700°C d) 730°C. After 23 cycles. ... 61 Figure 4-17 EDX diagram of CaCO3 precipitates from se water fresh
sample. a) square shape b) slide shape c) Particle shaped. ... 62 Figure 4-18 EDX (a) fresh CaO-MgO mixture sorbent (b) SEM images
CaO-MgO mixture after 10 cycles. Both at 700°C using TGA at heating rate 40k/min and cooling rate 60k/min... ... 63
Figure 4-19 SEM images Mg-Ca Mixture at 700°C after 10 cycles using TGA. (a) At heating rate 40°C /min. (b) at heating rate 60°C /min. Both samples with a fixed cooling rate of 60°C /min passing CO2. ... 64
Figure 4-20 Cyclic CO2 capture efficiency by packed column test.
(Flow rate: 500 ccm, 15% CO2, 6% O2, 79% N2, absorption at
700°C for 10 min, desorption at 850°C for 30 min, heating rate 36°C/min, cooling rate 6°C/min). ... 65 Figure 4-21 CO2 removal efficiency by packed column test. ... 66
Figure 4-22 Cyclic CO2 capture capacities CaO-MgO sorbent by both
TGA and packed absorption column tests. Absorption time 10 min ... 67
CHAPTER ONE INTRODUCTION
1.1 Research background
In recent years it has been claimed that the human activity, especially the use of fossil fuel energy, is responsible for the increasing CO2 concentrations in the atmosphere affecting climate change (IPCC
2005). It was stated that the upper limit of safe greenhouse gas concentration is somewhere between 300-350 ppm CO2 (Hansen 2008).
Carbon dioxide emission is currently 385 ppm and rising at a rate of 2 ppm per year, means that actions needed to ‘draw down’ atmospheric CO2. Therefore reducing the CO2 emission is considered to be one of the
most important challenges of this century. Theoretically, CO2 (or carbon)
Capture and Storage (CCS) has the ability to meet this challenge and reduce CO2 atmospheric concentration.
The main purpose of CCS is to reduce CO2 emissions by capturing
CO2 that is released from large point source emitters such as power plants,
refineries, cement plants and steel mills. The CO2 must then be store in
depleted oil and gas reservoirs or deep saline formations that have the geological characteristics necessary to store large quantities of CO2. This
will allow the continued use of coal, oil, and gas while avoiding the CO2
emissions currently associated with fossil fuel use.
Many researchers agree (Fang et al 2009a; Gupta and fan 2002; Abandes and Alvarez 2003) that in terms of CO2 capture, the utilization
of naturally occurring Ca-based sorbents, such as limestone and dolomite, which are plentiful, cheap, and widely available, are suitable for the CO2
separation process. However, their CO2 capture capacity decreases during
The calcium looping cycle uses CaCO3 as a CO2 carrier via the
reversible reaction:
CaO(s)+CO2(g)⇄CaCO (s)
This extracts CO2 from the exhaust stream and provides a pure stream of
CO2 suitable for sequestration. The decline in sorbent capability during
multiple carbonation-calcination cycles, leading to a loss of reversibility, is a key issue in all such processes. The ultimate utilization determines the sorbent make-up rate required in any commercial plant, heavily influencing the cost of operation (Abanades et al. 2004). Also different applications have been proposed (Johnsen et al. 2006; Han and Harrison 1994; Lin et al. 2001), including CO2 removal from steam reformers,
gasifiers, and water-gas shift reactors where the carbonation reaction can improve hydrogen yields while also providing heat and facilitating CO2
sequestration.
Limestone is one of the highest potential sorbents. Due to its low costs, wide availability, relatively high activity and high temperature requirements which allow heat integration with power plants or heat demanding processes (Romeo et al. 2009). The study of Feng et al. (2007) indicated that limestone also has favorable thermodynamic properties in comparison to other metal oxides.
Stoichiometrically, 56 g of CaO should react with 44 g of CO2 to
form 100 g of CaCO3. This translates to a CO2 capture capacity of about
0.786 g of CO2/g of CaO. However, the performance of all reported
CaO-based absorbents deteriorates as the number of carbonation-decarbonation cycles increases. This is caused by absorbent sintering during the highly exothermic carbonation process. Owing to these facts, enhancing the durability of CaO-based CO2 absorbents has
been an active research topic for many years. As a result two major approaches have been tested: (1) incorporation of inert materials, such as MgO, (Albrecht et al. 2008a; Li et al. 2009) and Al2O3 (Feng et al. 2006;
Li et al. 2006), (2) modification of the stability Lu et al. (2009) and structure of CaO (Gupta and Fan 2002).
1.2 Motivation
Based on the fact that is necessary to find out good absorbents for the CO2 capture, this research is focused on the study of CaCO3
precipitates from sea water for the dry absorption of carbon dioxide as well as finding a method for the production of CaO-MgO sorbents without the problem of loss-in-capacity after multiple carbonation/calcination cycles.
One of the challenges in the development is the prevention of sintering of the sorbent which causes the CO2 capture capacity of the
material to deteriorate rapidly after a few cycles of utilization. In this study a simple mixing method of calcium and magnesium carbonates precipitated from sea water is presented which can be a sintering-resistant sorbent.
The carbonation and calcination processes will be addressed by multi-cycle testing in order to assess the expected sorbent life time using thermo gravimetric analysis (TGA). These sorbents are provided by Power Research Institute, Taiwan Power Company.
1.3 Objectives
The objectives of this study are listed in the following:
1. Determine the suitable conditions for the CO2 absorption process
using CaCO3 precipitates from sea water as a precursor of the CaO
using TGA system.
2. To find a method to produce a CaO/MgO mixed sorbent for enhancing the absorption capacity and improving durability through a calcination/carbonation cycles.
3. To analyze the characteristics of the fresh and regenerated sorbents in order to find the causes of the deterioration of the sorbents.
CHAPTER TWO LITERATURE REVIEW
2.1 System to capture CO2
A wide range of technologies exists for separation and capture of
CO2 from gas streams. Current commercial processes employ a variety of
physical and chemical mechanisms including absorption, adsorption, membranes and cryogenics (Hendriks 1994; Mimura et al. 1997).
The choice of a suitable technology depends upon the characteristics of the CO2-laden gas stream, which in turn depends mainly
on the type of power plant technology. There are four basic systems for capturing CO2 from use of fossil fuels and/or biomass (IPCC 2005) .
• Capture from industrial process streams • Pre-combustion capture
• Post-combustion capture • Oxy-fuel combustion capture
2.1.1 Capture from industrial process streams
Current examples of CO2 capture from process streams are
purification of natural gas and production of hydrogen-containing synthesis gas for the manufacture of ammonia, alcohols and synthetic liquid fuels. Most of the techniques employed for CO2 capture in the
examples mentioned are also similar to those used in pre combustion (IPCC 2005).
2.1.2 Pre combustion capture
The technology for pre-combustion can be widely applied in fertilizer, chemical, gaseous fuel (H2, CH4), and power production. In
these cases, the fossil fuel is partially oxidized, such as in a gasifier. The resulting syngas (CO and H2) is shifted into CO2 and more H2, and then
the resulting CO2 can be captured from a relatively pure exhaust stream.
The H2 can now be used as fuel; the carbon is removed before
combustion takes place.
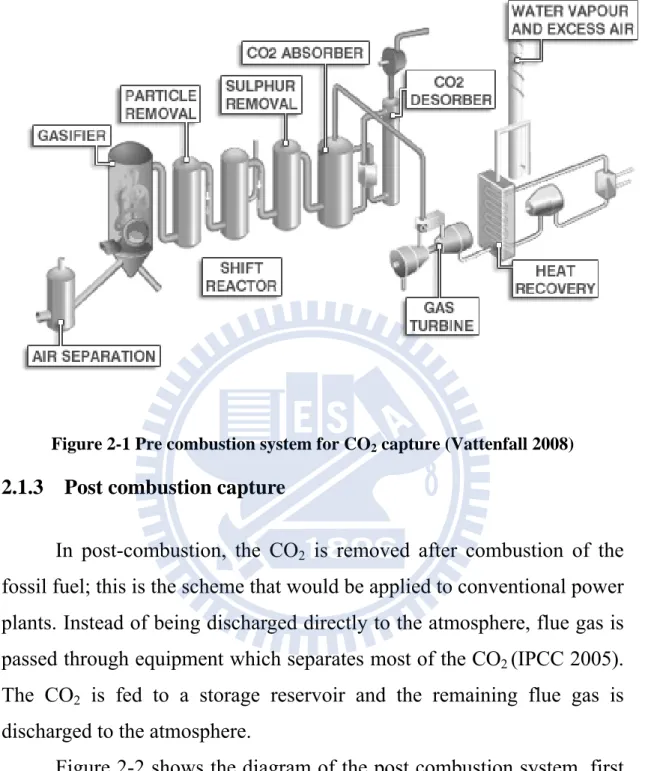
Figure 2-1 shows the pre combustion system, which involves several steps. At the beginning the air separator removes nitrogen from the air that is pumped into the unit, the remaining product is an almost pure stream of oxygen. In the gasifier the coals with oxygen and steam form a "syngas”. Then the syngas is then passes through the first filtering process, where small "fly ash" particles are removed. The shift reactor injects steam, causing a chemical reaction that converts the CO into hydrogen (H2) and carbon dioxide (CO2). Next, sulphur is removed from
the syngas. In CO2 the syngas stream is passed though a CO2 capture
device such as a CO2 absorber, which captures the CO2 from the gas
stream. For CO2 sorbent/solvent processes the sorbent is moved to the
desorber to be "regenerated". Regeneration in the CO2 desorber generally
involves heating the sorbent, which releases the CO2 ready for
compressing and transporting. Once the CO2 has been removed, the
syngas consists primarily of hydrogen. This is then used to power gas turbines to generate electricity. In the heat recovery stage, the excess heat from the combustion of the syngas is captured to generate steam and this in turn is used to power a steam turbine which also generates electricity. At the end of the process, the residual water vapour and air is released into the atmosphere (Miliband 2009).
Figure 2-1 Pre combustion system for CO2 capture (Vattenfall 2008) 2.1.3 Post combustion capture
In post-combustion, the CO2 is removed after combustion of the
fossil fuel; this is the scheme that would be applied to conventional power plants. Instead of being discharged directly to the atmosphere, flue gas is passed through equipment which separates most of the CO2 (IPCC 2005).
The CO2 is fed to a storage reservoir and the remaining flue gas is
discharged to the atmosphere.
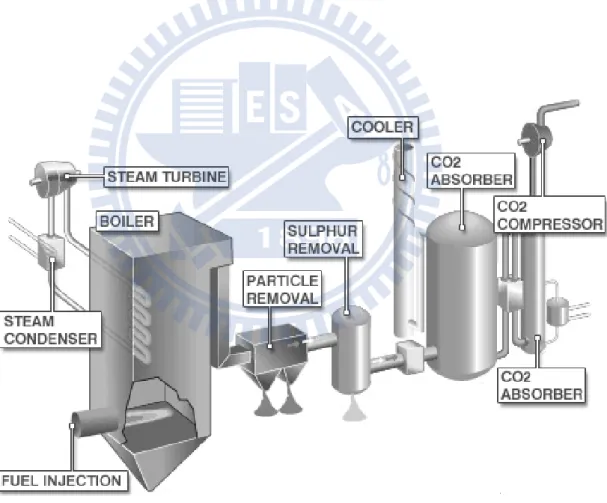
Figure 2-2 shows the diagram of the post combustion system, first in the fuel injection stage, the coal is washed and pulverized before entering into boiler. The heat generated from the combustion of the coal/air mixture in the boiler creates steam, which is then pumped to the turbine. The turbines generate electricity, which is transmitted into the distribution grid. Once the steam has passed through the turbine, it arrives at a condenser, this unit uses cool water to condense the steam back into
water, allowing it to be piped back into the boiler and be re-heated again.
The particle removal is the first of several cleaning processes that the flue gas will pass through. The stage of sulphur removal involves a process called flue gas desulphurization (FGD). Before the flue gas enters the CO2 absorber, it needs to be cooled. In this stage, using water lowers
the temperature of the gas. In the CO2 absorber, the gas stream is passed
though a CO2 captured by a device, typically an absorber, which reacts
with the CO2. Then after purged from the flue gas, the almost pure stream
of CO2 can now be compressed into a liquid state (Miliband 2009).
Figure 2-2 Post combustion system for CO2 capture (Vattenfall 2008)
2.1.4 Oxy fuel combustion capture
In oxy-fuel combustion, nearly pure oxygen is used for combustion instead of air, resulting in a flue gas that is mainly CO2 and H2O. If fuel is
burnt in pure oxygen, the flame temperature is excessively high, but CO2
and/or H2O-rich flue gas can be recycled to the combustor to moderate
this. Oxygen is usually produced by low temperature (cryogenic) air separation and novel techniques to supply oxygen to the fuel, such as membranes and chemical looping cycles are being developed (IPPC 2005).
Figure 2-3 Oxyfuel combustion system for CO2 capture (Vattenfall 2008)
Figure 2-3 shows the oxyfuel combustion system that involves burning the coal in nearly pure oxygen rather than the air/coal mix currently used in conventional power plants.
2.2 Types of CO2 capture technologies
CO2 capture systems use many of the known technologies for gas
separation which are integrated into the basic systems for CO2 capture
(IPCC 2005).
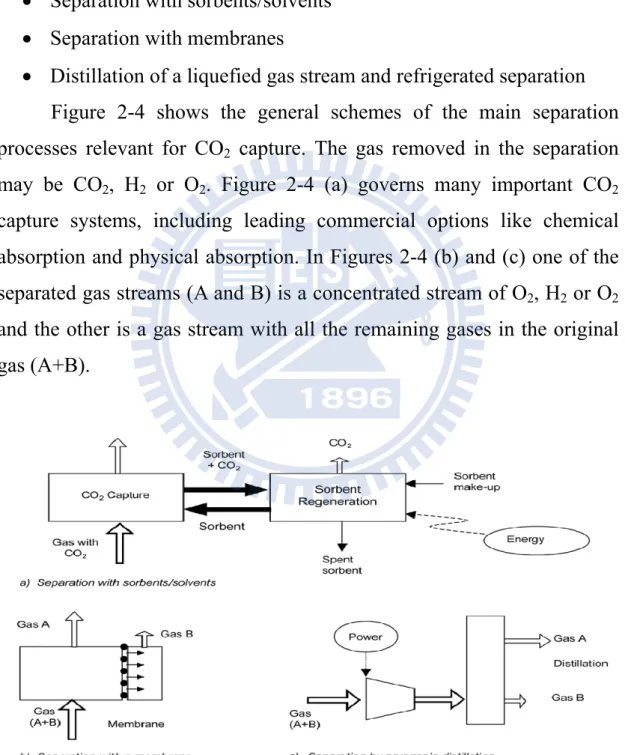
Separation with sorbents/solvents Separation with membranes
Distillation of a liquefied gas stream and refrigerated separation Figure 2-4 shows the general schemes of the main separation processes relevant for CO2 capture. The gas removed in the separation
may be CO2, H2 or O2. Figure 2-4 (a) governs many important CO2
capture systems, including leading commercial options like chemical absorption and physical absorption. In Figures 2-4 (b) and (c) one of the separated gas streams (A and B) is a concentrated stream of O2, H2 or O2
and the other is a gas stream with all the remaining gases in the original gas (A+B).
2.2.1 Separation with sorbents/solvents
The separation process is achieved by passing the CO2-containing
gas in intimate contact with a liquid absorbent or solid sorbent that is capable of capturing the CO2. The sorbent is loaded with the captured
CO2 and it is being transported to a different vessel, where it releases the
CO2 (regeneration) after being heated, after the pressure decrease or after
any other change in the conditions around the sorbent. After the regeneration step the sorbent is sent back to capture more CO2 in a cyclic
process (ICCP 2005). Solvents
Mono-ethanolamine (MEA) is a widely used amine for CO2
capture. CO2 recovery rates of 98% and product purity in excess of
99% can be achieved. Sorbents
Solid adsorbents, such as zeolites and activated carbon, can be used to separate CO2 from gas mixtures. There are various
techniques employed for CO2 separation includes pressure swing
adsorption (PSA), vacuum pressure swing adsorption (VPSA) and thermal (or temperature) swing adsorption (TSA). In PSA, CO2
adsorbed on the surface is released by lowering the bed pressure. In VPSA, vacuum is applied to further pull the CO2 out of the bed.
The regeneration cycles are short (usually requiring a few seconds). In TSA, the saturated bed is heated to release the adsorbed CO2.
2.2.2 Separation with membranes
The membrane gas absorption process makes use of porous, water- repelling membranes for the transfer of components between a gas and a liquid (Gabelman and Hwang 1999). These Components are diffused through the pores and are absorbed by a suitable liquid. In the membrane absorber CO2 is chemically bound in an aqueous solution and it is
removed from the rich solution using thermal regeneration, using strip gas or vacuum. The lean solution is then fed back to the membrane absorber where it is reused.
2.2.3 Distillation of a liquefied gas stream and refrigerated separation
A gas can be made liquid by a series of compression, cooling and expansion steps. Once in liquid form, the components of the gas can be separated in a distillation column. In the case of air, this operation is currently carried out commercially on a large scale (IPCC 2005).
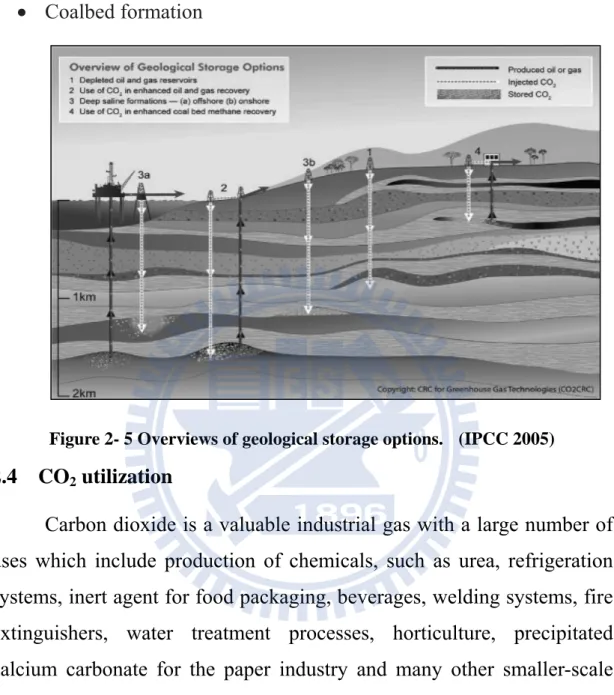
2.3 Modes of CO2 storage
The storage of CO2 can be achieved with different methods, which
include gaseous storage in various deep geological formations, liquid storage in the ocean, and solid storage by reaction of CO2 with metal
oxides to produce stable carbonates as is shown in Figure 2-5.
There are several generic modes of geological CO2 storage, including:
Depleted oil and gas reservoirs Deep saline aquifer formation
Storage in association with CO2 enhanced oil Recovery (EOR)
projects
Coalbed formation
Figure 2- 5 Overviews of geological storage options. (IPCC 2005)
2.4 CO2 utilization
Carbon dioxide is a valuable industrial gas with a large number of uses which include production of chemicals, such as urea, refrigeration systems, inert agent for food packaging, beverages, welding systems, fire extinguishers, water treatment processes, horticulture, precipitated calcium carbonate for the paper industry and many other smaller-scale applications (IPCC 2005).
Much of the carbon dioxide used commercially is recovered from synthetic fertilizer and hydrogen plants, using either a chemical or physical solvent scrubbing system. Other industrial sources of CO2 include the
fermentation of sugar (dextrose) used to produce ethyl alcohol:
2.4.1 New process for CO2 abatement
There are new processes for CO2 abatement which include:
Organic chemicals and polymers
A number of possible new process routes for the production of chemicals and polymers have been considered in which CO2 is
used as a substitute for other C1 building blocks, such as carbon monoxide, methane and methanol.
Fuel production using carbon dioxide
Liquid carbon-based fuels, gasoline and methanol for example, are attractive because of their high energy density and convenience of use, which is founded in part on a well established infrastructure. Carbon dioxide could become the raw material for producing carbon-based fuels with the help of additional energy. Methanol production is an example of the synthesis of liquid fuels from CO2 and hydrogen, the producing reactions which are
exothermic, take place over a copper/zinc/alumina catalyst at about 260°C as is reported by different authors (Inui et al. 1998; Halmann and Steinberg 1999; Arakawa 1988).
2.4.2 Capture of CO2 in biomass (plants and algae)
Biomass production of fuels also falls into the category of generating fuels from CO2. With the help of photosynthesis, solar energy
can convert water and CO2 into energetic organic compounds like starch.
These in turn can be converted into industrial fuels like methane, methanol, hydrogen or biodiesel (Larson 1993).
Biomass also can be produced in natural or agricultural settings, or in industrial settings, where elevated concentrations of CO2 from the
off-gas of a power plant would feed micro-algae designed to convert CO2
into useful chemicals (Benemann 1997).
2.4.3 Mineral carbonation
Mineral carbonation is one of technologies utilizing CO2, used to
form carbonated materials by the reaction between CO2 and Ca or
Mg-bound compounds such as wollastonite (CaSiO3), olivine (Mg2SiO4),
and serpentine (Mg3Si2O5(OH)4) (Maroto et al. 2005). This technology
can be also considered as an accelerated carbonation in terms of making the reaction shorter using high purity CO2. One of advantages of this
technology compared to other CO2 storage technologies is that CO2 is
stably stored in final products such as CaCO3 and MgCO3.
2.5 Carbon dioxide capture sorbents
A variety of materials have been reported (Feng et al. 2007) to be able to absorb CO2. These can be classified as follows:
Microporous and Mesoporous Materials. These include carbon-based sorbents such as activated carbon, carbon fiber, and carbon molecular sieves, zeolites, and chemically or physically modified mesoporous materials such as MCM- 41.
Metal Oxides. Many metal oxides exhibit carbonation and calcination reaction. However, a majority of these metal carbonates are thermally stable and calcined only at higher temperatures. The calcination temperatures of some metal carbonates (CaCO3 ~750
°C, MgCO3 ~385 °C, ZnCO3 ~340 °C, CuCO3 ~290 °C and MnCO3
(Butt et al. 1996). Various metal oxides such as those listed in Table 2-1 have strong affinity to CO2.
Table 2-1 CO2 capacity of metal oxides (Feng et al. 2007)
Metal Oxide CO2 capacity (g of CO2/g of oxide)
Ag2O 0.189 BaO 0.287 CaO 0.785 Cs2O 0.156 K2O 0.468 Li2O 1.471 MgO 1.092 Na2O 0.709 Rb2O 0.235 SrO 0.425 ZnO 0.54
Hydrotalcite-like Compounds. These belong to a large class of anionic and basic clays, also known as layered double hydroxides (LDH). They are composed of positively charged brucite-like (Mg(OH)2) layers with trivalent cations substituting for divalent
cations at the centers of octahedral sites of hydroxide sheet whose vertex contain hydroxide ions, and each -OH group is shared by three octahedral cations and points to the interlayer regions (Feng et al. 2007).
2.6 Absorption system to capture CO2
Reaction-based processes can be used for separating CO2 from flue
gas. This process is based on the carbonation reaction in which gaseous CO2 reacts with a solid metal oxide (represented by MO) to yield the
MO + CO2 MCO3
Once the metal oxide has reached its ultimate conversion, it can be thermally regenerated to the metal oxide and CO2 by heating the metal
carbonate beyond the calcination temperature. The calcination reaction can be represented by
MCO3 MO + CO2
There are two types of adsorption systems determined by IEA (International Energy Agency) that have been widely studied (Gomes and Yee 2002; Takamura et al. 2001; Ishibashi et al. 1996; Diagne et al. 1995) PSA (Pressure Swing Adsorption) and TSA (Temperature Swing Adsorption).
In the PSA process, CO2 gases are captured at higher pressure and
released at lower pressure, this technology requires a vacuum unit for regeneration. Similarly, TSA process adsorbed CO2 at lower temperature
and desorbed by heating. One important economical factor in these technologies is strongly related to the ultimate adsorption capacity of the solvent/sorbent (quantified by kg CO2/ton solvent or sorbent) and kinetics
of the adsorption process. Higher equilibrium capacities allow lower sorbent/solvent requirement and handling; lower regeneration costs and therefore lower capital and operating cost.
2.7 Carbonation and calcination cycles in the CaO-CO2 absorption process
Calcined lime (main component, CaO) can be used to capture CO2
in the exhaust gas or in the reactor during the utilization of fossil fuels (Wang et al. 2009). That is, calcium oxide (CaO) absorbs CO2 to yield
calcium carbonate (CaCO3), and the CaCO3 is then thermally decomposed
to CaO, releasing nearly pure CO2 for sequestration. In fact, the heat for
decomposing CaCO3 can be supplied by combusting fossil fuels, such as
coal and natural gas, in a calciner. These two reactions are showed as follow:
CaO(s) +CO2 (g) →CaCO3(s) ∆H0 298=−178 kJ/mol
CaCO3(s) →CaO(s) + CO2 (g) ∆H0 298=178 kJ/mol
Specifying the conditions for a carbonation step must strike a balance between high temperatures which favor the speed of reaction, and low temperatures which favor the equilibrium conversion. Barker (1973) found that the carbonation reaction took place in two stages; an initial rapid rate was followed by a slower approach to a conversion plateau.
Both the limestone and dolomite react with CO2 in these two stages.
The initial carbonation stage is kinetically controlled with a fast reaction rate between CaO and CO2. At this stage, the outlet CO2 concentrations
are not higher than 3% for a stable absorption period. After the stable absorption period, CO2 concentrations abruptly increased and then
increased very slowly, indicating that the CO2 capture capacity of the
CaO was nearly exhausted. Owing that large part of active CaO was converted to CaCO3 and the carbonation stage moved to the second stage
the latter and slower stage of the reaction, it was found that CO2
concentration does not affect the rate of the reaction if it is maintained much higher than the corresponding equilibrium concentration for that temperature.
Abanades and Alvarez (2003) reported that the maximum carbonation conversion decreased during the carbonation/calcination cycles due to the loss in the porosity associated with the small pores and the increase in the porosity associated with the large pores. The formation of a larger volume molar product (CaCO3) compared to CaO led to the
plugging of these pores thereby causing a loss in the active surface area. Figure 2-6 shows the concept of pore filling and plugging at the pore-mouths of these sorbent particles by CaCO3 product layer,
preventing the access of CO2 to un-reacted CaO at the pore interiors.
Figure 2-6 Non-reacted and reacted particle of CaCO3 (Hassanzadeh and
Abbasian2010)
The calcination reaction is favored by higher temperatures. The reactions proceed only if the partial pressure of CO2 in the gas above the
solid surface is less than the decomposition pressure of the CaCO3. The
latter pressure is determined by equilibrium thermodynamic considerations (Stanmore and Gilot 2005). A typical expression for equilibrium decomposition pressure Peq (Silcox et al. 1989) is:
Peq 4.137 10 e T atm
Figure 2-7 plots three of the expressions listed in the literature; the agreement is good except at lower temperatures. (Silcox et al. 1989; Hu and Scaroni 1996; Hartman and Tmka 2003).
Figure 2-7 Decomposition pressure of carbon dioxide over calcium carbonate (Stanmore and Gilot 2005)
2.8 Sorbent deactivation
After the reaction of CaO with CO2, the product CaCO3 must
undergo calcination to regenerate CaO for repeated use (Fang et al. 2009). In the calcination process, some pores are produced inside the CaO particle but, at the same time, CaO sintering occurs because of the high calcination temperature, which reduces the surface area and porosity with an increasing residence time. These two factors are very important for the reaction of CaO with CO2, but sintering sharply reduces surface area and
porosity, which strongly affects the CO2 capture capacity and the reaction
rates of CaO with CO2. As the number of carbonation/calcination
sorbents already approach their lowest ultimate conversion, degradation is found to be more severe under more highly sintering calcination conditions at higher temperatures, higher residence times, higher partial pressures of CO2 and H2O. Abanades and Alvarez (2003) indicated that
for limestones, it appears that the reaction ceases when the product has built up to a depth of 50 nm, averaged across the total surface area. Thus, the loss of surface area by sintering is a further contributing factor in the fall in sorbent capacity. However, there is still controversy surrounding the exact mechanism of deactivation. Also Abanades et al. (2007) mentioned that the surface texture of cycled limestone commonly features shrinkage of smaller pores, usually accompanied by growing macro pores. These trends are typical of solid-state sintering in an intermediate stage (Randall and German 1996) in which vacancies (or voids) generated by temperature-and-ion-sensitive lattice defects direct void volume from smaller to larger pores, whereas mass moves in the opposite direction.
2.9 Cost assessments
Freund (2003) estimated the costs for CO2 transportation $1–$3/ t
/100 km and sequestration ($4–$8)/t CO2, these costs are small compared
to the cost for CO2 capture, estimated at $35– $55/t CO2 capture
(Abanades and Alvarez 2003). Singh (2003) indicated that the high cost of CO2 capture is due to the considerable amount of energy required in the
separation process. Therefore, reducing the cost of CO2 capture is
absolutely necessary to make CCS more economically attractive. However, the cost of sorbent must also be considered. Costs of limestone and dolomite are $26.7/ t and $30/ t, respectively (U.S. GPO 2005). Manovic and Anthony (2008) cited that synthesized sorbent with high performance and low cost would be highly beneficial for the CO2 capture
process using the carbonation/calcination cycle.
2.10 Magnesium carbonate
The reversible chemical reaction for CO2 removal involving
magnesium oxide is:
MgO + CO2 ↔ MgCO3 ∆H≈-96 kJ/mol
Some reports suggest that high CO2 absorption is possible only by
chemisorptions of carbon dioxide molecules with metal oxide at higher temperatures (Song et al. 1998). However Bhagiyalakshmi et al. (2010) found that the mesoporous MgO is highly basic with well-ordered pores to hold high CO2 at lower and higher temperatures. The large surface
active sites of mesoporous MgO initially holds the CO2 molecules with
smaller affinity and are trapped into the pores by chemical reaction of MgO and CO2 to form MgCO3. It has been shown (Hassanzadeh and
Abbasian 2010) that the behavior of these materials is related to their lattice structure.
When the solid is porous in nature, the gaseous reactant diffuses into the interior pores of the particles and reacts with the active solid species at the surface of the pores. This can be described by the grain model, in which the solid particle is treated as an assemblage of numerous smaller grains. Surrounding these grains are macro-pores through which the gas has to diffuse to reach the grains. The reaction occurs at the surface of each grain, according to the un-reacted shrinking core model. As the reaction proceeds, the difference in the molar volumes of the solid product and the molar volume of the reactant results in an increase in the grain size. This decreases the pore volume between the grains, and also decreases the diffusion rate of the gaseous reactant through the sorbent particles.
At temperatures below the equilibrium temperature for carbonation of magnesium oxide (i.e. between 300 and 450 °C), the reactivity of the sorbent improves with increasing temperature, while at a higher temperature (i.e., 500 °C), because of the significant increase in the rate of reverse (i.e., regeneration) reaction, a decline in the sorbent reactivity is observed (Hassanzadeh and Abbasian 2010).
2.11 CaO sorbents mixed with other metals
It is believed that the capacity decay in CO2 absorption process is
mainly owing to the sintering of CaO and CaCO3 (formed during
carbonation) in the regeneration process, or the physical aggregation of the crystals leading to increased particle size, or reduced surface area of the produced CaO for the carbonation reaction in the next cycle. In order
to address this loss-in-capacity, many methods have been tested with varying degrees of success (Liu et al. 2010).
It has been reported (Li et al. 2009) that the method of incorporating the inert materials as MgO has a critical effect on the long term stability of the CaO-based absorbent. The investigation of Albrecht et al. (2008a) also showed that the rate of decline in CaO activity can be reduced by incorporating finely dispersed MgO in the sorbent. The absorption capacity of a limestone-based sorbent with 20 wt % MgO was 45% greater than that of a similar material without MgO by the end of the test, and the rate of decline in absorption capacity was very small.
In the study of Liu et al. (2010) a mixture of CaO and MgO was formed, in which during the regeneration of the CaO sorbent at 900 °C, the MgO particles, with a sintering temperature of 1289 °C, act as a physical barrier to prevent the sintering and aggregation of the CaCO3
nano particles, which typically sinter at 527 °C. Therefore the high CO2
capture capacity of the sorbent is maintained over a multitude of carbonation- regeneration cycles.
Chrissafis and Paraskevopoulos (2005) indicated that the degrading performance of CaO in cycles was mainly due to sintering, and by mixing high melting point compounds, such as Al2O3 or MgO,
sintering may be inhibited to some extent. Li et al. (2009) reported a type of stable MgO-doped CaO absorbent, produced by mechanical mixing of small MgO particles with Ca(CH3COO)2, followed by high
temperature calcination, gives as high as 53 wt % CO2 capacity after 50
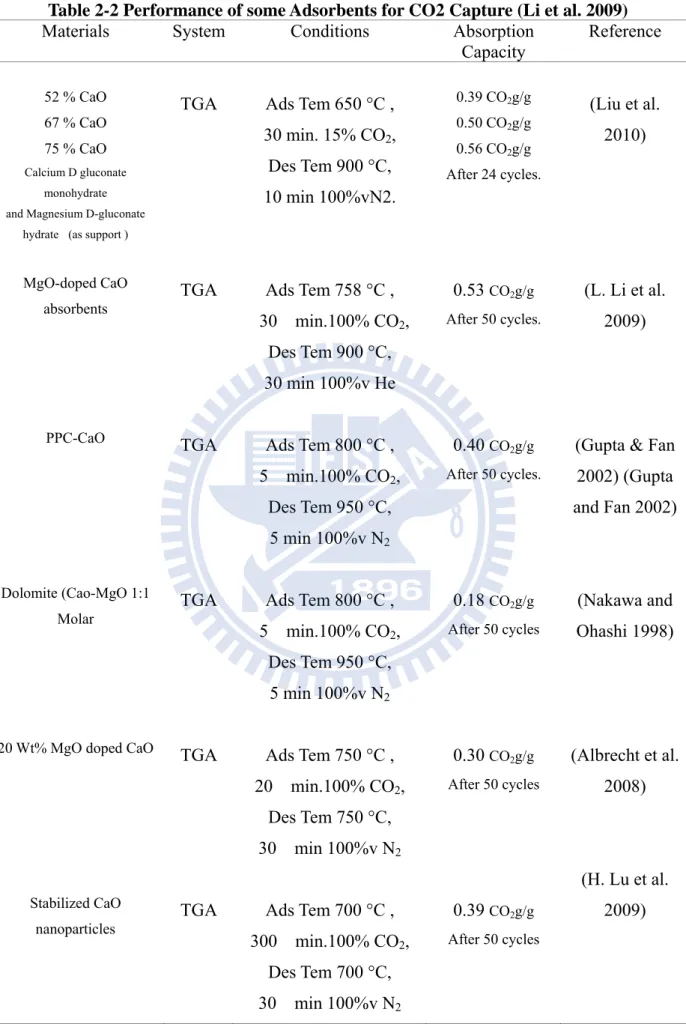
carbonation/decarbonation cycles. But without MgO addition the absorption capacity decrease to 26wt% for the 50th cycle under the same conditions. Some studies related to the enhancement of the sorbent for carbonation/calcination cycles can be found in Table 2-2.
Table 2-2 Performance of some Adsorbents for CO2 Capture (Li et al. 2009)
Materials System Conditions Absorption
Capacity Reference 52 % CaO 67 % CaO 75 % CaO Calcium D gluconate monohydrate and Magnesium D-gluconate
hydrate (as support )
TGA Ads Tem 650 °C , 30 min. 15% CO2, Des Tem 900 °C, 10 min 100%vN2. 0.39 CO2g/g 0.50 CO2g/g 0.56 CO2g/g After 24 cycles. (Liu et al. 2010) MgO-doped CaO
absorbents TGA Ads Tem 758 °C ,
30 min.100% CO2, Des Tem 900 °C, 30 min 100%v He 0.53 CO2g/g After 50 cycles. (L. Li et al. 2009)
PPC-CaO TGA Ads Tem 800 °C ,
5 min.100% CO2, Des Tem 950 °C, 5 min 100%v N2
0.40 CO2g/g
After 50 cycles.
(Gupta & Fan 2002) (Gupta and Fan 2002)
Dolomite (Cao-MgO 1:1 Molar
TGA Ads Tem 800 °C , 5 min.100% CO2, Des Tem 950 °C, 5 min 100%v N2 0.18 CO2g/g After 50 cycles (Nakawa and Ohashi 1998)
20 Wt% MgO doped CaO TGA Ads Tem 750 °C ,
20 min.100% CO2, Des Tem 750 °C, 30 min 100%v N2 0.30 CO2g/g After 50 cycles (Albrecht et al. 2008) Stabilized CaO
nanoparticles TGA Ads Tem 700 °C ,
300 min.100% CO2, Des Tem 700 °C, 30 min 100%v N2 0.39 CO2g/g After 50 cycles (H. Lu et al. 2009)
CHAPTER THREE EXPERIMENTAL
METHOD
3.1 Procedure and method
There are several parts involved in the operation of the experimental study: sorbent preparation, characterization of the samples, CO2 sorption/desorption condition and systems procedures. Figure 3-1
shows the flow chart of this work.
3.2 Sorbent preparation technique
The sea water precipitated CaCO3 and MgCO3 sorbents were
obtained from Power Research Institute, Taiwan (PRIT). A method permitting a selected production of calcium carbonate and magnesium carbonate precipitates was developed (Lan and Hong 2005) for the fixation of carbon dioxide by chemical precipitation it is described briefly as follows:
50 ml of 4 M sodium hydroxide solution and 20 ml of 2 M sodium carbonate solution were added to 1.8 L of sea water in a 2L flask. This mixture was magnetically stirred for about 30 min then allowed to settle for 4 hr. After that, three fourths of the supernatant sea water was considered to be provided by directly injecting carbon dioxide into the resulting sea water a flow rate of 1L/min for 48 hours. Sufficient amount of carbon dioxide was considered to provide by directly injecting carbon dioxide into the resulting sea water at flow rate of 1.0 L per minute for 48hrs. In this instance, calcium carbonate precipitates could be
exclusively separated from the suspended sea water by 0.45um membrane filtration. Magnesium carbonates precipitates, were produced by complete drying of the filtrate sea water, rinsed with de ionized water and dried.
Calcium and Magnesium Carbonate mixture
The mixture of calcium and magnesium carbonate for the production of an anti-sintering sorbent were prepared by the following procedure based on the study of Chen (2009). Appropriate amounts of calcium carbonate and magnesium carbonate were mixed with distilled water and methanol. The purpose of adding methanol was to dissolve the magnesium carbonate for better mixing.
The above mixture was vigorously stirred for 1 hour at 75oC, and then dried at 110oC overnight. After drying, the sample was ground into a fine powder.
3.3 Characterization
Characterization of CaCO3 and MgCO3 were done by XRD, SEM,
ICP-MS and BET surface area measurements. These tests were performed in order to study the chemical and physical composition, and the morphology of the samples.
X-ray Powder Diffractometer (XRPD)
CaCO3 and MgCO3 were characterized by X-ray diffraction
(XRD) patterns on a D/MAX-RB diffract meter using Cu KR radiation (λ) 1.5406 Å. The operating conditions are at an emission voltage of 30 kV, and an emission current of 20 mA. XRPD patterns were obtained for crystalline phase detection between 10 and 70° (2θ).
BET surface area
BET surface area and pore size distribution measurements were performed using nitrogen adsorption and desorption isotherms on a Micromeritics ASAP 2000 volumetric adsorption analyzer. The CaCO3 and MgCO3 sorbents were degassed at 350 °C at a pressure of
10-6m bar for at least 8 hr. in the degassing port of the apparatus before the actual measurements. The pore size distribution measurements were obtained using the BJH method.
Scanning Electron Microscope (SEM)
The morphology of the products was observed on a Hitachi S-4700 scanning electron microscope (SEM) with 15 keV of acceleration. The samples were prepared by placing the sorbents on double-sided carbon tape mounted on the sample holder.
3.4 Equipment and chemicals component
1. CO2 analyzer (AGM4000-1-2-2) Zhi Shang instrument, Taiwan.
Reaction time: T90/45, Lower Detection Limit: 1%. Sample Flow Rate: 120cc/min, Linearity Error < 2%.
2. Furnace: Thermolyne, 1400, USA
3. Magnetic stirrer: Cimares2, Thermolyne, Lowa, USA 4. Sieve: 16-30 mesh, Zhong Xin, Taiwan
5. Nitrogen (N2) gas cylinder: 99%, Taiwan chiah lung company
6. Carbon dioxide gas cylinder: 20% CO2/N2, Taiwan chiah lung
company
7. Air gas cylinder: Taiwan chiah lung company
8. CaCO3 and MgCO3 :Power Research Institute , Taiwan Power
Company
9. Methanol: You He company 10. Limestone: Hualien, Taiwan
3.5 Experimental apparatus TGA system
A thermo gravimetric analysis (TGA) (TG 209 F1, NETZSCH, Germany) was used to obtain the CO2 absorbed amount.
The TGA consists of an electronic balance, vertical furnace, reactor tube, a carrier gas system, and computerized data acquisition system. The crucible is made of Al2O3. A schematic diagram of the TGA
Figure 3-3 Schematic of TGA system for absorption
The two chemical reactions occurring during the cyclic test are:
Carbonation: CaO(s) + CO2(g) CaCO3 (s)
Calcination: CaCO3(s) CaO(s) + CO2 (g)
A small amount of the sample (25-30mg) was placed in the crucible; the gas flow rate was 20 ml/min for a typical run the temperature was brought at 850°C for calcination at rate of 40oC/min. After complete calcination, the temperature was decreased at a rate of 60 °C/min to the carbonation temperature. When approaching the carbonation temperature the valve was switched to allow the gas mixture of CO2 with an inlet concentration of 20 vol% (N2 balance) to flow over
the calcined absorbent.
The conditions for TGA experiments are described in Table 3-1. Sorbent
Table 3-1 Typical test condition for the cyclic test of carbon dioxide capture using TGA
Experimental parameters Conditions
Weight of the sample 25~30 mg
Absorption cycle conditions 650-730℃, 20% CO2/N2, 10min Desorption cycle conditions
850℃, pure N2, 1min
Heating rate 40℃/min, pure N2
Cooling rate -60℃/min, pure N2
Flow rate 20ccm
In order to find the optimal condition for the CO2 capture, different
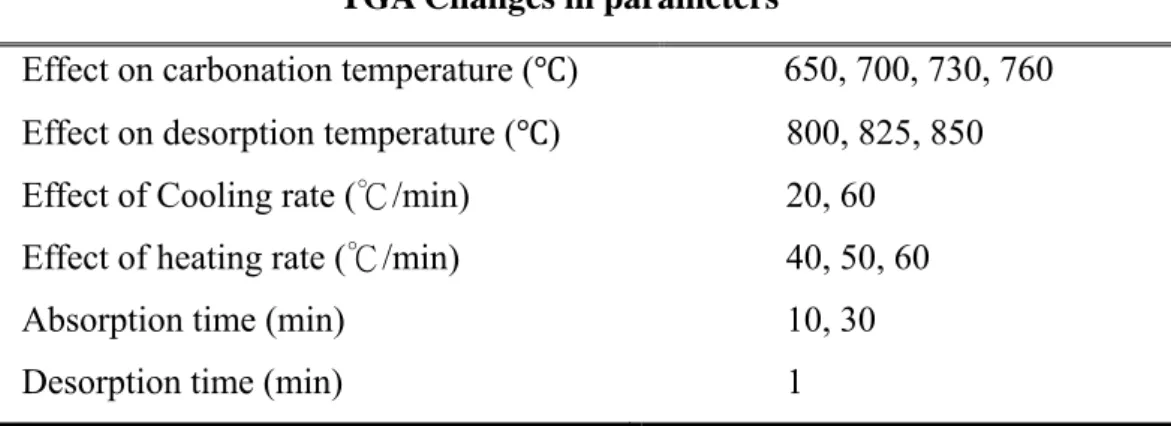
parameters were also tested. Table 3-2 shows the changes in carbonation, calcination temperature, the effect of the cooling and heating rate.
Table 3-2 Change in parameters for finding the optimal conditions for the carbon dioxide capture using TGA
TGA Changes in parameters
Effect on carbonation temperature ( ) 650, 700, 730, 760 Effect on desorption temperature ( ) 800, 825, 850
Effect of Cooling rate (℃/min) 20, 60
Effect of heating rate (℃/min) 40, 50, 60
Absorption time (min) 10, 30
Desorption time (min) 1
3.6 Packed column test system
Packed column tests were also performed to evaluate the cyclic CO2 capture efficiency and its corresponding CO2 absorbed amount as
well. The CO2 capture efficiency was calculated using the following
equation:
CO2 capture efficiency = 1 - C1/ C0,
Where C1 is the CO2 outlet concentration and C0 is the CO2 inlet
concentration.
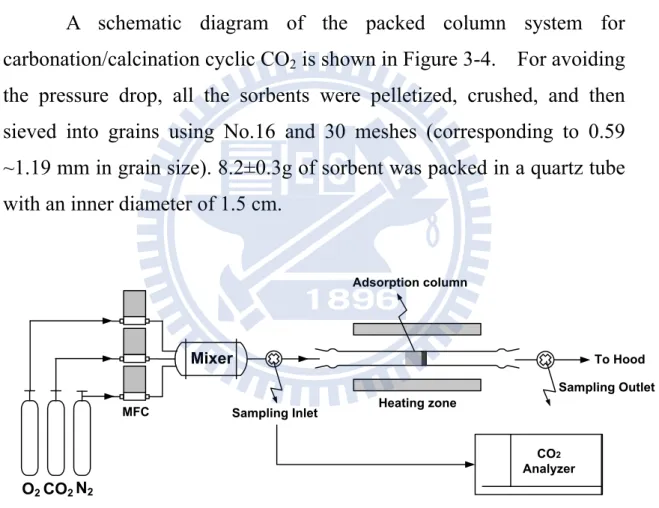
A schematic diagram of the packed column system for carbonation/calcination cyclic CO2 is shown in Figure 3-4. For avoiding
the pressure drop, all the sorbents were pelletized, crushed, and then sieved into grains using No.16 and 30 meshes (corresponding to 0.59 ~1.19 mm in grain size). 8.2±0.3g of sorbent was packed in a quartz tube with an inner diameter of 1.5 cm.
Figure 3-4 Schematic of packed column system for absorption
Before absorption, the sorbents were pretreated under N2 flow at
850oC for 1 hour, and then the temperature was decreased to 700oC for carbonation with CO2 inlet concentration of 15 vol. % (balanced with 6 %
O2 and 79 % N2). The carbonation time was 10 min. After carbonation,
the column temperature was increased to 850oC and kept for 30 min
N2 O2CO2 Mixer Adsorption column Sampling Inlet Sampling Outlet To Hood MFC Heating zone CO2 Analyzer
under N2 flow to release CO2, and then the temperature was decreased to
700oC again for the cyclic test.
The total gas flow rate was 500 ml/min (at 1 atm, 25°C) for both carbonation and calcination processes, which corresponded to an empty-bed gas residence time of around 0.36 s at absorption temperature of 700oC. The inlet and outlet concentrations of CO2 were continually
measured by a CO2 analyzer system (AGM$000-2000-1-2-1).
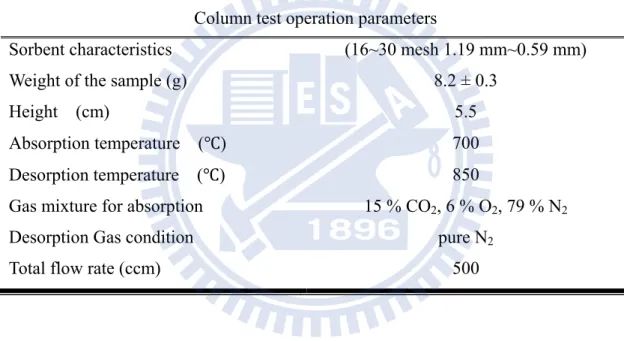
Table 3-3 shows the conditions for the packed column test
Table 3-3 Test condition for the carbon dioxide capture using packed column
Column test operation parameters
Sorbent characteristics (16~30 mesh 1.19 mm~0.59 mm)
Weight of the sample (g) 8.2 ± 0.3
Height (cm) 5.5
Absorption temperature ( ) 700
Desorption temperature ( ) 850
Gas mixture for absorption 15 % CO2, 6 % O2, 79 % N2
Desorption Gas condition pure N2
CHAPTER FOUR RESULTS AND
DISCUSSION
4.1 Characterization
The sea water precipitated CaCO3 and MgCO3 were characterized
by XRD, SEM, and BET surface area measurements, in order to find out the chemical and physical composition, as well as the morphology of the test samples.
4.1.1 X-ray diffraction (XRD).
XRD is a non-destructive analytical technique that reveals information about the crystallographic structure, chemical composition, and physical properties of materials. Figure 4-1 shows the X-ray diffraction pattern of the CaCO3, and MgCO3 precipitates fresh samples
and the CaO-MgO mixture sorbent after the carbonation and calcination cycle test. According to the JCPDS File No. 76-0606, the major diffraction peak of the CaCO3 precipitates appears at 2θ of 29.4°. It can
be observed that CaCO3 is considered to be the main constituent of the
calcium carbonate precipitates.
According to the index JCPDS File No. 08-0479, the major diffraction peaks of the MgCO3 precipitates appear at 2θ of 30.90° and
41.92 °. As can be seen from these results, the mixed compounds of hydromagnesite (Mg5(CO3)4(OH)2.4H2O) and dypingite
(Mg5(CO3)4(OH)2 •5H2O) are considered to be the potentially main
constituents of the precipitated magnesium carbonates (Botha and Strydom 2001).
A similar XRD pattern for the mixture of CaO-MgO can be also observed in the study of Liu et al. (2010)
Figure 4-1 XRD of the calcium carbonate, magnesium carbonate precipitates fresh sample and CaO-MgO mixture sorbent after carbonation/calcination
4.1.2 ICP-MS analysis
Trace metallic impurities in this compound were determined using an inductively coupled plasma mass spectrometer (ICP-MS). According to the results, 79 wt% of calcium and a 21 wt% of magnesium are present in the sample of CaCO3 sea water precipitates. For the case of the MgCO3
sea water precipitates the 99.5wt% of Mg and 0.45wt% of Ca are present in the MgCO3. The date indicated a corresponding 55 wt % of CaCO3.
21wt% MgCO3 and the remaining 24% of impurities in the CaCO3
precipitates sea water sample. And an almost pure sample of MgCO3 sea
water precipitates. Concentration of metallic impurities found in weight percent and ppm level are present in Table 4-1
Table 4-1 Concentration for metallic impurities in CaCO3 and MgCO3 sea water
precipitates by ICP-MS CaCO3 ppm % MgCO3 ppm % Na 4880.0 Na 10423 Mg 5.88 Mg 29.07 Al 43.26 Al 164.0 Ca 22.06 Ca 0.13 Cu 35.60 Cu 14 Zn 171.3 Zn 86.21 Sr 3447 Sr 24.58 Pb 7.960 Pb 1.588 K 1199 Si 3130
4.1.3 BET surface area analysis
One of the most important absorbent properties is the pore size and pore size distribution. Figure 4-2 (a) shows the pore size distribution curve for calcium carbonate composite treated by the precipitation process; it was found a pore size of 8.43 nm for the fresh sample. Figure 4-2(b) shows the pore size distribution curve for the Magnesium carbonate composite treated by the precipitation process, it was found a pore sized of 5.14 nm for the fresh sample. Figure 4-2(c) shows the pore size distribution curve for the CaO sorbent after, it was found a pore sized of 7.8 nm. Figure 4-2(d) shows the pore size distribution curve for the CaO-MgO mixture sorbent, it was found a pore sized of 7.6 nm for the fresh sample.
Table 4-2 shows the surface area and pore volume of the CaCO3 and
MgCO3 fresh sample, CaO and CaO-Mixture sorbent after 10 carbonation
and calcination cycle test. It can be observed that after the cycles the CaO surface are slightly decrease, and the CaO-MgO mixture sorbent the surface area is increased compare to the pure CaCO3.
Table 4-2 CaCO3 and MgCO3 precipitates from sea water fresh sample, CaO and
CaO-MgO mixture sorbent after carbonation/calcination cycles surface area and pore volume
Sample Cyclic no. S BET (m2/g) Vm (cm3/g)
CaCO3 fresh 17.00 0.03
MgCO3 fresh 93.80 0.11
CaO 10 15.66 0.03
Figure 4- 2 (a) Pore size distribution CaCO3 precipitates from sea water
Figure 4-2 (b) Pore size distribution MgCO3 precipitates from sea water
0 0.0005 0.001 0.0015 0.002 0.0025 0.003 0.0035 0.004 0.0045 10 60 110 160 210 260 310 360 410 460 Po re vo lu m e cm 3/g * Å Pore Diameter (Å) 0 0.0005 0.001 0.0015 0.002 0.0025 0.003 0.0035 0.004 0.0045 10 30 50 70 90 Po re Vo lu m e (cm³ /g ∙Å) Pore Diameter (Å) 0 0.0005 0.001 0.0015 0.002 0.0025 0.003 0.0035 0.004 0.0045 10 60 110 160 210 260 310 360 410 460 Po re Vo lu m e (cm³ /g ∙Å) Pore Diameter (Å)
0 0.0002 0.0004 0.0006 0.0008 0.001 0 100 200 300 400 500 Pore Volume (Cm 3/g*Å) Pore Diameter (Å) CaO 0 0.0002 0.0004 0.0006 0.0008 0.001 0.0012 0.0014 0.0016 0.0018 0.002 0 100 200 300 400 500 Pore volume (cm 3/g*Å) Pore Diameter (Å) CaO‐MgO
Figure 4-2 (c) Pore size distribution CaO after carbonation/calcination cycles
Figure 4-2 (d) Pore size distribution CaO-MgO after carbonation/calcination cycles
4.2 CO2 absorption temperature range
The determination of an adequate temperature range for carbonation plays an important role in the CO2 absorption process due to
that the rate of reaction is sensitive to temperature. It is also of great importance to determine if an increase or decrease in temperature has an impact on the deterioration of the sorbent over repeated calcination/carbonation cycles.
4.2.1 Determination of the optimal absorption temperature
Figure 4-3(a) shows the CO2 absorbed amount curve, in which the
CO2 was allowed to pass from 850°C to 25°C. In order to find the
maximum temperature at which the reaction between the CaO and the CO2 starts to occur. It can be observed from Figure 4-3(b) at 773°C the
absorption process started with a very slow rate. Between 750°C and 700°C the absorption rate increases fast at rate of 0.076 (g/g-min) then between 700°C and 682°C, the reaction rate start to decrease, after 682°C the sorbent get saturated and the reaction rate is too low. Figure 4-4 (a) the absorption process was reversed by passing the CO2 from 25 °C to
850 °C so the minimum required temperature for the CO2 absorption can
be determined. The absorption initially occurs at around 500 °C with a slow rate, it gradually increases until the highest absorption rate of 0.015 (g/g-min) was achieved at 773°C, this can be observe in Figure 4-4 (b). This is in agreement with Hughes et al. (2004) who found that temperatures below 650°C led to reaction rates too low to achieve high CO2 absorption capacity. Similarly Sillaban and Harrison (2005) found a
limitation in carbonation temperature bellow 778°C. Reasonable agreement was found in Symonds et al. (2009) study which indicates that at temperature below 580°C would result in extremely slow rates of
0 0.05 0.1 0.15 0.2 0.25 50 150 250 350 450 550 650 750 850 Ab sr obed amoun t (g CO 2 /g sorben t) Temperature °C 850 to 20 at 20 C/min 0 0.01 0.02 0.03 0.04 0.05 0.06 0.07 0.08 0.09 0 100 200 300 400 500 600 700 800 Ab sorp tion Ra te ( ∆ g/ g‐ ∆ t)) Temperature °C 850 to 20 20C/min 700°C 682°C
carbonation not applicable for effective CO2 removal.
Figure 4-3 (a) CO2 absorption curve. Decreasing temperature from 850°C to 20°C
at 20°C/min
Figure 4-3 (b) CO2 Absorption rate curve. Decreasing temperature from 850°C to
20°C at 20°C /min
0 0.05 0.1 0.15 0.2 0.25 50 150 250 350 450 550 650 750 850 950 CO 2 Ab sorbed amoun t (g CO 2 /g sorben t) Temperature C° 20 to 850 at 20 C/min 773°C 0 0.002 0.004 0.006 0.008 0.01 0.012 0.014 0.016 0.018 50 150 250 350 450 550 650 750 850 950 Ab sorp tion Ra te ( ∆ g/g-∆ t) Temperature °C 20 to 850C 20C/min 773°C
Figure 4-4 (a) CO2 absorption curve. Increasing temperature from 20°C to 850°C
at 20°C /min
Figure 4-4 (b) CO2 Absorption rate curve. Increasing temperature from 20°C to
0 0.05 0.1 0.15 0.2 0.25 0 200 400 600 800 Ab sorbed amoun t (g CO 2 /g Sorben t) Temperature °C 850 to 20 10 C/min 850 to 20 20 C/min 850 to 20 60 C/min
4.2.2 Effect of the cooling rate to determinate the optimal absorption temperature
To study the effect of cooling rate on the optimal absorption range for the CO2 capture, the CO2 was allowed to pass from 850 °C to room
temperature; three different cooling rates were tested, at 10, 20, and 60°C /min. The results are shown in Figure 4-5(a) and Figure 4-5 (b). It is found that the optimal absorption range shift to lower temperature value as the cooling rate is increasing. It can be observed respectively at 60°C /min and 10°C /min cooling rate, the absorption rate is too low for temperature below 622°C and above 760°C, also the CO2 absorbed
amount is higher as the cooling rate is slower. Based on the minimum and maximum temperature, four temperatures were chosen for carbonation runs. These temperatures were 650°C, 700°C, 730°C and 760 °C.
Figure 4-5 (a) CO2 absorption curve. Effect of cooling rate at 10° C/min, 20°
0 0.01 0.02 0.03 0.04 0.05 0.06 0.07 0.08 0.09 50 150 250 350 450 550 650 750 850 Desorp tion Ra te ( ∆ g/ g‐ ∆ t) Temperature °C 850 to 20 10 C/min 850 to 20 20C/min 850 to 20 60 C/min 760°C 622°C
Figure 4-5 (b) Desorption rate curves at different cooling rates.
4.3 Desorption temperature
Calcination was carried out by TGA tested at three temperatures, namely 800°C, 825°C, and 850°C, and carbonation was carried out for 10 min at 700°C for 2 cycles, in order to obtain an adequate desorption temperature.
Figure 4-6 (a) shows that at 800°C the desorption rate is too low and is not complete. Addionally at temperatures 825°C and 850 °C, complete calcination was achieved in matter of minutes, with a faster desorption rate at 850°C. In Figure 4-6 (b) it can be seen that in terms of absorbed amount both 825°C and 850°C are quite similar absorbed amount.
‐0.2 ‐0.18 ‐0.16 ‐0.14 ‐0.12 ‐0.1 ‐0.08 ‐0.06 ‐0.04 ‐0.02 0 0 1 2 3 4 5 6 7 8 9 10 Desorp tion Ra te ( ∆ g/ g‐ ∆ t) Time (min) 850 C 825 C 800 C
Base on the previous results and other studies such as Li et al. (2006) where 850°C is considered a mild calcination temperature and higher than 950°C is considered a severe calcination, the desorption temperature of 850°C was chosen. Also in the study Grasa and Abanades (2006) has shown the effect of calcination temperature on the sorbent performance up to a maximum temperature of 1000°C. In a range of temperature up to 950°C the calcination temperatures did not affect the sorbent performance significantly and at lower calcination temperatures only a modest improvement in the results of the absorbed amount. But at 1000°C calcination temperature was a deterioration of the sorbent was observed.
Figure 4-6 (a) CO2 desorption rate. At 800°C, 825°C and 850 °C
0 0.05 0.1 0.15 0.2 0.25 0.3 0 5 10 15 20 25 30 35 40 Ab sorbed amoun t (C O2 g/ So rb e n t g) time (min) at 850 C at 825 C at 800 C CO2 CO2 N2 N2
Figure 4-6 (b) CO2 absorption curves at 800°C, 825 °C, and 850°C desorption
temperatures. The carbonation temperature 700°C
4.4 CO2 absorption at constant absorption temperatures
In order to study the effect of absorption temperature on the absorbed amount and absorption rate, four different temperatures based on the results of the absorption range for carbonation were chosen, being these 650°C, 700°C, 730°C and 760°C. The carbonation time was kept constant for 30 min and the desorption time was 10 min at 850°C. The results are shown in Figure 4-7 (a) for the absorbent amount and Figure 4-7 (b) for the absorption rate.
The carbonation temperature has a strong effect on the carbonation reactions of CaO as is mentioned by abanadez and Alvares (2003). Figure 4-7(a) shows that at a low temperature of 650°C or a high temperature of 760°C either the absorbed amount or absorption rates are not beneficial
0 0.05 0.1 0.15 0.2 0.25 0.3 0.35 0 5 10 15 20 25 30 Ab sorbed amoun t (g CO 2 / g Sorben t) Time (min) 650 C 700 C 730 C 760 C
for the absorption process compared to the absorbed amount at 700°C and 730°C. Figure 4-7 (b) shows the absorption rate that at 760 °C has the lower absorption rate, confirming that this temperature is not appropriate for the absorption process. It is also observed that at 650°C there is a higher absorption rate, but the saturation in the absorption process was reached fast, as a result the absorbed amount is lower than a 700°C and 730°C. Therefore a range from 650°C to 730 °C would be desirable for the CO2 absorption process.
Based on these results three different cyclic tests would be performed at 650°C, 700°C, and 730 °C in order to study the behavior of the decay in the absorbed amount.
Figure 4-7 (a) CO2 absorbed amounts at 650°C, 700°C, 730°C, and 760 °C.