Pseudo Zero-Dimension Dimming for Power
Reduction in Field Sequential Color
Liquid Crystal Display Systems
Chun-Li Chu, Ta-Liang Chiu, and Ke-Horng Chen, Senior Member, IEEE
Abstract—Expensive hardware is required by the conventional two-dimensional (2-D) light-emitting diode (LED) dimming tech-nique to obtain high-contrast and low-power in the field sequential color (FSC) technique. Thus, based on real-time image data, the pseudo zero-dimension (0-D) LED dimming technique is proposed to further reduce power dissipation in the D-FSC technique, which allows the intelligent selection of an adequate color sequence. The multi-liquid crystal and backlight (LC/BL) algorithm utilizes the D-FSC technique in temporal and spatial domains. It not only utilizes the pseudo 0-D technique to effectively reduce the color breakup (CBU) effect without greatly increasing frame rate, but also to reduce power consumption. On the backlight module, CBU suppression can be substantially improved and power dissipation can be reduced by at least 12.5%. Power consumption can also be further reduced through the re-dimming improvement in the proposed pseudo 0-D dimming technique.
Index Terms—Field sequential color (FSC), color breakup, dimming, light-emitting diode (LED) backlight, liquid crystal display (LCD).
I. INTRODUCTION
A
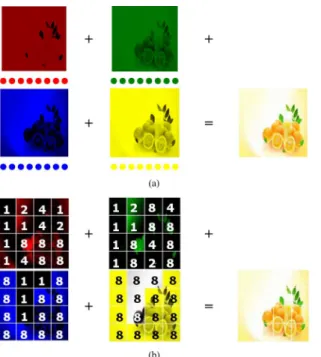
T PRESENT, liquid crystal display (LCD) is the most common thin electronic visual display. The field se-quential color (FSC) technique is one of the most popular LCD technologies because it utilizes RGB light-emitting diode (LED) backlights to obtain a better color gamut than conven-tional white LED, cold cathode fluorescent lamp (CCFL), and external electrode fluorescent lamp (EEFL) backlights [1]. The FSC-LCD principle is to mix three primary colors (red, blue, and green) as a photogene occurs in the human visual system [2]. Conventional FSC technology extracts red, blue, and green sub-frames from one image and then reconstructs a full-color image in human eyes (Fig. 1) [3], [4]. The FSC technology has several advantages because it does not require a color filter. These advantages include reduced panel cost, elevated light transmission, reduced power consumption, reduced pixel space via a higher resolution, and satisfactory image saturation.The LED backlight source is composed of a large number of tiny LED light-emitting units that allow it to successfully Manuscript received February 04, 2010; revised March 23, 2010, May 06, 2010, and June 22, 2010; accepted June 22, 2010. Date of current version July 28, 2010.
The authors are with the Institute of Electrical Control Engineering, National Chiao Tung University, Hsinchu 300, Taiwan (e-mail: ggz517@pchome. com.tw, dlchiou@yahoo.com.tw, khchen@cn.nctu.edu.tw).
Color versions of one or more of the figures in this paper are available online at http://ieeexplore.ieee.org.
Digital Object Identifier 10.1109/JDT.2010.2056353
accomplish planarization of the light source. The tiny LED light-emitting unit can attain an accurate LED brightness con-trol; thus, in accordance with the characteristics of the original image, amending the brightness in the small region can achieve high contrast ratio. The D-FSC technique can reduce the CBU effect, and proposes that the LED dimming technique should reduce power consumption and increase contrast ratio.
The well-known technology that enables the backlight source of the LCD display to be available in different regions with tuning luminance degrees in light and shade is called the local dimming technique. In broad terms, this technique can be roughly distinguished into three major categories: 0-dimension dimming technique (0-D), one dimension dimming technique (1-D), and two dimension dimming technique (2-D). The 2-D dimming technique utilizes the local dimming technology to its optimum effect.
How can 2-D local dimming greatly reduce the power con-sumption of an LCD monitor? Despite the flat light source, the backlight sources of CCFL or EEFL are generally in their max-imum brightness state. The dark state exhibited by the screen is achieved through the reduction of the LC transmission rate, which does not reduce power consumption. The 2-D dimming technique is the simulation of self-luminous displays, such as various pixels on a PDP display. According to the image data, the brightness follows the screen brightness to change with. Therefore, while in the dark state, LED brightness will decrease, effectively reducing the overall power consumption of the back-light source. The before and after results yielded by 2-D dim-ming are shown in Fig. 2.
Thus, for the FSC technology to lower its power consumption while obtaining high color gamut, it needs to lessen its disadvan-tages, such as the Color Breakup (CBU) effect that results in de-teriorated motion. Additionally, the SSC technology utilizes the dimming technique to improve power consumption and image quality [5], [6]. The CBU effect occurs when a relative velocity exists between the human eye and the image [7]. The , , and color fields in the same image will form in different locations on the retina, resulting in the emergence of a small rainbow ef-fect at the edge of the dynamic image [8]. The CBU efef-fect not only reduces image quality, but is also a probable cause of eye-strain, which may hamper the popularity of the FSC-LCD dis-play in the electronic visual disdis-play market [9].
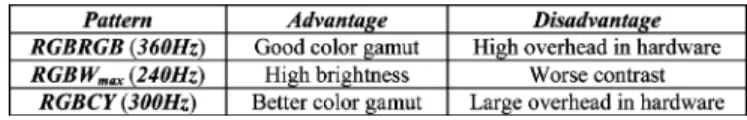
The FSC display with a 180-Hz RGB pattern results in a crit-ical CBU effect because of the low sub-frame rate [Fig. 3(a)] [10]. A double sub-frame rate RGB pattern can shorten the CBU width and make the human eye less perceptive of the CBU effect 1551-319X/$26.00 © 2010 IEEE
Fig. 1. Conventional FSC display with RGB three sub-frames.
Fig. 2. (a) Before and (b) after results using 2-D dimming.
Fig. 3. FSC display is controlled by (a) conventional RGB pattern with a 180-Hz frame rate, (b) RGB pattern with a double frame rate, (c) RGBCY pattern with a 300-Hz frame rate, and (d)RGBW pattern with a 240-Hz frame rate.
[11]–[13]. In addition, generating the color overlay by adding another sub-color field to minimize the color difference of the edge stagger causes the human eye to be less perceptive of the CBU [Fig. 3(c) and (d)] [14]–[16]. The FSC display contains the
pattern or with a sub-frame rate of 300 or
240 Hz, respectively [17]. However, a higher sub-frame rate re-sults in increasing cost and is limited by the response speed of
TABLE I
COMPARISONBETWEENTHREEPRIORARTS FORREDUCINGCBU EFFECT
the liquid crystal. The 240-Hz pattern, which in-serts a white sub-frame with a maximum gray level to reduce the gray level of RGB sub-frames, increases brightness but re-duces image contrast. The comparison is listed in Table I.
Therefore, the D-FSC algorithm can alleviate the CBU effect [18]. The proposed algorithm presents a dynamic D-FSC tech-nique geared toward the generation of the fourth sub-frame. As a result, the color intensity of the first three sub-frames is re-duced. The fourth sub-frame can compensate for the color in-tensity and, at the same time, adjust the backlight to eliminate the CBU phenomenon. However, the fourth sub-frame should be dynamically adjusted in accordance with the image data, that is, the fourth sub-frame can be white, magenta, cyan, or yellow.
Four modes, , , , and , can be
selected to deal with various types of images [19]–[21]. In this study, the pattern is made to be different
from the pattern to eliminate the disadvantages
posed by the pattern. The D-FSC algorithm
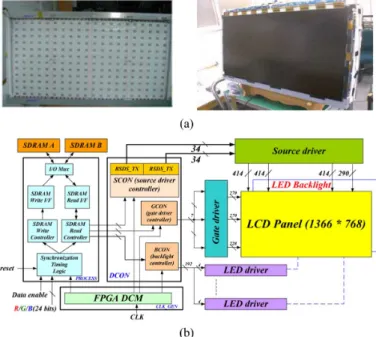
presents a prediction approach to select the best mode for the current image data. A prototype of the RGB backlight module [Fig. 4(a)] is utilized in a 32-in LCD panel with a resolution of 1366 [Fig. 4(b)]. For the dynamic D-FSC technique, LED backlight dimming technology can be used to enhance contrast and power consumption [22], [23]. However, the 0-D LED dimming technique exhibits a limitation when the image projects high brightness over the whole area. Through the pseudo 0-D dimming technique, power consumption can be further reduced and contrast can be effectively improved si-multaneously for the benefit of the dynamic D-FSC technique.
Fig. 4. (a) RBG backlight module. (b) 32-in color-filter-less LCD panel with a resolution of 1366 .
Although the general dynamic backlight technique can meet an image that exhibits high brightness, it must divide the panel into several blocks,blocks; otherwise the performance of the dimming technique will be reduced. However, the proposed pseudo 0-D technique in the D-FSC algorithm can avoid the high-brightness image to further reduce power consumption, that is, suppressed CBU and low power consumption can be simultaneously achieved.
The organization of this paper is as follows. The dynamic D-FSC technique is expressed in Section II. The section shows how the CBU effect is further reduced by the dynamic D sub-frame according to image data. Section III presents the pseudo 0-D LED dimming technique used in FSC-LCD to save power. Section IV exhibits how power consumption can be further reduced through re-dimming improvement, thus en-hancing its power-saving performance. Finally, the conclusion is presented in Section V.
II. OPERATION OF THED-FSC ALGORITHMWITH THE DYNAMICFOURTHSUB-FRAME
The D-FSC technique contains four controlling patterns:
, , , and . The sub-frame rate
is 240 Hz for all four patterns because the hardware overhead is virtually ignored.
A. , , , and Patterns
The pattern (Fig. 5) for replacing the previous pattern can solve the problem of high-brightness.
The pattern adopts four sub-frames to synthesize
one color image. The first step is finding the minimum gray level of each pixel. The minimum gray level denotes. Then, the is deducted from three sub-frame gray levels,
namely, , , and . The D sub-frame decided by
the gray level compensated back to the fourth sub-frame
Fig. 5. RGBW pattern is used to form the D sub-frame.
TABLE II
DEFINITION IN THERGBW PATTERN
Fig. 6. Use the Gamma correction curve to obtain an accurate gray level after using the D-FSC technique.
to form a white backlight. The new gray level of each orig-inal color and the D sub-frame is shown in Table II. Compared
with the pattern, the pattern will not
reduce image contrast. The pattern can also effec-tively reduce brightness because contribution from the RGB color sub-frames is decreased.
Considering the deviation caused by Gamma effect [24], [25], the correct gray value can be obtained after re-converting the liquid crystal transmittance and passing it to the control engine (Fig. 6). denotes the “gamma transform” function and denotes the “gamma inverse transform” function. , , and represent the amended gray level value, whereas , , and represent the original gray level value [26]. The value of de-notes the value. Therefore, the original algorithm must be revised to the following equations:
(1) (2) (3) (4) After implementing the pattern, the exception is that the image that only contains magenta, cyan, and yellow may cause the image processing problem. The value of as the aforementioned colors is close to zero. This results in a CBU effect similar to that of the conventional RGB FSC method. Therefore, the dynamic D-FSC technique needs to include three additional controlling patterns to effectively address the short-comings of the pattern. The additional patterns are
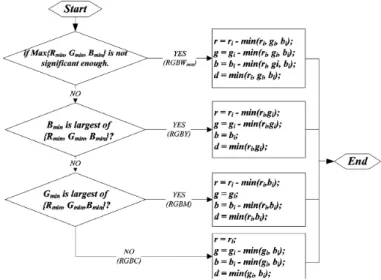
Fig. 7. Flowchart of the calculation forR ,G , andB to determine the minimum gray level among RGB colors.
, , and . The amended gray level values
for the three additional patterns are listed in Table III.
B. Selection of Adequate Pattern From the Four Patterns
According to the image data, the dynamic D-FSC tech-nique should be switched between the four patterns, namely,
, , , and , to obtain optimum
performance in the suppression of the CBU effect. As shown in Fig. 4(b), immediate change of the required backlight after amending the gray level value is unlikely because the image data writing for LCD and the driving operation of LED back-light must be operated simultaneously. Therefore, in most cases, the sub-optimum solution is to take advantage of the continuous characteristic of the image data; that is, the FSC pattern determined by the current image data can be used to predict the adequate FSC pattern for the next image data.
The gray level of the RGB colors is the smallest. The number of the smallest value can then be calculated using three
parame-ters, , , and , which can represent the minimum
quantity value of the , , and gray levels, respectively. After each image data is written to SDRAM, check which one con-tains the largest value among the values of , , and . The controlling flow chart is shown in Fig. 7. The flow chart for the D-FSC algorithm is shown in Fig. 8. If the three ad-ditional modes are not significant enough, the pat-tern will be adopted.
The spatial technique can be further utilized in the D-FSC technique to further reduce the CBU phenomenon and thus im-prove image quality. The original 1 1 LED-backlight panel is divided into smaller blocks as depicted in Fig. 9(a). The entire LED backlight panel is divided into 4 4 small blocks, and the coordinates denote the horizontal and vertical positions, with
Fig. 8. Flowchart for the D-FSC algorithm.
the origin taken at the upper left corner. According to the se-lection procedure, all LED backlight blocks are independently controlled by the four FSC patterns to enhance efficiency and reduce the CBU phenomenon [Fig. 9(b)] [27], [28]. As a result, the D-FSC technique can utilize temporal and spatial methods to greatly reduce the CBU effect.
III. PSEUDOZERO-DIMENSIONDIMMINGTECHNIQUE IN FSC-LCDFORPOWERSAVING
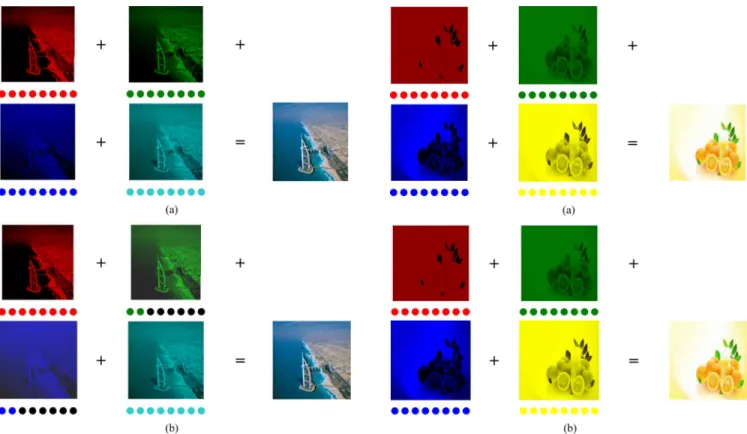
The principle of the proposed dynamic backlight is to reduce the backlight of an image and compensate for the reduction by improving the gray level of the image so as to obtain an image without distortion and lower power consumption. Equation (5) denotes the backlight brightness using the 2-D dimming tech-nique. denotes the backlight brightness without the 2-D dim-ming technique, whereas denotes the resulting luminance with the dimming factor as if the image position is at . (5) For example, as most LCD panels need to use 12 CCFL tubes, a 32-in TV with an LCD panel will be used to demonstrate the case of the fully local dimming technique. It can only be drawn up into 12 blocks in the 1-D dimming technique. Additionally, the major problem of the CCFL is that the turn on/off speed is not sufficiently fast. Constant usage of the switching speed will negatively affect the working performance and longevity of the CCFL. Fortunately, the implementation of 0-D to 2-D LED dim-ming technique in the LED backlight is easy. For example, 1152 LEDs 48 are arranged in a matrix in the experiment using the 32-in TV [Fig. 4(a)]. The actual video image for 0-D dim-ming combined with the D-FSC technique is shown in Figs. 10
and 11 for the pattern and the pattern,
respec-tively. The image in Fig. 10 can obtain significant power reduc-tion through the 0-D dimming technique; however, the image in Fig. 11 cannot obtain any power reduction, which poses a serious problem in the 0-D dimming technology. Most of the actual 0-D dimming technique cases are similar to Fig. 11(b), wherein the gray level of the frame data is too high after the backlight is reduced, leaving no room left for the video signal
Fig. 9. (a) 12 1 LED backlight unit is divided into 4 2 4 small blocks to further enhance the performance of the D-FSC technique by the spatial method. (b) The cyan, yellow, magenta, and white blocks denote theRGBC, RGBY, RGBM, and RGBW patterns, respectively.
Fig. 10. (a) TheRGBC pattern without the 0-D dimming technique. (b) The RGBC pattern with the 0-D dimming technique.
to be adjusted upward. This results in the failure of the dynamic backlight technique, as well as the power-saving technique.
Thus, the 2-D dimming technology is used to deal with cases similar to that in Fig. 11. The experimental result is shown in Fig. 12. In this case, the panel is divided into 4 4 blocks. The number (1–8) on each small block of the picture represents
power consumption (number 8 means that and the
number 1 means that ). The aforementioned methods need one more DRAM buffer to store the adjusted NEW GRAY value for each sub-frame, as well as delay one more frame time to output the current scene. The hardware requirement is more complex than the experiment platform. However, the proposed pseudo 0-D dimming technique can play an important role in reducing power consumption.
Fig. 11. (a) TheRGBY pattern without the 0-D dimming technique. (b) The RGBY pattern with the 0-D dimming technique.
The proposed pseudo 0-D dimming technique needs some modifications in the original system architecture to further achieve a power-saving performance. For example, the original equations are modified as (6)–(9). If the value of is greater than the threshold value, then the value of is only limited to the threshold value to ensure correct operation of the dimming algorithm.
(6) (7) (8) (9)
Fig. 12. (a)RGBY FSC pattern with the 0-D dimming technique. (b) RGBY FSC pattern with the 2-D dimming technique.
TABLE IV
ALGORITHM OF THERGBW PATTERN IN THEPSEUDO0-D DIMMINGTECHNIQUE
The proposed algorithm can guarantee that the gray level of the D sub-frame does not contain a gray level value that exceeds the permitted value. For example, the threshold value is set to 85 (Table IV). Then, the gray level of the D sub-frame is raised twice (i.e., 170); simultaneously, the backlight brightness of the D sub-frame is changed to 1/2 to save power. The new algorithm effectively reduces power consumption using the pseudo 0-D dimming technique.
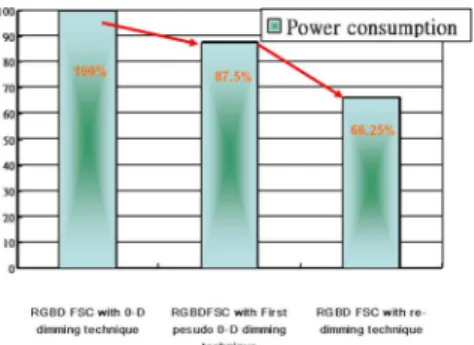
Fig. 13 shows the experimental result with the pseudo 0-D dimming technique. This research uses the pseudo 0-D tech-nique, which can avoid high gray level in the D sub-frame, to implement the new dimming technology for 0-D power- saving. In conventional 0-D dimming, the dimming technique is ap-plied to the whole panel; however, it exhibits its limitation in certain high-brightness spots. The power-saving performance will, therefore, be limited. In the proposed pseudo 0-D tech-nique, the power percentages for red, green, and blue
back-lights are expressed as , , and , respectively,
compared with conventional design. In this case, , , and are equal to 100%. Meanwhile, the power percentage of the D-frame backlight is and is equal to 50%. The total power percentage, which equals 87.5%, can be expressed as (10). As shown in Fig. 13(a) and (b), conventional 0-D dim-ming cannot have good power reduction; on the other hand,
Fig. 13. (a)RGBY pattern without the 0-D dimming technique. (b) RGBY pattern with the pseudo 0-D dimming technique. (c) Bar chart for power con-sumption of different 0-D dimming technique for backlight module.
the proposed method can improve power consumption by ap-proximately 12.5%. In other words, all images produced by the pseudo 0-D technique can have at least 12.5% power reduction in backlights. Fig. 13(c) depicts the power comparison between three FSC methods with and without the pseudo 0-D dimming technique
(10)
IV. RE-DIMMINGIMPROVEMENTTECHNIQUE
To further decrease power consumption, the pseudo 0-D dim-ming technique can be iterated for the second power reduction,
Fig. 14. (a) First pseudo 0-D dimming operation similar to Fig. 13(b). (b) Second operation that can have re-dimming improvement compared to conventional 0-D dimming technique.
known as the re-dimming improvement. According to (6)–(8), the gray level of the red, green, and blue sub-frames is effec-tively reduced due to the first implementation of the pseudo 0-D dimming technique. Obviously, the second operation will not be limited by a high-brightness image because of the results of the first operation. Power consumption can thus be greatly reduced by subsequent 0-D dimming (i.e., the re-dimming technique). Fig. 14 describes the detailed operation results. At this time, the
values of , , , and are 66%, 66%, 100%,
and 33%, respectively. The power percentage of the proposed method is 66.25% compared with the conventional design.
Fig. 14 shows the result of the re-dimming improvement. The range of the factor in (5) is extended to conveniently explain the re-dimming improvement. Although it may cause image distortion, it can be compensated by the dithering tech-nique. Fig. 14(a) shows the result of the first operation, which is pseudo 0-D dimming. In Fig. 14(b), the red and green sub-frames have a factor of 0.66, whereas the blue sub-frame has a K factor of 1.0. In addition, the yellow sub-frame has a factor of 0.33. After the power calculation, not only can the power consumption be reduced by about 33%, the color breakup effect suppression can also be maintained effectively due to the D-FSC technique with the dynamic forth sub-frame. In sum-mary, the pseudo 0-D dimming technique can reduce the power consumption of conventional 0-D dimming to save power. The re-dimming operation can be applied not only on the fourth
Fig. 15. Bar chart for power consumption of different 0-D dimming techniques for backlight module.
Fig. 16. Flowchart for the image processor.
sub-frame, but also on the first three sub-frames to get a better power reduction and high efficiency (Fig. 15).
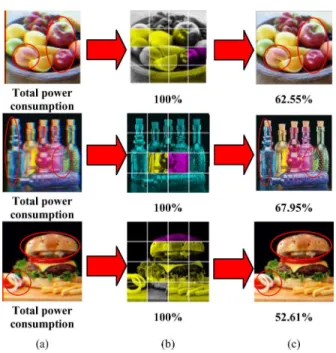
Fig. 16 shows the controlling flowchart of the generalization of the FSC technique in Section II and the pseudo 0-D dimming technique in Section III. In Step 2, the system reads image data into memory. Step 3 is used to select the correct D-RGB pat-tern, of which the procedure is described in detail in Section II and Figs. 7 and 8. In Steps 4–5, all new gray level values of one frame are calculated by the pseudo 0-D dimming technique system. The system then runs the re-dimming operation to get the factor and new gray level once more. Finally, the calcu-lated data are set to the backlight module for LED driving, and the correct D-FSC pattern for the next frame is selected (Step 1). Finally, each 2-D block can be regarded as a smaller 0-D block. As a result, the pseudo 0-D dimming technique can be applied on the 2-D dimming condition. Fig. 17(a) shows three images that need to obtain independent D-RGB pattern assign-ments for each small block due to the critical CBU effect and the high power consumption. Thus, the LCD panel is divided into 4 4 blocks, where each block has its own independent D-RGB pattern [Fig. 17(b)]. Each 2-D block can select its own optimum D-RGB pattern to further reduce the CBU effect [Fig. 9(b)] and adjust the luminance of the backlight to reduce power con-sumption through the pseudo 0-D re-dimming technique alone. As a result, Fig. 17(c) shows the revised images. Note that the
Fig. 17. (a) Original images exhibit critical CBU effect and high power consumption. (b) FSC backlight pattern arrangement of the D-frame for each block in a divided 424 panel. (c) Display image results after the proposed technique was applied.
on-screen CBU phenomenon, which is highlighted by a red line in Fig. 17(a), has been effectively reduced.
On the other hand, the total power consumption also exhibited obvious reduction. In fact, if the LCD panel can be divided into many small blocks, the power-saving and CBU-suppression per-formance will be greatly reduced. Define the power consump-tion of 2-D dimming mode to . In addition, the power consumption of each 2-D block denotes , which is ex-pressed as (10). The coordinates denote the horizontal and vertical positions on the LCD [see Fig. 9(a)]. The power consumption of the 2-D dimming mode can be calculated as (11), and the result exhibits a power consumption of 52.61% [see Fig. 17(c)].
(11)
V. CONCLUSION
Based on real-time image data, the pseudo 0-D LED dim-ming technique is proposed to further reduce power dissipa-tion in the D-FSC technique, which can intelligently select an adequate color sequence. Expensive hardware is particularly needed in a conventional 2-D LED dimming technique used to obtain high-contrast images in low-power. The pseudo 0-D dimming technique can effectively reduce power consumption in the D-FSC algorithm that utilizes the dynamic D-FSC tech-nique in temporal and spatial domains to suppress the CBU ef-fect without greatly increasing frame rate. Experimental results show the CBU suppression can be improved substantially and the power dissipation can be reduced by at least 12.5%. Power consumption can also be further reduced through the re-dim-ming improvement in the proposed pseudo 0-D dimre-dim-ming tech-nique; that is, power saving can be improved with a satisfactory CBU suppression performance.
color LCD based on OCB with an LED backlight,” J. Soc. Inf. Display, vol. 10, pp. 81–85, 2002.
[3] T. Fukami, “New driving method for field sequential color LCDs using OCB mode,” in IDW’06, 2006, pp. 1617–1620.
[4] F. Yamada, H. Nakamura, Y. Sakaguchi, and Y. Taira, “Color sequen-tial LCD based on OCB with an LED backlight,” in SID Symp. Dig.
Tech Papers, 2000, vol. 31, pp. 1180–1183.
[5] P. C. Baron, “Saccadic color breakup in field sequential color displays: An overview,” in ADEAC 2006, pp. 138–143.
[6] H. Nakamura, K. Miwa, and K. Sueoka, “Modified drive method for OCB LCD,” in Proc. 17th IDRC, 1997, pp. L66–69.
[7] S.-C. Chen, S.-P. Yan, Y.-K. Cheng, F.-C. Lin, C.-M. Wei, Y.-P. Huang, and H.-P. D. Shieh, “A human visual model for color break-up artifact in design field-sequential color LCDs,” in IDMC 2007, pp. 872–875.
[8] S.-P. Yan, Y.-K. Cheng, F.-C. Lin, C.-M. Wei, Y.-P. Huang, and H.-P. D. Shieh, “A visual model of color break-up for design field-sequential LCDs,” in SID Symp. Dig. Tech. Papers, 2007, vol. 38, pp. 338–341. [9] C.-H. Chen, F.-C. Lin, Y.-T. Hsu, Y.-P. Huang, and H.-P. D. Shieh, “A
field sequential color LCD based on color fields arrangement for color breakup and flicker reduction,” J. Display Technol., vol. 5, no. 1, pp. 34–39, Jan. 2009.
[10] Miettinen, R. Näsänen, and J. Häkkinen, “Effects of saccade length and target luminance on the refresh frequency threshold for the visibility of color break-up,” J. Display Technol., vol. 4, no. 1, pp. 81–85, Mar. 2008.
[11] J. B. Eichenlaub, “Develop and preliminary evaluation of field sequen-tial LCD free of color breakup,” in SID Symp. Dig. Tech Papers 25, 1994, pp. 293–296.
[12] K. Sekiya, T. Miyashita, and T. Uchida, “Simple and practical way to cope with color breakup on field sequential color LCDs,” in SID Symp.
Dig. Tech Papers, 2006, vol. 37, pp. 1661–1664.
[13] C. H. B. Elliott, S. Han, M. H. Im, M. Higgins, P. Higgins, M. Hong, N.-S. Roh, C. Park, and K. Chung, “Co-optimization of color AMLCD subpixel architecture and rendering algorithms,” in SID Symp. Dig., 2002, vol. 31, pp. 172–175.
[14] E. H. A. Langendijk, S. Swinkels, D. Eliav, and M. en-Chorin, “Sup-pression of color breakup in color-sequential multi-primary projection displays,” J. Soc. Inf. Display, vol. 14, pp. 325–329, 2006.
[15] H. Sugiura, H. Kaneko, S. Kagawa, M. Ozawa, H. Tanizoe, H. Katou, T. Kimura, and H. Ueno, “Six-Primary-Color 23-in WXGA LCD using six-color LEDs,” in SID Symp. Dig., 2005, vol. 34, pp. 1124–1127. [16] L. D. Silverstein, “ST color: Hybrid spatial-temporal color synthesis
for enhanced display image quality,” in SID Symp. Dig., 2005, vol. 34, pp. 1112–1115.
[17] N. Koma and T. Uchida, “A new field-sequential-color LCD without moving-object color break-up,” J. Soc. Inf.. Display, vol. 11, pp. 413–417, 2003.
[18] Y.-P. Huang, K.-H. Chen, C.-H. Chen, F.-C. Lin, and H.-P. D. Shieh, “Adaptive LC/BL feedback control in field sequential color LCD tech-nique for color breakup minimization,” J. Display Technol., no. 3, pp. 290–295, Sep. 2008.
[19] P. J. Bos and K. R. Koehler, “The pi-cell: A fast liquid-crystal optical-switching device,” Mol. Cryst. Liq. Cryst., vol. 113, pp. 329–339, 1984. [20] M. B. Chorin, “Improving LCD TV color using multi-primary
tech-nology,” in FPD Int. Forum, Yokohama, 2005, Paper PC2–2. [21] K. Endo, “New mobile technologies creating a host of new mobile
equipment,” in FPD Int. Forum, Yokohama, 2005, Paper B1–4. [22] A. Konno, Y. Yamamoto, and T. Inuzuka, “RGB color control system
for LED backlights in IPS-LCD TVs,” in SID Symp. Dig., 2005, vol. 34, pp. 1380–1383.
[23] W. Cheng, “Power minimization of LED backlight in a color sequential display,” in SID Symp. Dig., 2005, vol. 34, pp. 1384–1387.
[24] F.-C. Lin, Y.-P. Huang, C.-M. Wei, H.-P. D. Shieh, C.-C. Tsai, and W.-C. Tai, “Stencil-FSC method for color break-up suppression and low power consumption in field-sequential LCDs,” in SID Symp. Dig.
Tech Papers, 2008, vol. 39, pp. 1108–1111.
[25] F.-C. Lin, Y.-P. Huang, L.-Y. Liao, C.-Y. Liao, H.-P. D. Shieh, T.-M. Wang, and S.-C. Yeh, “Dynamic backlight gamma on high dynamic range LCD TVs,” J. Display Tech., vol. 4, no. 2, pp. 139–152, Jun. 2008.
[26] C.-H. Chen, K.-H. Chen, Y.-P. Huang, H.-P. D. Shieh, and M.-T. Ho, “Gray level redistribution in field sequential color LCD technique for color breakup reduction,” in SID Symp. Dig. Tech. Papers, 2008, vol. 39, pp. 1096–1099.
[27] Y.-T. Hsu, F.-C. Lin, C.-H. Chen, Y.-P. Huang, and H.-P. D. Shieh, “Drive and control circuitry of OCB field-sequential color LCD with high data rate,” in IDMC 2007, pp. 435–438.
[28] L. Y. Liao, F. C. Lin, Y. P. Huang, H. P. D. Shieh, and S. C. Yeh, “A real-time liquid crystal signal compensation method for high dynamic range LCD,” in IDW 2007, pp. 1–1.
Chun-Li Chu was born in Taipei, Taiwan, in
1979. He received the M.S. degrees in electronics engineering from National Chiao-Tung University (NCTU), Hsinchu, Taiwan, in 2009.
Currently, he is engaged in low temperature poly-silicon (LTPS) TFT-LCD driving system de-velopment. His research is to improve image quality with TFT-LCD, the dynamic backlight system de-sign for low power consumption and color breakup (CBU) effect suppression in FSC-LCD.
Ta-Liang Chiu was born in Miaoli, Taiwan, in 1971.
He received the M.S. degree from the Department of Electrical and Control Engineering, National Chiao Tung University, Hsinchu, Taiwan, in 2010.
Currently, he is a member of the Mixed Signal and Power Management IC Laboratory, National Chiao Tung University, Hsinchu, Taiwan. His research interests include power converter design of light emmting-diode (LED) backlight module, pulse width modulation (PWM) controller, power factor correction (PFC) controller of switching power supplies.
Ke-Horng Chen (M’04–SM’09) received the B.S.,
M.S., and Ph.D. degrees in electrical engineering from National Taiwan University, Taipei, Taiwan, in 1994, 1996, and 2003, respectively.
From 1996 to 1998, he was a part-time IC De-signer at Philips, Taipei, Taiwan. From 1998 to 2000, he was an Application Engineer at Avanti, Ltd., Taiwan. From 2000 to 2003, he was a Project Manager at ACARD, Ltd., where he was engaged in designing power management ICs. He is currently an Associate Professor in the Department of Electrical Engineering and Institute of Electrical Control Engineering, National Chiao Tung University, Hsinchu, Taiwan, where he organized a Mixed-Signal and Power Management IC Laboratory. He is the author or coauthor of more than 85 papers published in journals and conferences, and also holds several patents. His current research interests include power management integrated circuits (PMICs), mixed-signal circuit designs, display algorithm and driver designs of liquid crystal display (LCD) television (TV), red, green, and blue (RGB) color sequential backlight designs for optically compensated bend (OCB) panels, and low-voltage circuit designs.