國立交通大學
材料科學與工程學系
碩士論文
碳載體鉑鋨合金奈米顆粒觸媒應用於酸性
燃料電池之氧氣還原反應
Carbon Supported Pt-Os Electrocatalysts for
Oxygen Reduction Reaction in Acidic Fuel Cells
研究生:李依叡
指導教授:吳樸偉 教授
National Chiao Tung University
Department of Materials Science
and Engineering
Thesis
Carbon Supported Pt-Os Electrocatalysts for
Oxygen Reduction Reaction in Acidic Fuel Cells
Student: Yi-Juei Lee
Advisor: Prof. Pu-Wei Wu
碳載體鉑鋨合金奈米顆粒觸媒應用於
酸性燃料電池之氧氣還原反應
研究生:李依叡 Student: Yi-Juei Lee
指導教授:吳樸偉 教授 Advisor: Prof. Pu-Wei Wu
國立交通大學
材料科學與工程學系
碩士論文
Submitted to Department of Materials Science and Engineering
College of Engineering
National Chiao Tung University
in partial Fulfillment of the Requirements
for the Degree of
Master
in
Materials Science and Engineering
July 2013
Hsinchu, Taiwan, Republic of China
i
摘要
本研究使用濕式回流化學合成法合成出附著在奈米碳球基材的 Pt2Os 鉑鋨合金奈米顆粒觸媒,顆粒直徑為 3.1 nm。之後沉積於旋轉電極上並在 50 毫升,0.1 M 除氧的過氯酸水溶液中做電化學多圈循環掃描去合金處 理,將表面的 Os 原子選擇性的移除,使更多的 Pt 原子裸露出來,形成表面 Pt 居多的顆粒觸媒。經過去合金處理的 DA-Pt2Os 合金觸媒,經 X 光繞射 儀分析得知為 Pt 基的 FCC 單相合金,且經掃描穿透式電子顯微鏡元素分析 結果顯現出經過去合金處理後,合金的元素組成為 Pt4Os。 經過去合金處理的 DA-Pt2Os/C 觸媒具有很好的電化學活性,在氧氣 飽合的 0.1 M 過氯酸水溶液中進行催化氧氣還原反應的測試,質量比活性值 為 0.29 mA μgPt-1`,比表面積活性值為 1.03 mA cmPt-2,活性皆優於商用 Pt/C 觸媒的活性(0.17 mA μgPt-1,0.31 mA cmPt-2)。除此之外,經 Koutecky-Levich plots 的斜率計算,推算出氧氣是經由直接四電子的還原路徑被還原為水。 另外在觸媒穩定性的測試中,將 DA-Pt2Os/C 觸媒置於 0.1 M 的過氯酸水溶 液中進行 10,000 圈的電化學循環掃描加速觸媒的劣化,經測試後再以相同 條件量測催化活性,假設電極上 Pt 乘載量並無改變的情形下,其電化學活 性表面積下降了 10.9 %,質量活性下降了 11.1 %,結果還是優於 Pt/C 商用 觸媒的 14.7 %與 24.6 %,可以見得此方法製備出的 DA-Pt2Os/C 鉑鋨合金 觸媒在氧氣催化活性和觸媒耐久度方面,都有優於商用觸媒的表現。ii
Abstract
Carbon-supported Pt2Os (Pt2Os/C) nanoparticles in 3.1 nm size are synthesized
from a wet chemical reflux process. Subsequently, the Pt2Os/C undergoes a dealloying
treatment in which multiple cyclic voltammetric scans are imposed in a 50 mL of deaerated 0.1 M aqueous HClO4 solution to dissolve the Os atoms selectively from
the surface of the Pt2Os nanoparticles. X-ray diffraction signals from the dealloyed
sample (DA-Pt2Os/C) indicate a fcc phase and composition analysis suggests Pt4Os.
Line scans from the scanning transmission electron microscope confirm that the surface of Pt4Os is depleted with the Os atoms. The DA-Pt2Os/C shows impressive
electrocatalytic behaviors (0.29 mA μgPt-1 in mass activity and 1.03 mA cmPt-2 in
specific activity) for oxygen reduction reaction (ORR) in oxygen-saturated 0.1 M aqueous HClO4 solution, as compared to those of commercially available Pt/C and
as-synthesized Pt2Os. In stability test, the DA-Pt2Os/C demonstrates better retention
in ORR activities and smaller loss of electrochemical active surface area. In addition, a four-electron step is responsible for the ORR actions occurring on the DA- Pt2Os/C.
iii
Acknowledgements
在交大材料的碩士生涯已近尾聲,能夠如期完成論文也歸功於各位實驗室夥 伴的幫忙與協助。回想起這兩年與大家相處的點點滴滴,確實很快樂! 謝謝吳樸偉老師,感謝老師兩年的指導。除了專業知識的教導外,一些對於時事 的心得與看法、邏輯思考方面,也讓我學習到不少,受用無窮。 謝謝謝育淇學長兼師父,從實驗方法與構想,都幫助了我很多,若沒有你的話, 我也不會順利畢業,祝福你在美國一切順利! 謝謝廖晨宏、張立忠、張雲閔、陳境妤學長姐,不論是實驗的討論與幫助,還是 帶領整個實驗室,你們都做得很棒,非常謝謝你們。 謝謝黃冠傑學長,當初在你的指引下進了實驗室,後來很多事情的選擇也給了我 一些很好的意見。有你真好^O^ 謝謝已榮退的大仔阿猛哲瑋鴨子小六學長,你們在實驗室的時候,氣氛都很歡 樂,也帶著我從碩一小屁孩慢慢進化成碩二擋箭牌,如今我也要榮退了! 謝謝柏翰、韋霖、建程、雁汝、欣儀、宥閩這些碩二夥伴,從一開始大家一起修 課考試,互相 cover meeting,到後來各忙各的實驗到焦頭爛額,大家還是會互 相關心扶持,雖然柏翰都不捧場我的爛梗,欣儀在隔壁的聲音都很大聲,揪建程 吃飯都不去等等,謝謝你們給了我快樂的兩年碩士生活,以後一定要保持聯絡歐。 謝謝碩一的學弟,詠民孫佑葉少史丹萱維,碩零家豪彩薇成育,有你們的協助口 試才能夠如此順利,謝謝謝謝! 謝謝 507A 的冷氣,你真的很涼很舒服,能讓我心平靜氣的完成論文,謝謝。 謝謝在實驗上所有有幫助過我的前輩與同學,人數眾多恕無法一一列出,由衷的 感謝你們的協助與幫忙,感激不盡。 李依叡, 2013/08/06iv
Contents
摘要... i Abstract ... ii Acknowledgements ... iii Contents ... iv List of Tables ... viList of Figures ... vii
Chapter 1 Introduction ... 1
1.1 Research background ... 1
1.2 Motivation ... 3
Chapter 2 Literatures review ... 5
2.1 Fuel cells ... 5
2.1.1 General introduction of fuel cells ... 5
2.1.2 Polymer Electrolyte Fuel Cell (PEFCs) ... 6
2.1.3 Electrode structure in PE fuel cells ... 10
2.2 Electrochemical reactions in PEFCs ... 12
2.2.1 Over all reactions and ideal cells voltage ... 12
2.2.2 Oxygen reduction reaction ... 13
2.3 Electrocatalysts for oxygen reduction reaction ... 17
2.3.1 Cathode catalysts for ORR ... 17
v
3.1 Pt2Os on carbon supports catalysts synthesis ... 20
3.2 Electrochemical analysis ... 22
3.3 Materials characterization ... 25
Chapter 4 Results and discussion ... 26
4.1 Material structure characterization ... 26
4.1.1 TEM morphologies of catalysts ... 26
4.1.2 XRD and chemical composition analysis ... 27
4.1.3 Dealloying treatment analysis ... 31
4.1.4 Structure analysis of single Pt2Os particle ... 33
4.2 Electrochemical analysis ... 35
4.2.1 Electrochemical activity for ORR ... 35
4.2.2 Durability performance ... 42
Chapter 5 Conclusion ... 46
vi
List of Tables
vii
List of Figures
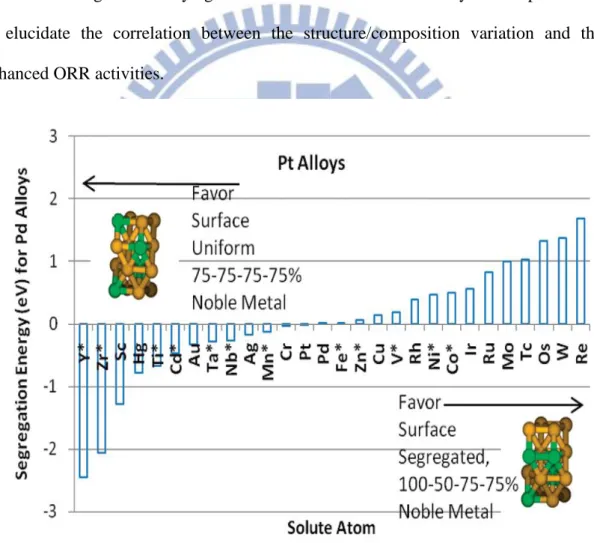
Figure 1.1 Illustration of the structures used for predicting the segregation of Pt3X
alloys, where positive energy implies segregation with the top layer pure Pt, and the second layer 50% Pt. A “ * ” symbol indicates that a stable Pt3X
phase has been observed experimentally 7. ... 4
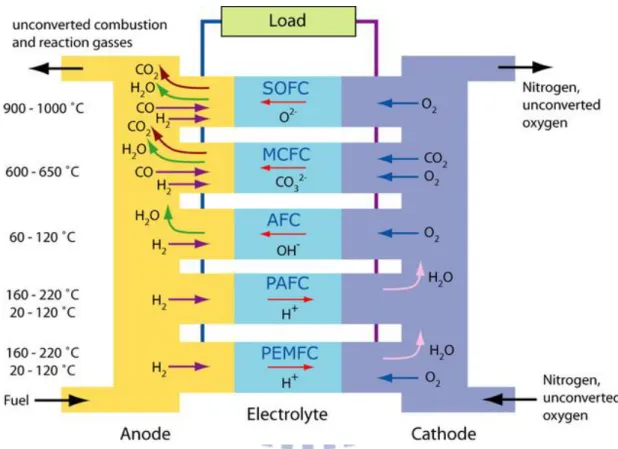
Figure 2.1 The operating conditions and mechanisms of different fuel cell types
<http://www.doitpoms.ac.uk/tlplib/fuel-cells/types.php>. ... 7
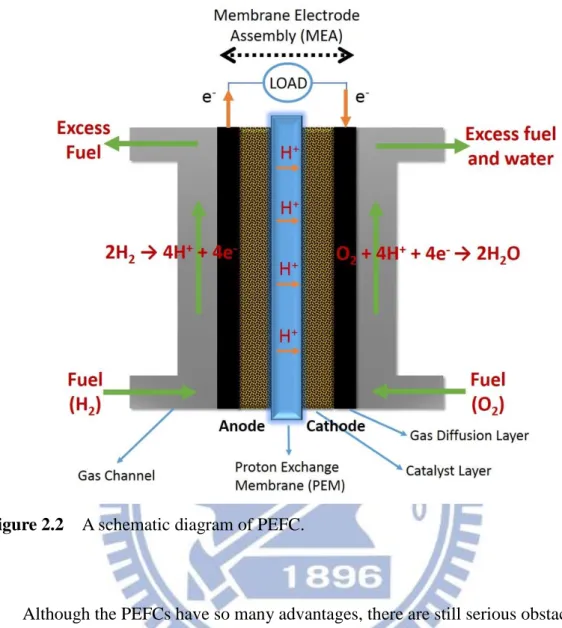
Figure 2.2 A schematic diagram of PEFC. ... 9 Figure 2.3 The ideal schematic of platinum particles impregnated on the carbon
support and a TEM image of platinum nanoparticles supported on the Vulcan XC-72 carbon 11. ... 10
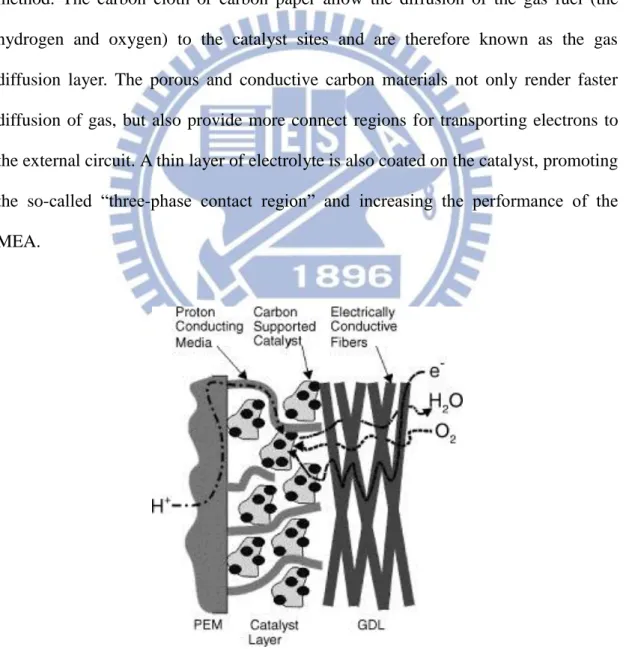
Figure 2.4 Simple structural diagram of a PEFC electrode 12. ... 11
Figure 2.5 A simple schematic of ORR on the surface of catalysts 16. ... 15
Figure 2.6 Influence of the surface morphology and electronic surface properties on
the kinetics of ORR on Pt3Ni(hkl) surfaces as compared to the corresponding Pt(hkl) surfaces (a horizontal dashed gray line marks specific activity of polycrystalline Pt) Values of d-band center position obtained from UPS spectra are listed for each surface morphology and compared between corresponding Pt3Ni(hkl) and Pt(hkl) surfaces 21. ... 19
Figure 2.7 Illustration of the stepwise in-situ preparation of dealloyed Pt-Cu
electrocatalysts by voltammetric selective dissolution of Cu from a Pt25Cu75 precursor catalyst 57. ... 19
Figure 3.1 Synthesis process of carbon-supported Pt2Os catalyst. ... 21
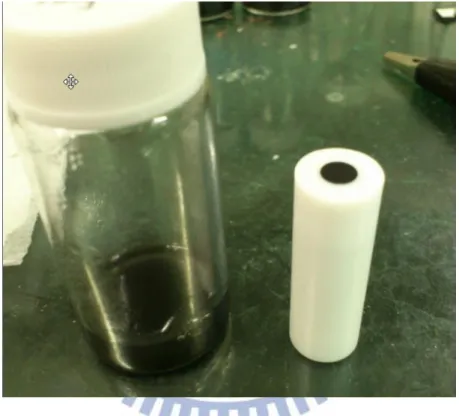
Figure 3.2 The optical photograph of catalysts ink and a rotating disk electrode tip.
... 23
Figure 3.3 Three-electrode electrochemical system with a rotating disk electrode,
where the WE is the working electrode, the CE is the counter electrode, and the RE is the reference electrode (Ag/AgCl). ... 24
viii
Figure 4.1 The TEM images of Pt/C, Pt2Os/C, and DA-Pt2Os/C. ... 27
Figure 4.2 The X-ray diffraction patterns of Pt/C, Pt2Os/C, and DA-Pt2Os/C, as
well as fcc Pt (JCPDS:004-0802) and hcp Os (JCPDS: 006-0662). ... 28
Figure 4.3 The CV curves of Pt2Os/C undergoing the dealloying treatment of 3rd,
10th, 50th, and 60th cycles, respectively. The electrolyte was deaerated 0.1
M aqueous HClO4 solution and the scan rate was 50 mV s-1. The
highlighted area was used to estimate the ECSA values. Inset is the CV curve for the Pt/C for ECSA determination. ... 31
Figure 4.4 The HR-STEM images and EDS line-scans of (a) Pt2Os and (b) DA-
Pt2Os nanoparticles. ... 34
Figure 4.5 The ORR curves of Pt/C, Pt2Os/C, and DA-Pt2Os/C in apparent current
density. The electrolyte was oxygen-saturated 0.1 M aqueous HClO4
solution and the scan rate was 10 mV s-1. ... 36
Figure 4.6 (a) The ORR curves of DA-Pt2Os/C at various RDE rotation speeds.
The electrolyte was oxygen-saturated 0.1 M aqueous HClO4 solution and
the scan rate was 10 mV s-1. (b) The Koutecky-Levich plot of DA-
Pt2Os/C at different voltages. ... 38
Figure 4.7 The Tafel plots of the ORR curve (Fig. 4.5) in (a) mass activity and (b)
specific activity. ... 40
Figure 4.8 The ORR curves before and after the durability test for (a) DA-Pt2Os/C
and (b) Pt/C. The electrolyte was oxygen-saturated 0.1 M aqueous HClO4
solution and the scan rate was 10 mV s-1. ... 43
Figure 4.9 The CV curves of (a) DA-Pt2Os/C and (b) Pt/C in deaerated 0.1 M
aqueous HClO4 solution at a scan rate of 50 mV s-1. These curves were
used to determine the ECSA (highlighted area) before and after the durability test. ... 45
1
Introduction
1.1 Research background
Global warming has been the critical issue all over the world during the past decade. The rising CO2 concentration in the atmosphere caused by fossil fuel overuse
is considered as the major reason responsible for the global warming which not only threatens human beings but also the entire environment. To mitigate the CO2 problem,
energy conservation and carbon emission reduction are proposed, in addition to the development of many types of alternative clean energy resources. For examples, solar cells, nuclear power, wind power, hydraulic power generation, have been developed with the aim to replace the fossil-fuel power.
Hydrogen-power fuel cells are promising alternative energy resources, with advantages like impressive energy conversion efficiency, low CO2 discharge, and
quiet operation. The fuel cells operate by converting chemical energy directly to electricity, with much subdued energy loss as compared with conventional thermodynamic Carnot engine. Fuel cells can provide energy from a variety of fuels, and the hydrogen and methanol are often used, and no charging time is needed. Although the fuel cell had been studied for many years, its progress is far away from commercialization. The main obstacle is the cost of the catalysts layer because of the usage of noble metal like platinum at both anode and cathode for electrocatalytic functions.
For now, scientists have developed many methods to reduce the usage of noble metal and simultaneously maintain similar or better catalytic performance. For instance, bi-metallic alloy catalysts and dealloying treatment have been reported as
2
effective ways. Transition metal elements like Ni, Fe, Co, Cu, Ru, and etc. were studied in binary or ternary alloys with the platinum show activities that are better than pure platinum catalysts. The dealloying method also provides an effective way to remove the less noble atoms from the alloy nanoparticles and form a platinum-rich surface enhancing the catalytic activity. In this research, we studied the Pt-Os alloy system for catalytic activities for oxygen reduction reaction (ORR) at the cathodes of polymer electrolyte fuel cells (PEFCs). Furthermore, we also imposed electrochemical dealloying treatment on the PtOs alloy catalysts forming a Pt-rich surface on the Pt-Os catalysts and studied the resulting ORR activity and material characteristics.
3
1.2 Motivation
Previously, binary PtxOsy nanoparticles have been studied as promising
electrocatalysts for methanol oxidation reaction (MOR) in direct methanol fuel cells. It is because both experimental results and quantum mechanical calculations indicated active roles of Os to facilitate nearby Pt for MOR actions 1-4. For example, Zhu et al. reported that the Pt-Os electrode exhibited a large MOR activity promoted by the adsorbed OH species, but the formation of OsO2 might be detrimental 3. In addition,
the adsorption and oxidation of CO had been investigated by Liu et al. in which the threshold potential for CO oxidation on the Pt-Os (4:1 in molar ratio) was nearly identical to that of Pt-Ru (4:1 in molar ratio) 5. Moreover, according to Kim et al., the
oxidation of CO on the Os-modified Pt (111) plane was accelerated because the Os atoms increased the mobility of the adsorbed CO by altering the electronic structure of the Pt (111) surface, and thus greatly minimized the CO-poisoning effect 6.
The oxyphilic nature of the Os atoms is a desirable attribute for ORR electrocatalysts. A quantum mechanical simulation by Yu et al. suggested that the Pt3Os alloy has a positive segregation energy (shown in Fig. 1.1), which allowed for
the formation of segregated surface structure (the 1st layer is 100% Pt, the 2nd layer is 50% Pt and 50% Os, and the 3rd layer is 75% Pt and 25% Os) 7. The Pt-skin surface is
expected to enhance the ORR activity by reducing the energy barrier for ORR steps 8. This has been confirmed in a recent report in which a Pt0.8Os0.2 monolayer deposited
on a Pd (111) demonstrated a rather impressive ORR activity because the presence of surface Os atoms engendered a weaker affinity for the oxygen adsorption and consequently, a reduction in the OH adsorption on the Pt active sites 9. Therefore, we
4
rationalized that the alloyed PtOs nanoparticles might be promising electrocatalysts for ORR in acidic electrolytes.
In this work, we demonstrated the synthesis of Pt2Os nanoparticles and engaged
a dealloying treatment to render a quasi core-shell Os@Pt nanostructure. The dealloyed nanoparticles were evaluated for ORR activities and durability tests, and the results were compared with commercially available Pt nanoparticles. Extensive material characterizations were carried out to understand structural/compositional evolution during the dealloying treatments. Electrochemical analysis was performed to elucidate the correlation between the structure/composition variation and the enhanced ORR activities.
Figure 2.1 Illustration of the structures used for predicting the segregation of Pt3X
alloys, where positive energy implies segregation with the top layer pure Pt, and the second layer 50% Pt. A “ * ” symbol indicates that a stable Pt3X phase has been
5
Chapter 2 Literatures review
2.1 Fuel cells
2.1.1 General introduction of fuel cells
Fuel cell is one of the promising alternative clean energy providers in the future, and it directly converts chemical energy from a fuel to electricity through oxidation and reduction at the anode and cathode, respectively. The fuel cell have been studied for more than 170 years. In 1839, Sir William Robert Grove developed his first fuel cell stack driving the reverse reaction of water electrolysis (2H2 + O2 → 2H2O) and
produced electricity. At the beginning, the electricity was too small for other applications. However, the performance had been steadily improved by many researches. In general, fuel cells have some special advantages as listed below 10:
(1) High energy conversion efficiency:
Fuel cells, converting chemical energy directly into electricity, are more efficient than combustion engines.
(2) Stability and simplicity:
This can lead to a highly reliable and long-lasting system due to its stable performance with sufficient fuel supply.
(3) Low emissions:
The product of the main fuel cell reaction is pure water with no harmful SOx or NOx, which means a fuel cell can be essentially “zero
6
(4) Silence:
There is not so much machinery equipment in fuel cell system, and it drives chemical reactions when working without noises.
Fuel cell is a power device which is driven through electrochemical reactions, including the oxidation and reduction reaction. The common anode fuels are hydrogen, methanol, formic acid, and ethanol for different types of fuel cells, and the mostly-used fuel at the cathode is the oxygen. The final products is heat and water. It is a pure and clean energy with low CO2 emission in the future. Unfortunately, even
though the fuel cell has such advantages and had been used in space shuttles as a power generator in NASA’s project Apollo in 1960s, it is still not commonly used today. The main obstacles are the insufficient power performance and the development of fuel supply systems. Furthermore, to enhance power performance, the usage of noble metal-Pt as a catalyst results in a high cost to commercialize. These problems need to be tackled as soon as possible.
2.1.2 Polymer Electrolyte Fuel Cell (PEFCs)
There are various types of fuel cells, but they all work in the same principle. There are three major components that make up the fuel cells; the anode, the cathode and the electrolyte. The classification of fuel cells are based on their working temperature and the type of ion-conducting electrolyte. For example, there are solid oxide fuel cells (SOFC), molten-carbonate fuel cells (MCFC), phosphoric acid fuel cells (PAFC), polymer electrolyte fuel cells (PEFC) and alkaline fuel cells. The fuels
7
at the anode, cathode, and the type of electrolyte are shown in Figure 2.1. Among these fuel cells, the polymer electrolyte fuel cells (PEFCs) has some advantages listed below: the highest power density, lighter weight, starting quickly, and lower operating temperature. These benefits make PEFCs desirable for applications in vehicle’s power and portable electronic devices.
Figure 2.1 The operating conditions and mechanisms of different fuel cell types
<http://www.doitpoms.ac.uk/tlplib/fuel-cells/types.php>.
Figure 2.2 shows a simple schematic diagram of polymer electrolyte FCs. Proton exchange membrane is the electrolyte in PEFCs, which is an ion-conducting polymer. The poly-matrix proton exchange membrane is a stacked film between two electrodes, as shown in Figure 2.2. The most commonly used materials for PEM is Nafion (Dupont), an ionomer with a perfluorinated backbone like Telflon (PTFE). One side
8
of the membrane is bonded with the anode and the another side is bonded with the cathode. Both electrodes are made of a catalyst layer and a gas diffusion layer. This anode – electrolyte - cathode structure is known as a “Membrane Electrode Assembly” (MEA). The performance of fuel cell power efficiency has high correlation to MEAs. The electrochemical reactions at the anode and cathode side are listed below;
Anode reaction: 2H2 → 4H+ + 4e
-Cathode reaction: O2 + 4H+ + 4e- → 2H2O
Overall reaction: 2H2 + O2 → 2 H2O
Hydrogen is been oxidized into protons and electrons, and the hydrogen ions (protons) migrate across the electrolyte to the cathode and the electrons transport through the outer circuit to the cathode side. The oxygen at the cathode side is been reduced by the electrons and protons and becomes the final product – water. In some low-power applications like portable electronic devices, methanol and formic acid are more suitable than hydrogen as an anode fuel because they demonstrate higher mass power densities and they are relatively easier for storage.
9
Figure 2.2 A schematic diagram of PEFC.
Although the PEFCs have so many advantages, there are still serious obstacles to be resolved before their eventual commercialization:
(1) Production cost and storage of hydrogen
(2) High cost from electrolyte and catalyst
(3) Complex heat and water management
10
2.1.3 Electrode structure in PE fuel cells
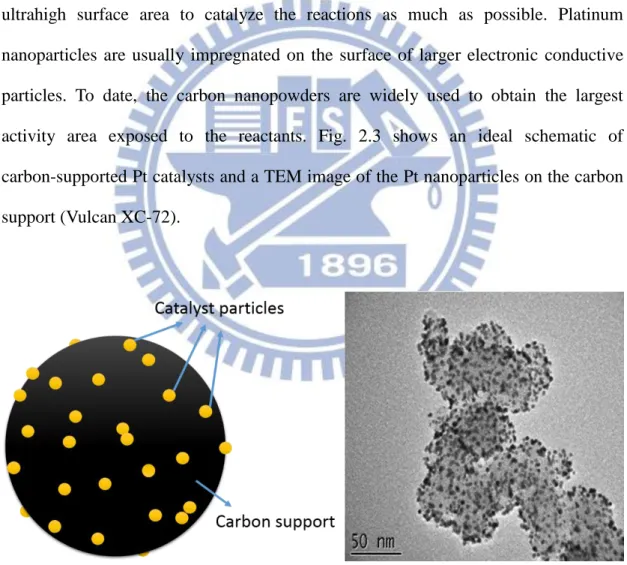
In PEFCs, catalysts play a very important role to overcome the activation energies of reactions. Catalysts are known to help the hydrogen and oxygen split into hydrogen and oxygen atoms easier, and lower the potential barrier in both oxidation and reduction reactions. The state of the art catalysts for both the anode and cathode is the platinum. However, the cost of platinum is very high, and in order to reduce the system cost, the platinum catalyst is often formed as nano-scaled particles with an ultrahigh surface area to catalyze the reactions as much as possible. Platinum nanoparticles are usually impregnated on the surface of larger electronic conductive particles. To date, the carbon nanopowders are widely used to obtain the largest activity area exposed to the reactants. Fig. 2.3 shows an ideal schematic of carbon-supported Pt catalysts and a TEM image of the Pt nanoparticles on the carbon support (Vulcan XC-72).
Figure 2.3 The ideal schematic of platinum particles impregnated on the carbon
support and a TEM image of platinum nanoparticles supported on the Vulcan XC-72 carbon 11.
11
In the electrode, an effective “three-phase contact region” between the electrolyte, reactant fuel, and electrode catalyst is necessary for transporting electrons, ions, and fuel efficiently to enhance the catalytic activity of the electrode. Figure 2.4 shows a simple structure diagram of a PEFC electrode. To fabricate the membrane electrode assembly, carbon-supported catalysts are usually impregnated on a carbon cloth or carbon paper first. Subsequently, the catalyzed carbon is laminated with the proton exchange membrane, and the other side of the electrode is processed with the same method. The carbon cloth or carbon paper allow the diffusion of the gas fuel (the hydrogen and oxygen) to the catalyst sites and are therefore known as the gas diffusion layer. The porous and conductive carbon materials not only render faster diffusion of gas, but also provide more connect regions for transporting electrons to the external circuit. A thin layer of electrolyte is also coated on the catalyst, promoting the so-called “three-phase contact region” and increasing the performance of the MEA.
12
2.2 Electrochemical reactions in PEFCs
2.2.1 Over all reactions and ideal cells voltage
In fuel cells, the driving force is the change of thermodynamic Gibbs free energy of formation, ΔGf, between the reactant and product,
ΔGf = Gf product - Gf reactant
In PEFCs (hydrogen/oxygen fuel cells), the overall reaction is H2 + 1/2 O2 → H2O
This means that the “product” is one mole of water, and one mole of hydrogen and half mole of oxygen are the “reactants”, so the Gibbs free energy change can be written in
Δgf = (gf)H2O - (gf)H2 - 1/2 (gf)O2
where the gf is the Gibbs free energy of formation per mole, and its value varies
according to the temperature and states. The operating temperature of a PEFC is around 80℃, and the Δgf is about -228 kJ/mole. In this electrochemical reaction, two
electrons are involved for each mole of water formation. If all electrons release their energy, the charge flow is 2N × -1.602 × 10⁻¹⁹ (C) = -2F (C), where N is the
Avogadro’s number and F is the Faraday constant. The electric work done by moving this charge can be presented as
W = charge × voltage = -2FE (J)
If the reaction is reversible with no energy losses, the Gibbs free energy can be converted to the electric work entirely. Then the equation is derived as
Δgf = -2FE, then the voltage is
13
And this equation gives the reversible open circuit voltage (OCV) of the hydrogen/oxygen fuel cells. So the ideal hydrogen/oxygen fuel cell voltage operating at 80℃ equals to
E = -228 kJmol-1 / (2 × 96485 C mol-1) = 1.18 V
2.2.2 Oxygen reduction reaction
Fuel cells performance is controlled by the reaction rate at the anode and the cathode. In PEFCs, the oxygen reduction reaction (ORR) at the cathode is the “rate-determining step” due to its slow kinetics because of the difficulty in the bond-breaking of the O=O double bond in oxygen molecules. In contrast to the anode reaction, the hydrogen oxidation reaction (HOR), the reaction rate of ORR is much lower than that of HOR by several orders on the Pt catalyst 13. So if we enhance the
cathode ORR kinetic reaction rate, the performance of PEFCs is expected to be improved.
The oxygen reduction reaction is known to proceed in two distinct paths: “peroxide pathway” (which transfers two electrons), and “direct four-electron pathway” 14. Peroxide pathway: A. In acid electrolyte: O2 + 2H+ + 2e- → H2O2 E0 = 0.670 V vs. NHE H2O2 + 2H+ + 2e- → 2H2O E0 = 1.770 V vs. NHE 2H2O2 → 2H2O + O2
14
B. In alkaline electrolyte:
O2 + H2O + 2e- →HO2- + OH- E0 = -0.065 V vs. NHE
HO2- + 2H2O + 2e- → 3OH- E0 = 0.867 V vs. NHE
2 HO2- → 2OH- + O2
Direct four electron pathway: A. In acid electrolyte:
O2 + 4H+ + 4e- → 2H2O E0 = 1.229 V vs. NHE
B. In alkaline electrolyte:
O2 + 2H2O + 4e- → 4OH- E0 = 0.401 V vs. NHE
If the oxygen reduction reaction is occurring through the peroxide pathway, some intermediate products – H2O2 might desorb from the catalyst surface, which means
that the oxygen reduction reaction does not react completely. Thus the electricity power and performance are expected to be decreased. Therefore, it is reasonably to conclude that if all oxygen are reduced through the direct four electron pathway into water, we could get a better conversion efficiency. To examine whether a ORR goes through the 2-electrons or 4-electron paths, we can use a rotating ring-disk electrode (RRDE) to determine the formation of H2O215, or by calculating the electron-transfer
15
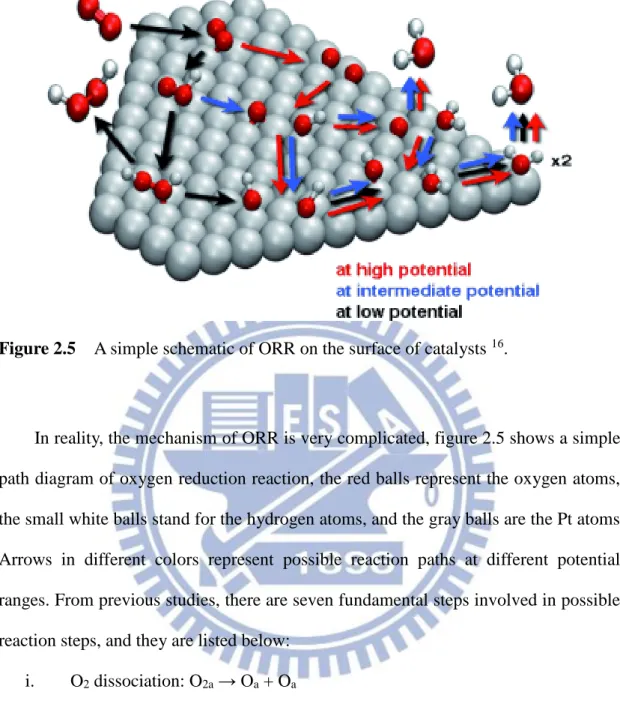
Figure 2.5 A simple schematic of ORR on the surface of catalysts 16.
In reality, the mechanism of ORR is very complicated, figure 2.5 shows a simple path diagram of oxygen reduction reaction, the red balls represent the oxygen atoms, the small white balls stand for the hydrogen atoms, and the gray balls are the Pt atoms. Arrows in different colors represent possible reaction paths at different potential ranges. From previous studies, there are seven fundamental steps involved in possible reaction steps, and they are listed below:
i. O2 dissociation: O2a → Oa + Oa
ii. OH formation: Oa + Ha →OHa
iii. H2O formation: OHa + Ha → H2Oa
iv. OOH formation: O2a + Ha → HOOa
v. OOH dissociation: HOOa → OHa + Oa
16
vii. O hydration: Oa + H2O → 2OHa
All these mechanisms are possibly-involved and their rates depend on the types of electrolytes, catalyst materials, and operating environments. To find the most possible reaction path, many simulation by different approached have been engaged in calculating the energy barriers for all possible steps of ORR.
17
2.3 Electrocatalysts for oxygen reduction reaction
2.3.1 Cathode catalysts for ORR
The barriers for PEFCs to scale up and commercialize are the high cost of using noble metal-platinum as the catalyst at both anode and cathode to catalyze the HOR and ORR separately. Specifically at the cathode of PEFCs, the electro-catalytic ability for the ORR has received considerable attention because its intrinsically slow kinetics
17-21, considering as the rate determine step, limits commercial viability of PEFCs.
Therefore, it had a lot of interests to develop nanoscale catalysts to improve the ORR activity which are compatible and even superior than that of Pt. Many materials have been explored for the ORR activities in acidic electrolytes. For example, metals like Pd and Fe, organometallic complexes like cobalt phthalocyanines (CoPc) and Fe-N4,
transition metal oxides like MnO2 and TiOx, as well as chalcogenides like
W11-Co43-Se46 and Co9S8 have been reported with various results 22-30. Among them,
the Pt still has received the most attention in recent years because of its impressive ORR activities and chemical stability. So far, Pt in a wide variety of nanostructures/morphologies have been synthesized and studied for ORR actions 31-33. The Pt is a noble metal and its cost is a concern for the commercialization of fuel cells. Therefore, substantial efforts have been devoted to identify secondary elements to alloy with the Pt for cost reduction and possible ORR enhancements. The study of binary PtM (M=Cu, Ni, Co, Fe, etc.) has produced significant results and the Pt3Ni(111) has emerged as the leading candidate as an ORR electrocatalyst in acidic
18
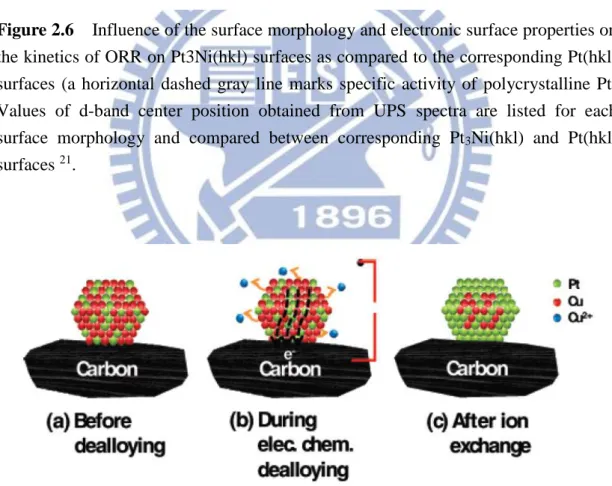
unique surface geometry and electronic structure lead to the impressive ORR activities and stabilities. Another approach to enhance the ORR activity is to synthesize electrocatalysts in distinct core-shell nanostructures. In this way, inexpensive elements can serve at the core whereas the expensive noble ones occupy the shell and be responsible for the ORR actions. This can be realized by a copper under potential deposition technique in which the Pt is deposited via a galvanic displacement reaction to form a mono-layered film for extremely low Pt utilization rate 43-46. An alternative route to fabricate desirable core-shell nanostructures is the dealloying method. The dealloying process entails an electrochemical step to induce a selective dissolution of less noble element from a binary Pt-based electrocatalyst and consequently, produces a surface enriched with the Pt atoms. According to Strasser et al., the dealloyed nanocatalysts reveal a compressive strain in the Pt-enriched shell that modifies the d-band structure of the Pt atoms and therefore, the electrocatalytic activities for ORR are greatly enhanced 47. To date, many dealloyed nanoparticles including binary Pt-Cu, Pt-Co, and Pt-Ni, and tertiary Pt-Cu-Co, PtNi3M (M=Cu, Co,
Fe, Cr) have been synthesized and evaluated for ORR activities 48-56. Fig. 2.7 shows a simple illustration of dealloying process to of a dealloyed Pt-Cu catalyst synthesis.
19
Figure 2.6 Influence of the surface morphology and electronic surface properties on
the kinetics of ORR on Pt3Ni(hkl) surfaces as compared to the corresponding Pt(hkl) surfaces (a horizontal dashed gray line marks specific activity of polycrystalline Pt) Values of d-band center position obtained from UPS spectra are listed for each surface morphology and compared between corresponding Pt3Ni(hkl) and Pt(hkl)
surfaces 21.
Figure 2.7 Illustration of the stepwise in-situ preparation of dealloyed Pt-Cu
electrocatalysts by voltammetric selective dissolution of Cu from a Pt25Cu75 precursor
20
Chapter 3 Experimental
3.1 Pt
2Os on carbon supports catalysts synthesis
Carbon-supported Pt2Os nanoparticles were prepared in a chemical reduction
route. First, 80 mg of carbon powders (particle size <50 nm, Sigma Aldrich) were suspended in 50 mL of deionized water at 80 °C. Next, 36 mg of H2PtCl6·6H2O
(UniRegion Bio-Tech) and 17 mg K2OsCl6 (Sigma-Aldrich) were dissolved in 50 mL
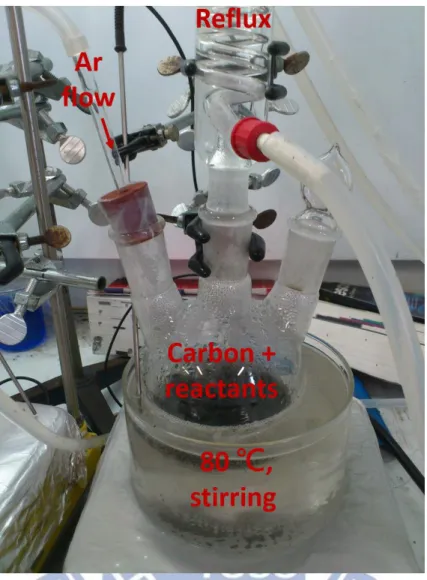
of deionized water (molar ratio of Pt/Os = 2), and the solution was added to the carbon suspension. Subsequently, 21 mg of citric acid was added as a chelating agent. The mixture was stirred for 30 min at 80 °C in an argon flow under reflux to produce a homogeneous suspension. Afterward, 76 mg of NaBH4 was added serving as a
reducing agent, and the mixture underwent further stirring for 2 hr at 80 °C in an argon flow under reflux to ensure the complete reduction of Pt and Os ions, and the formation of Pt2Os nanoparticles impregnated on the carbon powders. The
as-synthesized sample was labeled as Pt2Os/C. Next, the Pt2Os/C powders were
filtered and thoroughly washed to remove residual chloride ions. After drying at 25 °C in air for 8 hr, a reduction treatment at 250 °C in a hydrogen flow (100% H2) was
performed for 2 hr. The effective metal loading of the Pt2Os nanoparticles was 20
21
22
3.2 Electrochemical analysis
10 mg of Pt2Os/C powders underwent an ultrasonication mixing for 5 min in a
solution containing 3 mL of deionized water, 2 mL of ethanol, and 2 μL of 5 wt% Nafion ionomer solution (Sigma-Aldrich) to render a homogeneous ink dispersion (shown in Fig. 3.2). Subsequently, 15 μL of the ink dispersion was deposited on a glassy-carbon rotation disk electrode (RDE) serving as a working electrode (Pine Research, electrode diameter is 5 mm and the electrode area is 0.1963 cm2). To initiate the selective dissolution of Os atoms from the Pt2Os nanoparticles, known as a
dealloying process, multiple cyclic voltammetry (CV) scans were imposed between -0.2 and 0.8 V at 50 mV s-1 in a 50 mL of deaerated 0.1 M aqueous HClO
4 solution.
After the dealloying process, the sample was labeled as DA-Pt2Os/C. The coulombic
charge associated with the hydrogen underpotential deposition region (-0.2 to 0.2 V vs. Ag/AgCl) was estimated and divided by 210 μC cmPt-2 58,59 to obtain the
electrochemical active surface area (ECSA) for the Pt2Os/C and DA-Pt2Os/C. To
explore the electrocatalytic activities for ORR, CV scans between -0.2 and 0.8 V were performed at 10 mV s-1 in 50 mL of 0.1 M aqueous HClO
4 solution. Prior to the ORR
experiments, the HClO4 aqueous solution was bubbled with oxygen for 30 min to
ensure it was fully saturated with the oxygen. Durability tests were performed using CV scans at 50 mV s-1 between 0.36 and 0.76 V in 50 mL of 0.1M HClO4 aqueous
solution. The durability test lasted for 10,000 cycles and the electrolyte was exposed to the ambient air throughout the entire cycles. The electrochemical measurements were performed at 25 °C in a three-electrode arrangement using a Solartron 1287A
23
electrochemical interface. A Ag/AgCl and Pt foil (15 cm2) were used as the reference
and counter electrodes, respectively. The potential for the reversible hydrogen electrode (RHE) was -0.289 V (vs. Ag/AgCl). In our figures, all potentials were plotted against the RHE. Lastly, identical electrochemical tests were performed on commercially available Pt/C (20 wt% Pt on Vulcan XC72R, BASF) for comparison purpose.
24
Figure 3.3 Three-electrode electrochemical system with a rotating disk electrode,
where the WE is the working electrode, the CE is the counter electrode, and the RE is the reference electrode (Ag/AgCl).
25
3.3 Materials characterization
A high-resolution transmission electron microscope (TEM; JEOL JEM3000F) was employed to observe the morphologies, sizes, and distributions of the Pt2Os/C
and DA-Pt2Os/C. The structural and chemical investigations of the Pt2Os and DA-
Pt2Os nanoparticles were conducted using a JEOL spherical aberration corrected
scanning transmission electron microscope (ARM 200F) with an Oxford energy dispersive spectrometer (EDS) X-max 80 mm2, in which the Lα and Mα signals from
the EDS were recorded to determine the spatial distributions of the Pt and Os atoms in the Pt2Os and DA-Pt2Os nanoparticles. A scanning electron microscope (SEM;
JEOL JSM6500F) and a total reflection X-ray fluorescence spectrometer (TRXF; Bruker S2-PICOFOX) were adopted to estimate the atomic ratio of Pt/Os in the Pt2Os
and DA-Pt2Os nanoparticles. The exact Pt amounts in our samples were obtained
using an inductively coupled plasma mass spectrometer (ICP-MS; Agilent 7500ce). A X-ray diffractometer (XRD; Bruker D2 Phaser) equipped with a Cu Kα radiation source (λ =1.54 Å) was used to identify relevant phases and crystal sizes for both Pt2Os/C and DA-Pt2Os/C.
26
Chapter 4 Results and discussion
4.1 Material structure characterization
4.1.1 TEM morphologies of catalysts
In the literatures, binary PtxOsy nanoparticles have been prepared via wet chemical
routes such as chemical reduction and electrochemical deposition 3,60. Due to a notable difference in the redox potentials between the Pt, Os, and their corresponding ions, the careful control in the formation stage is essential in order to obtain PtxOsy
nanoparticles with desirable compositions. Our reflux approach enabled the synthesis of stoichiometric Pt2Os nanoparticles in large quantity. Fig. 4. 1 displays the TEM
images of Pt/C, Pt2Os/C, and DA-Pt2Os/C, respectively. For both Pt/C and Pt2Os/C,
uniform distributions of irregularly-shaped nanoparticles with moderate aggregation were observed, and their average sizes were 2.3±0.4 and 3.1±0.7 nm. The slight increment in sizes and wider distribution for the Pt2Os/C over Pt/C were possibly due
to the reflux process that allowed for multiple events of nucleation and growth. After the dealloying treatment, the DA - Pt2Os/C showed a similar morphology and
27
Figure 4.1 The TEM images of (a)Pt/C, (b)Pt2Os/C, and (c)DA-Pt2Os/C.
4.1.2 XRD and chemical composition analysis
Fig. 4.2 demonstrates the XRD patterns of Pt/C, Pt2Os/C, and DA-Pt2Os/C, as
well as standard Pt (JCPDS: 004-0802) and Os (JCPDS: 006-0662) for comparison purpose. For the Pt/C sample, a broad peak between 25° and 30° was attributed to the interference from the carbon support. In addition, the diffraction signals located at 39.6°, 46.2°, and 67.3° were identified as the (111), (200), and (220) peaks of the Pt
28
face-center-cubic structure. These diffraction signals revealed characteristic peak-broadening phenomenon because of the finite Pt particle size. We estimated the Pt particle size of 2.09 nm using the Debye-Scherrer equation on the (111) peak. For the Pt2Os/C sample, similar diffraction signals were obtained and they were located at
41°, 47.4°, and 69°, respectively. Because the size of the Os atom (1.35 Å ) is smaller than that of Pt (1.39 Å ), in Pt2Os nanoparticles, the Os atoms were likely to adopt the
fcc Pt structure and form a homogeneous solid solution with the Pt. As a result, the Pt2Os diffraction peaks were expected to shift slightly to larger angles, which is
consistent with our results. Using the Debye-Scherrer’s equation on the (220) peak, the size of the Pt2Os nanoparticle was estimated at 3.65 nm.
Figure 4.2 The X-ray diffraction patterns of Pt/C, Pt2Os/C, and DA-Pt2Os/C, as
29
According to the binary phase diagram of Pt and Os, a homogeneous solid solution is present when the molar ratio for the Os atoms is in the range of 0~20% 3,4. Above 20%, the Os atoms precipitate out as a hcp phase with limited solubility of Pt. However, in the case of nanoparticles synthesis, it has been confirmed that a single fcc phase is still possible with a Pt:Os molar ratio of 1:1.1 61. Therefore, we believed
that our Pt2Os nanoparticles existed as a single fcc phase. The hcp Os phase has
characteristic peaks at 38°, 42°, 44°, 58°, and 69° (JCPDS: 006-0662). From the diffraction peak of Pt2Os/C, the possibility of minor presence of Os peaks at 42° and
44° cannot be ruled out. However, we want to point out that we did not observe the presence of single-phase Pt and Os nanoparticles from STEM images (to be discussed in Fig. 4.4) so we could reasonably conclude that the as-synthesized Pt2Os is a fcc
single crystal.
In the formation stage of Pt2Os nanoparticles, the Pt atoms exhibited a higher
redox potential and therefore were expected to be reduced first forming nuclei relatively-enriched with the Pt atoms. Accordingly, the Os atoms became enriched in surface. Therefore, we surmised that the composition of the Pt2Os nanoparticles might
be slightly segregated into a Pt-enriched state at core and an Os enriched state at shell so the resulting diffraction signals between 41 and 47° became somewhat broadened. However, the segregation behavior was likely to be rather subdued as line-scans from STEM (Fig. 4.4(a)) indicated an alloyed state. After the dealloying process, the broadened diffraction signals between 41 and 47° became sharpened considerably. After the removal of Os atoms from the surface of the Pt2Os nanoparticles, the
diffraction peak became clearly Pt-dominant signals from the (111), (200), and (220) planes.
30
Table 1 Structural parameters and composition of Pt/C and Pt2Os/C catalysts
a. Mean particle size calculated from Debye-Scherrer equation on Pt (111) and Pt2Os (220) planes
b. Mean particle size observed from TEM images. c. Atomic ratio determined by TXRF.
d. Atomic ratio determined by SEM-EDS.
In general, the X-ray absorption spectroscopy (XAS) is able to detect the segregation phenomenon in binary nanoparticles because the bonding distance, the number, and the type of the neighboring atoms of the absorbing atoms are different depending whether they are residing at the core or on the shell. However, the difference in the atomic number between the Pt and Os is 2, and this minute value renders their LIII absorption peaks (11,564 and 10,871 eV for the Pt and Os atoms,
respectively) interfere with each other during XAS analysis and thus the detailed bonding information cannot be determined accurately.
Table 1 lists the particle size of our samples from XRD diffraction signals and TEM images, as well as results from the composition determination. The estimation of nanoparticles sizes using the Debye-Scherrer equation was rather consistent with those from TEM images. In addition, composition analysis from the TXRF and SEM -EDS confirmed that the atomic ratios of Pt/Os were 68/32 and 67/33 for the Pt2Os
nanoparticles. These values were very close to the stoichiometric ratio of 2:1. The
Sample Peak angle (2θ) Lattice constant (Å ) Particle sizea (nm) Particle sizeb (nm) Atomic ratioc Pt/Os Atomic ratiod Pt/Os Pt/C 39.62 3.94 2.09 2.3±0.4 - - Pt2Os/C 41.01 3.81 3.65 3.1±0.7 68/32 67/33 DA-Pt2Os/C 40.43 3.85 3.70 3.05±1.0 93/7 81/19
31
atomic ratios of DA-Pt2Os from SEM-EDS was 81/19. This result substantiated
our dealloying process to covert the as-synthesized Pt2Os into Pt4Os. It is noted that
the dalloying process removed the Os atoms selectively from the surface of the Pt2Os
nanoparticles and consequently, the surface regime became fully-depleted with the Os atoms. Hence, the Pt4Os should be recognized as the average composition of the
dealloyed sample.
4.1.3 Dealloying treatment analysis
Figure 4.3 The CV curves of Pt2Os/C undergoing the dealloying treatment of 3rd,
10th, 50th, and 60th cycles, respectively. The electrolyte was deaerated 0.1 M aqueous HClO4 solution and the scan rate was 50 mV s-1. The highlighted area was used to
32
Fig. 4.3 shows the CV curves for Pt2Os/C in deaerated 0.1 M HClO4 aqueous
solution at the 3rd, 10th, 50th, and 60th cycles, respectively. For the CV curve of the 3rd cycle, two separate oxidation signals were observed; one minor peak at 0.7 V and the other strong one starting at 0.85 V. From the previous studies on the Os systems, the oxidation peak at 0.7 V is attributed to the oxidation of Os atoms to OsO2 whereas the
oxidation peak of 0.85 V is associated with the oxidation of OsO2 to OsO4 62,63.
According to Greedan et al. 64, in an aqueous solution the OsO
2 is insoluble but the
OsO4 can be dissolved moderately. Therefore, in our case we observed a relatively
strong oxidation current at 0.85 V in the anodic scan but a subdued current at 0.3-0.5 V in the cathodic scan as most of the OsO4 was dissolved in the electrolyte and thus
was unable to participate in the subsequent reduction process in the cathodic scans. It is noted that our results of broad reduction currents are consistent with a previous report by Rhee et al. in which the Os nanoislands were spontaneously deposited and electrochemically stripped from a Pt (111) single crystal substrate 65. It is noted that the Pt oxidation also occurred at 0.8 V and the corresponding reduction peak was located at 0.75 V during the cathodic scan (as shown in the inset of Fig. 4.3). Hence, in our case at voltage above 0.85 V, the oxidation of OsO2 to OsO4, and the oxidation
of Pt were both responsible for the anodic currents.
Upon further cycling, the currents associated with the Os oxidation and reduction were progressively reduced. This confirmed that the Os atoms in the Pt2Os
nanoparticles were selectively removed resulting in a surface gradually enriched with the Pt atoms. This dealloying process was effective until the 50th CV as further CV cycles engendered a negligible difference in the CV curves. At this stage, the remaining Os atoms exposing to the electrolyte was rather limited, and the out-diffusion of the Os atoms from the core was considered unlikely due to the
33
relatively low working temperature (25 °C) and short dealloying time (33 min). In conjunction with the steady loss of Os atoms from the Pt2Os nanoparticles, more Pt
atoms were exposed to the electrolyte and consequently, a larger ECSA was obtained. The areas used to estimate the ECSA was highlighted at a potential window of 0.09 and 0.35 V, and the ECSA value was determined by the highlighted area divided by 210 μC cmPt-2 58,59. From Fig. 4.3, the respective ECSA values were 0.32, 0.66, and
1.13 cmPt2 for the 3rd, 10th, and 50th cycle, respectively. These increasing ECSA values
substantiated that the de-alloying process was achieved successfully that rendered a greater number of Pt atoms on the surface. Because the CV profiles after 50 cycles revealed negligible variation, we selected the 50th cycle as the standard de-alloying treatment for following tests.
4.1.4 Structure analysis of single Pt
2Os particle
The elemental profiles of Pt and Os in the Pt2Os and DA-Pt2Os nanoparticles
were determined by the STEM-EDS measurement with a probe size of about 1.5Å . Fig. 4.4(a) exhibits a STEM image and the corresponding line-scan profile cross a Pt2Os nanoparticle in 4.5 nm size. The result suggests an alloy status for the
as-synthesized Pt2Os nanoparticles. Fig. 4.4(b) shows a STEM image and the
scanning profile of a DA-Pt2Os nanoparticle of 7 nm in diameter. Apparently, the Os
atoms residing on the surface regime were mostly removed and the DA-Pt2Os
revealed a quasi-core-shell structure in which the core retained some Os atoms whereas the shell was occupied by the Pt atoms exclusively.
34
Figure 4.4 The HR-STEM images and EDS line-scans of (a) Pt2Os and (b) DA-
35
4.2 Electrochemical analysis
4.2.1 Electrochemical activity for ORR
Fig. 4.5 demonstrates the ORR CV curves in apparent current density for Pt2Os/C,
DA-Pt2Os/C, and Pt/C. In the literatures, at potential below 0.6 V, the ORR response
is under mass transport control limited by the diffusion of the dissovled oxygen in the electrolyte whereas at potential between 0.8 and 1 V, the ORR response is dominated by kinetics (the electrocatalytic activties of electrocatalysts involved in the ORR process) 66. Hence, a simple method to quickly evaluate the ORR behavior of a potential electrocatalyst is the reading of half-wave potential, which is defined as the potential at which the magnitude of the current is half of the limiting current. In gerneal, the larger the half-wave potential, the greater the ORR activity. As shown, the half-wave potentials for the Pt/C, Pt2Os/C, and DA-Pt2Os/C were 891, 837, and 908
mV, respectively. Moreover, the DA-Pt2Os/C exhibited the highest on-set potential
of 1 V, and this provided another evidence of better electrocatalytic ability among these samples. It is noted that the diffusion-limiting current for the Pt2Os/C and DA-
Pt2Os/C at a rotation speed of 1600 rpm was 5.23 mA cm-2, a value that was rather
close to that of Pt3Ni (5.36 mA cm-2) 67. This consisentce indicated that our ORR
36
Figure 4.5 The ORR curves of Pt/C, Pt2Os/C, and DA-Pt2Os/C in apparent current
density. The electrolyte was oxygen-saturated 0.1 M aqueous HClO4 solution and the
scan rate was 10 mV s-1.
Fig. 4.6(a) demonstrats the ORR curves from the DA-Pt2Os/C at various rotation
speeds of RDE. Among these curves, the ORR responses at voltage below 0.6 V were stabilzed at limiting currents whose values were proportional to the rotation speed as expected. To extract the kinetic information, we employed the Koutecky-Levich equation listed below 68,
1/i = 1/ikinetic + 1/idiffusion limit = 1/ikinetic + 1/0.62nFADO22/3ω1/2v-1/6CO2 (1)
where the i is the experimentally-measured current, the ikinetic is the kinetic current
assoicated with the ORR activity of DA-Pt2Os/C, the n is the number of electron
37
area on the RDE (0.196 cm2), the D
O2 is the diffusivity of dissolved O2 in the 0.1 M
aqueous HClO4 solution (1.93 × 10⁻⁵ cm2 s-1) 37, the ω is the rotation speed of the RDE,
the v is the kinematic viscosity of the 0.1 M aqueous HClO4 solution (1.009 × 10⁻²
cm2 s-1) 69, and the CO2 is the concentration of dissolved O2 in the 0.1 M aqueous
HClO4 solution (1.26 × 10⁻³ mol L-1) 37. Fig. 4.6(b) provides the Koutecky-Levich
plots at different potentials. Obviously, these curves showed consistency and the average slope was 11.105 mA-1 s-1/2. Thus, the resulting n value became 3.94.
Therefore, we concluded that the DA-Pt2Os/C nanoparticles adopted a four-electron
38
Figure 4.6 (a) The ORR curves of DA-Pt2Os/C at various RDE rotation speeds.
The electrolyte was oxygen-saturated 0.1 M aqueous HClO4 solution and the scan rate
39
The values of ik obtained from the Koutecky-Levich equation were used to
calculate the mass activity and specific activity shown in Fig. 4.7. These Tafel plots were obtained using ik values from 0.95 to 0.8 V divided by the effective mass of the
Pt in the working electrode (from ICP-MS) and ECSA (cmPt2) values from Fig. 4.3.
For the Pt/C, its mass activity and specific activity at 0.9 V were 0.14 mA μgPt-1 and
0.28 mA cmPt-2, respectively. These values were comparable to what were reported in
the literatures for the Pt nanoparticles in simialr sizes 70. However, the Pt 2Os/C
exhibited a lower mass activity (0.05 mA μgPt-1) and a greater specific activity (0.52
mA cmPt-2), as compared to those of Pt/C. The reduced mass activity is attributed to its
relatively larger size as compared to that of Pt/C and the predominant share of the Pt atoms was residing at the core. However, the 250% increment in the specific activity suggested the complementary role of Os atoms to the Pt atoms for ORR activity. This is because part of the surface of the Pt2Os nanoparticle was occupied by the Os atoms
and those Os atoms were oxyphilic and promote the ORR process via bifunctional model and electronic mechanism. In the bifunctional model, the Os atoms exhibit a strong affinity toward the adsorption of OH and thus, leads to substantially decrease in the Pt-OH coverage 9. In general, a larger percentage of OH coverage on the Pt
sites is considered disadvantgaeous for ORR action. According to Zhang et al. , two OH species can adsorb onto a single Os atom and subsequently, initiates a spontaneous breakup of the O-H bonding forming an oxygen atom and water 9.
40
Figure 4.7 The Tafel plots of the ORR curve (Fig. 4.5) in (a) mass activity and (b)
41
Once the dealloying process was completed, the DA-Pt2Os demonstrated a
significantly-enhanced mass activity (0.29 mA μgPt-1) and specific activity (1.03 mA
cmPt-2). It is because the removal of Os atoms engendered a Pt-enriched surface with a
substantially-enlarged ECSA. This surface-roughening behavior has been reported in the literatures for dealloying treatments 71. The contributory role played by the Os
atoms is critical for the impressive ORR activity which can be explained mostly by the electronic effect because the electronic structure of the surface Pt atoms was expected to be alatered by the Os atoms underneath. It is noted that the mass activity and specific activity of DA-Pt2Os/C were comparable to other prominent binary
nanoparticles such as PtNi and PtCo. In specific activity, the DA - Pt2Os/C
demonstrated a greater number over those of cubic Pt3Ni nanoparticles (0.51 mA
cmPt-2) 35, activated Pt3Ninanoparticles (0.65 mA cmPt-2) 34, and octahedral Pt3Ni
nanoparticles (0.85 mA cmPt-2) 36, but lower than those of acid-treated Pt3Co
nanoparticles after 1000 K heat treatment (1.4 mA cmPt-2) 37, and ordered intermetallic
Pt3Co nanoparticles (1.1 mA cmPt-2) 42. In mass activity, the DA-Pt2Os/C exhibited
comparable values to those of cubic Pt3Ni nanoparticles (0.3 mA μgPt -1) 35, activated
Pt3Ni-sono nanoparticles (0.33 mA μgPt-1) 34, acid-treated Pt3Co nanoparticles after
1000 K heat treatment (0.35 mA μgPt-1) 37, and ordered intermetallic Pt3Co
nanoparticles (0.31 mA μgPt-1) 42, but lower than that of octahedral Pt3Ni nanoparticles
(0.53 mA μgPt-1) 36. These results suggest that the DA-Pt2Os/C sample is a promising
electrocatalyst for ORR and more engineering work to modify its surface state and morphology might lead to further enhancement in specific and mass activities.
42
4.2.2 Durability performance
For durability tests, the DA-Pt2Os and Pt/C samples were subjected to multiple
CV scans in a potential window of 0.65 and 1.05 V at 50 mV s-1 in a 0.1 M aquesous HClO4 solution following procedures used by Wang et al. 72. Fig. 4.8(a) and Fig. 4.8(b)
show the ORR responses before and after the durability test for DA-Pt2Os/C and
Pt/C, respectively. Apparenttly, for both samples there appeared a very subdued degradation during the durability tests, and both the onset potentials and diffusion-limiting currents remained almost unchanged. The minor degradation is manifested in the slight negative shift of the half-wave potential. For example, we recorded a shift of 5 and 9 mV for DA-Pt2Os/C and Pt/C, respectively. These CV
curves suggested that the stability of DA-Pt2Os/C was comparable to that of
43
Figure 4.8 The ORR curves before and after the durability test for (a) DA-Pt2Os/C
and (b) Pt/C. The electrolyte was oxygen-saturated 0.1 M aqueous HClO4 solution
44
To further validate the stability of the DA-Pt2Os/C and Pt/C, we carried out the
ECSA measurements before and after the durability tests, and the resulting CV curves are exhibited in Fig. 4.9. After the durability tests, the ECSA of DA-Pt2Os/C was
reduced 10.9% (from 1.46 to 1.30 cmPt2), and a loss of 11.1% in the mass activity
(0.27 to 0.24 mA μgPt-1, assuming the Pt loading remained constant and the loss was
attributed to the minor reduction of ik at 0.9 V from Fig. 4.8) was observed. We
reasonably assumed there was negligbile physical detachment of electrocatalysts from the RDE during the durability tests because the diffusion-limiting currents were constant. In contrast, the Pt/C revealed a loss of 14.7% in the ECSA (from 3.06 to 2.61 cmPt-2) and a loss of 24.64% in the mass activity (0.142 to 0.107 mA μgPt-1).
45
Figure 4.9 The CV curves of (a) DA-Pt2Os/C and (b) Pt/C in deaerated 0.1 M
aqueous HClO4 solution at a scan rate of 50 mV s-1. These curves were used to
46
Chapter 5 Conclusion and future work
Carbon-supported Pt2Os nanoparticles were synthesized from a wet chemical reflux process and underwent a dealloying treatment in which the as-synthesized Pt2Os/C experienced multiple CV scans to dissolve the Os atoms selectively from the
surface of the Pt2Os nanoparticles. XRD diffraction signals from the dealloyed sample
indicated a fcc phase and composition analysis suggested Pt4Os. Line scans from the STEM confirmed that the surface of Pt4Os was depleted with the Os atoms. The dealloyed sample revealed impressive ORR electrocatalytic abilites (0.29 mA μgPt-1 in
mass activity and 1.03 mA cmPt-2 in specific activity), as compared to commercially
available Pt/C and as-synthesized Pt2Os. In stability test, the dealloyed sample demonstrated better retention in cataltyic activities and smaller loss of ECSA as compared to those of Pt/C. In addition, we verified that the ORR steps occurring on the dealloyed sample was a four-electron process.
In the future, we will attempt to fabricate Pt3Os nanoparticles through different synthetic schemes and determine the exact composition (surface and bulk) of the dealloyed samples. Our objective is to vertify the segregation phenomenon on the Pt3Os surface which has been predicted by extensive DFT modeling. In addition, we
will measure the ORR electrocatalytic activities and validate the performance prediction by quantum mechanics computation.
47
Chapter 6 References
1 Kua, J. & Goddard, W. A. Oxidation of Methanol on 2nd and 3rd Row Group VIII Transition Metals (Pt, Ir, Os, Pd, Rh, and Ru): Application to Direct Methanol Fuel Cells. Journal of the
American Chemical Society 121, 10928-10941, (1999).
2 Ley, K. L. et al. Methanol Oxidation on Single‐Phase Pt‐Ru‐Os Ternary Alloys. Journal of
The Electrochemical Society 144, 1543-1548, (1997).
3 Zhu, Y. & Cabrera, C. R. Methanol Oxidation at the Electrochemical Codeposited Pt-Os Composite Electrode. Electrochemical and Solid-State Letters 4, A45-A48 (2001). 4 Gurau, B. et al. Structural and Electrochemical Characterization of Binary, Ternary, and
Quaternary Platinum Alloy Catalysts for Methanol Electro-oxidation1. The Journal of
Physical Chemistry B 102, 9997-10003, (1998).
5 Liu, R. et al. Potential-Dependent Infrared Absorption Spectroscopy of Adsorbed CO and X-ray Photoelectron Spectroscopy of Arc-Melted Single-Phase Pt, PtRu, PtOs, PtRuOs, and Ru Electrodes. The Journal of Physical Chemistry B 104, 3518-3531, (2000).
6 Kim, J., Kim, S. & Rhee, C. K. Preoxidation of CO on Os-Modified Pt(111): A Comparison with Ru-Modified Pt(111). Langmuir 27, 2044-2051, (2011).
7 Yu, T. H., Sha, Y., Merinov, B. V. & III, W. A. G. Improved Non-Pt Alloys for the Oxygen Reduction Reaction at Fuel Cell Cathodes Predicted from Quantum Mechanics. Journal of the
Physical Chemistry C 114, 11527–11533 (2010).
8 Stamenkovic, V. R., Mun, B. S., Mayrhofer, K. J. J., Ross, P. N. & Markovic, N. M. Effect of Surface Composition on Electronic Structure, Stability, and Electrocatalytic Properties of Pt-Transition Metal Alloys: Pt-Skin versus Pt-Skeleton Surfaces. Journal of the American
Chemical Society 128, 8813-8819, (2006).
9 Zhang, J. et al. Mixed-Metal Pt Monolayer Electrocatalysts for Enhanced Oxygen Reduction Kinetics. Journal of the American Chemical Society 127, 12480-12481 (2005).
10 O'Hayre, R. P., Cha, S.-W., Colella, W. & Prinz, F. B. Fuel Cell Fundamentals. (John Wiley & Sons New York, 2006).
11 Liu, Z., Gan, L. M., Hong, L., Chen, W. & Lee, J. Y. Carbon-supported Pt nanoparticles as catalysts for proton exchange membrane fuel cells. Journal of Power Sources 139, 73-78, (2005).
12 Litster, S. & McLean, G. PEM fuel cell electrodes. Journal of Power Sources 130, 61-76, (2004).
13 Zhang, J. PEM Fuel Cell Electrocatalysts and Catalyst Layers: Fundamentals and
Applications. (Springer, 2008).
48
Molecular Catalysis 38, 5-25, (1986).
15 Maruyama, J., Inaba, M. & Ogumi, Z. Rotating ring-disk electrode study on the cathodic oxygen reduction at Nafion® -coated gold electrodes. Journal of Electroanalytical Chemistry
458, 175-182 (1998).
16 Keith, J. A. & Jacob, T. Theoretical Studies of Potential-Dependent and Competing Mechanisms of the Electrocatalytic Oxygen Reduction Reaction on Pt(111). Angewandte
Chemie International Edition 49, 9521-9525, (2010).
17 Appleby, A. J. & Foulkes, F. R. Fuel Cell Handbook. (Van Nostrand Reinhold, 1989).
18 Kordesch, K. & Simader, G. R. Fuel Cells and Their Applications. (VCH: New York, 1996). 19 Brandon, N. P., Skinner, S. & Steele, B. C. H. Recent Advances in Materials for Fuel Cells.
Annual Review of Materials Research 33, 183-213, (2003).
20 Mehta, V. & Cooper, J. S. Review and analysis of PEM fuel cell design and manufacturing.
Journal of Power Sources 114, 32-53, (2003).
21 Stamenkovic, V. R. et al. Improved Oxygen Reduction Activity on Pt3Ni(111) via Increased Surface Site Availability. Science 315, 493-497 (2007).
22 Vracar, L. M., Sepa, D. B. & Damjanovic, A. Palladium Electrode in Oxygen‐Saturated Aqueous Solutions: Reduction of Oxygen in the Activation‐Controlled Region. Journal of The
Electrochemical Society 133, 1835-1839, (1986).
23 Jasinski, R. A New Fuel Cell Cathode Catalyst. Nature 201, 1212-1213 (1964).
24 Zagal, J., Bedioui, F. & Dodelet, J. N4-Macrocyclic Metal Complexes. (Springer, 2006). 25 Jahnke, H., Schönborn, M. & Zimmermann, G. in Physical and Chemical Applications of
Dyestuffs Vol. 61 Topics in Current Chemistry (eds F. P. Schäfer et al.) Ch. 4, 133-181
(Springer Berlin Heidelberg, 1976).
26 Wang, Y.-g. & Xia, Y.-y. A direct borohydride fuel cell using MnO2-catalyzed cathode and hydrogen storage alloy anode. Electrochemistry Communications 8, 1775-1778, (2006). 27 Kim, J.-H., Ishihara, A., Mitsushima, S., Kamiya, N. & Ota, K.-I. Catalytic activity of
titanium oxide for oxygen reduction reaction as a non-platinum catalyst for PEFC.
Electrochimica Acta 52, 2492-2497, (2007).
28 Lee, K., Zhang, L. & Zhang, J. Ternary non-noble metal chalcogenide (W–Co–Se) as
electrocatalyst for oxygen reduction reaction. Electrochemistry Communications 9, 1704-1708, (2007).
29 Sidik, R. A. & Anderson, A. B. Co9S8 as a Catalyst for Electroreduction of O2: Quantum Chemistry Predictions. The Journal of Physical Chemistry B 110, 936-941, (2005).
30 Morozan, A., Jousselme, B. & Palacin, S. Low-platinum and platinum-free catalysts for the oxygen reduction reaction at fuel cell cathodes. Energy & Environmental Science 4, 1238-1254, (2011).
31 Ahmadi, T. S., Wang, Z. L., Green, T. C., Henglein, A. & El-Sayed, M. A. Shape-Controlled Synthesis of Colloidal Platinum Nanoparticles. Science 272, 1924-1925, (1996).

![HPSH [ 氧化數平衡反應式係數 ]](data:image/gif;base64,R0lGODlhAQABAIAAAP///wAAACH5BAEAAAAALAAAAAABAAEAAAICRAEAOw==)