國 立 交 通 大 學
運輸科技與管理學系
博 士 論 文
永續運輸政策認知之實證研究
Empirical Study on Beliefs of Sustainable Transportation Policies
研 究 生:陳賓權
指導教授:張新立 教授
永續運輸政策認知之實證研究
Empirical Study on Beliefs of Sustainable Transportation Policies
研 究 生:陳賓權 Student:Pin-Chuan Chen
指導教授:張新立 教授 Advisor:Prof. Hsin-Li Chang
國 立 交 通 大 學
運 輸 科 技 與 管 理 學 系
博 士 論 文
A Dissertation
Submitted to Department of Transportation Technology and Management College of Management
National Chiao Tung University in Partial Fulfillment of the Requirements
for the Degree of
DOCTOR OF PHILOSOPHY
in
Transportation Technology and Management
July 2011
Hsinchu, Taiwan, Republic of China
永續運輸政策認知之實證研究
學生:陳賓權 指導教授
:張新立 教授
國立交通大學運輸科技與管理學系
摘要
本研究主要目的是針對永續運輸政策相關利害關係人(包括資深公務員及一 般民眾)的潛在心理構面進行探索,並發展一個概念性架構來衡量其對政策的認 知。我們綜合個人對政策信仰的主觀限制與客觀考量,概念化成為一種潛在心理 構面,進一步探究政策信仰有助於政策制定之始洞悉利害關係人的偏好,並可事 先預測政策執行的效果。本研究首先討論政策信仰的定義及可能影響政策信仰的 因素,接著導入一個有效的方法論來衡量資深公務員及一般民眾政策信仰;其次, 我們將透過實證研究來取得資深公務員及一般民眾對永續運輸的政策信仰,並比 較兩者之間的差異。 本研究使用 Rasch 模式針對資深公務員及一般民眾對永續運輸的政策信仰以 數量化的方式進行評估,研究結果發現,不管是資深公務員或一般民眾,都偏好 支持不會限制人民偏好或自由的政策,也都認為提供更有效、更友善的公共運輸 服務會比透過提高使用成本來限制私人運具使用更能達成永續運輸的目的。分析 資深公務員的社經特性則發現,在同一工作職務愈久、累積工作經驗愈多、擁有 權力愈大,則愈相信自己本身有能力制定政策、愈能夠判斷政策可行性,在執行 政策時也愈有信心。 進一步觀察一般民眾使用通勤工具與永續運輸政策信仰的關係,發現使用公 共運輸工具通勤者與一般大眾對永續運輸政策的偏好是相同的,兩者都認為「開 發新能源技術」是對永續運輸發展最有幫助的政策;相對地,對使用私人運具通 勤以及回答未來有意願減少私人運具使用者,則比一般大眾更相信「興建軌道運 輸系統」更能夠達成永續運輸環境的政策目標。 透過 DIF 分析,本研究同時發現使用公共運輸及沒有小汽車的人則分別比使用私人運具通勤與擁有小汽車者更認同「都會區實施擁擠收費」以及「提高油價 或停車費」等經濟管制措施。但相對地,使用私人運具通勤與擁有小汽車者會分 別比使用公共運輸及沒有小汽車的人更認同「提供即時資訊」、「補貼改裝 LPG 車」,以及「實施 ETC」等項目是有助於永續運輸。而是否擁有小客車的不同 族群透過 DIF 分析也得到前述相同的結果。 此外,本研究透過獨立樣本 t 檢定來檢視資深公務員與一般民眾對政策認知 的差異,結果發現兩者對「興建軌道運輸系統」的支持度一致,但對其他政策項 目則顯示資深公務員比一般民眾對政策是否有助於永續運輸發展的評估要更為 保守,這顯示一般民眾比較樂觀看待永續運輸政策的推動,也比參與政策制定的 資深公務員更支持永續運輸相關政策。 關鍵字:政策信仰、資深公務員、一般民眾、永續運輸、Rasch 模式、獨立樣本 t 檢定
Empirical Study on Beliefs of Sustainable
Transportation Policies
Student:Pin-Chuan Chen Advisors:Prof. Hsin-Li Chang
Department of Transportation Technology and Management
National Chiao Tung University
ABSTRACT
The aim of this study was to develop a conceptual framework to measure stakeholders’ policy beliefs on sustainable transportation implementation and then conduct experimental trials aimed at exploring stakeholders’ policy beliefs. We conceptualized policy belief as the combined effect of people’s objective constraints and subjective considerations, and viewed it as a latent trait. Exploring policy beliefs can provide insights regarding the mindset of those initiating policies and, thus, help predict outcomes prior to implementation. In this study, we first discuss the development of policy beliefs and the factors affecting their development. An effective approach for measuring senior officials’ and the general public’s policy beliefs is then suggested. Next, we describe an empirical study of the policy beliefs of senior officials and the general public, as well as a comparison of two groups of stakeholders.
This study quantitatively evaluated beliefs about sustainable transportation policies from senior officials and the general public by using the Rasch model since it has been intensively used in psychometric studies to estimate values on an interval scale based on ordinal responses. The results have shown that not only senior officials but also the general public believe that providing a more efficient and friendly public transportation service to attract people’s patronage would be more practicable than limiting private car use by increasing usage costs. For the senior officials, the longer an official is in a position the more experience and power he or she will attain; thus, seniority, experience, and power tend to drive policy success. As the officials become more senior they gain more administrative experience and the better they feel they can judge policy feasibility; they are more confident when implementing policy.
Furthermore, by extending the results based on respondents’ commuting modes we found the policy preference rankings from the public transport commuters are the
same as from the general public. “Developing new energy sources” was found to be the strategy in which both the private and the public transport commuters were most confident for implementing sustainable transportation policy. However, for people who commuted by private transport and were willing to act to mitigate private transport use, their policy belief regarding constructing rail transport systems to achieve sustainable transport was stronger than the public as a whole.
The study also revealed significant differences in policy beliefs between private and public transport commuters after DIF analysis. Public transport commuters are more confident than private transport commuters in the policies that raise usage costs, such as “Congestion Road Pricing on CBD,” “Increase gasoline prices to reduce car use,” and “Increase parking fees to reduce car use.” In addition, to achieve the goal of sustainable transportation, people who commute by private transport are more confident than public transport commuters in policies that “Provide instant traffic information to reduce driving time,” “Subsidize public to modify car by using LPG,” and “Implement electronic toll collection (ETC).” The findings and lessons learned from the two subgroups of people who owned and did not own a passenger car are the same as from the two subgroups of commuters using private and public transport.
In addition, independent samples t-tests were used to identify significant differences between senior officials and the public on each item. The result revealed that the public believes more strongly than the senior officials in the effectiveness of
building public transport centers as a means for achieving sustainable transportation.
Except for constructing rail transport systems, the public is more optimistic that these policies will benefit sustainable transportation than are the senior officials. In other words, it indicates that senior officials are more conservative than the public regarding whether these policies will benefit sustainable transportation.
Keywords: policy beliefs, the senior officials, the public, sustainable transportation, Rasch model, independent samples t-tests
A
CKNOWLEDGEMENTS
This dissertation would not have been possible without the contributions of several people. To all of these people, I wish to express my gratitude.
First and foremost, I would like to acknowledge and extend my heartfelt gratitude to my supervisor—Professor Hsin-Li Chang—for his vital encouragement and patient guidance, generous assistance, and invaluable advice, all of which have been of inestimable worth to the completion of my dissertation.
Second, my oral examination committee members, Prof. Wu-Cheng Chen, Kuo- Chang Wang, Huey-Kuo Chen, Cheng-Min Feng, and Hsun-Jung Cho, have also contributed insightful and critical comments and suggestions. In addition, my special thanks go to all the people who helped me and taught me so much during my several years of study at Nation Chiao-Tung University. I would also like to thank all of my classmates and friends who provided generous support and helpful advice during the past years. My thanks go out to Tian for his great work proofreading and editing. Over the years, I have benefited a great deal from everyone’s advice and suggestions.
Last but certainly not least, my heartfelt thanks go out to my beloved family for their unconditional support in allowing me to achieve this goal in life. My father, to whom this dissertation is dedicated, nurtured my intellectual curiosity. His compassion, generosity, and steadfast emotional support have been invaluable in helping me to focus on my academic pursuits. I regret that he could not see the fruits of this dissertation. I would also like to thank Vivian, as well as my sons, Jonathan and Joey, who, over all these past years, have always been there for me with their boundless love and whole-hearted support.
Empirical Study on Beliefs of Sustainable
Transportation Policies
T
ABLE OF
C
ONTENTS
ABSTRACT ... I ACKNOWLEDGEMENTS ... V TABLE OF CONTENTS ... VI LIST OF FIGURES ... IX LIST OF TABLES ... XC
HAPTER1 I
NTRODUCTION... 1
1.1 Research Motivations ... 1 1.2 Research Objectives ... 3 1.3 Research Framework ... 4C
HAPTER2 LITERATURE R
EVIEW... 6
2.1 Sustainable Transportation Concepts and Policy ... 6
2.2 Policy Beliefs ... 8
C
HAPTER3 M
ETHODS FORM
EASURING AL
ATENTT
RAIT... 12
3.1 Review of Item Response Theory ... 12
3.2 Brief Introduction of the Rasch Model ... 13
3.2.1 Formulation of the Rasch Model ... 13
3.2.2 Parameter Estimation of the Rasch Model ... 16
C
HAPTER4 E
XPLORINGS
ENIORO
FFICIALS’P
OLICYB
ELIEFSR
EGARDINGS
USTAINABLET
RANSPORTATION... 21
4.1 Introduction ... 21
4.2 Questionnaire Design ... 22
4.3 Rationale for Applying the Rasch Model for Measuring the Policy Belief ... 23
4.4 Design of the Empirical Exploration on Senior Officials’ Policy Beliefs ... 25
4.4.1 Empirical Questionnaire Design ... 25
4.4.2 Data Collection ... 27
4.4.3 Application of Rasch Analysis... 27
4.5 Findings and Interpretations ... 30
4.5.1 Findings for Item Parameters ... 30
4.5.2 Findings for Person Parameters ... 33
4.6 Discussion ... 37
4.7 Concluding remarks ... 41
C
HAPTER5 A
SSESSING THEP
UBLIC’SP
OLICYB
ELIEFS INS
USTAINABLET
RANSPORTATION... 42
5.1 Rationale behind Applying the Rasch Model to Measure Policy Beliefs ... 42
5.2 Design of the Empirical Exploration of the Public’s Policy Beliefs ... 43
5.2.1 Empirical Questionnaire Design ... 43
5.2.2 Data Collection ... 45
5.2.3 Application of Rasch Analysis... 45
5.3 Findings and Interpretations ... 48
5.3.2 Person Parameter Estimates and Fit Statistics ... 51
5.3.3 Differential Item Functioning (DIF) Analysis ... 59
5.4 Discussion ... 62
C
HAPTER6 A
NALYSIS OF THEB
ELIEFS INS
USTAINABLET
RANSPORTATIONP
OLICIES FROMS
ENIORO
FFICIALS AND THEP
UBLIC... 66
6.1 Samples Summing Analysis and Findings ... 66
6.2 Analysis of Samples from Senior Officials and General Public ... 71
C
HAPTER7 C
ONCLUSIONS ANDF
UTURES
TUDY... 76
7.1 Conclusions ... 76
7.2 Recommendations for Future Study ... 79
7.3 Research Significance and Contributions ... 80
R
EFERENCES... 81
L
IST OF
F
IGURES
Figure 1.1 Research framework ... 5 Figure 4.1 Conceptual example of senior officials’ policy beliefs, and the
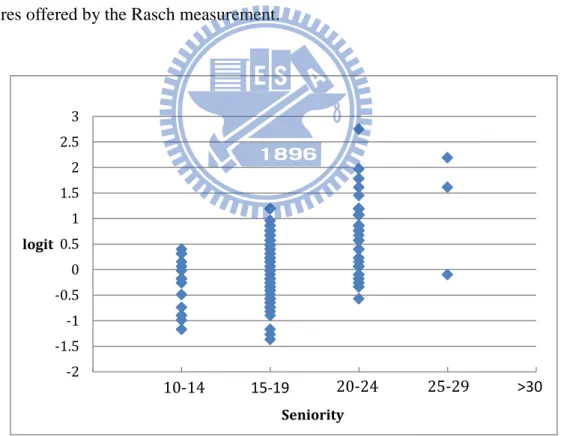
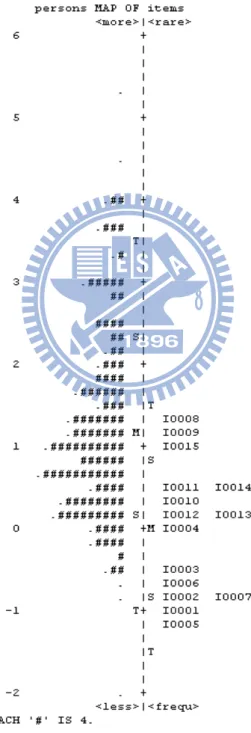
inherent resistance of two strategies in promoting sustainable transportation ... 24 Figure 4.2 Item-person map for the responded senior officials ... 34 Figure 4.3 Distribution of the seniority and policy belief measures of the
respondent senior officials ... 36 Figure 5.1 Item–person map for responding the public. ... 53 Figure 6.1 Distribution of mean scores of items for the public and the senior
officials ... 74 Figure 6.2 The item-person map of two groups by the same logit scale (the left
L
IST OF
T
ABLES
Table 4.1 Content of the questionnaire for the senior officials ... 26 Table 4.2 Model estimation and fit statistics obtained from Rasch analysis for the
senior officials ... 29 Table 4.3 Estimates of item measures and fit statistics from Rasch analysis for the
senior officials ... 31 Table 5.1 Content of the questionnaire for the public ... 44 Table 5.2 Model estimation and fit statistics obtained from Rasch analysis for the
public ... 47 Table 5.3 Estimates of item measures and fit statistics from Rasch analysis for the
public ... 50 Table 5.4 Estimates of item measures and fit statistics from Rasch analysis for the
respondents commuting by public transport ... 55 Table 5.5 Estimates of item measures and fit statistics from Rasch analysis for the
respondents commuting by private transport ... 56 Table 5.6 Estimates of item measures and fit statistics from Rasch analysis for the
respondents willing to take action to reduce the use of private transportation ... 58 Table 5.7 The differences between various commute modes for each item and
measuring policy beliefs ... 61 Table 5.8 Differences between owning passenger car or not in terms of each item
for measuring policy beliefs ... 62 Table 6.1 Common items with significance for the senior officials and the public ... 67 Table 6.2 Model estimation and fit statistics obtained from Rasch analysis for
Table 6.3 Estimates of item measures and fit statistics from Rasch analysis for both the senior officials and the public ... 70 Table 6.4 Group Statistics of Independent-Samples T test ... 72
C
HAPTER
1 I
NTRODUCTION
1.1 Research Motivations
Sustainable development is a beacon that guides all advanced nations, and the transportation sector will naturally follow this global trend. Coming to terms with all the environmental problems caused by transportation is a long-term activity (Huby & Burkitt, 2000; Olsson, 1999; Walton & Farrington, 2000) and developing an environmentally sustainable transport system would be a major step in achieving this far-reaching goal. The design and implementation of transportation policies based on these principles is the unshirkable responsibility of public sector officials, especially the responsible authorities.
However, tackling the diversity of environmental problems associated with transportation will take time. While many studies have explored policy effectiveness, little attention has been given to the feasibility of implementing public policy from the perspective of the officials involved in policy development and implementation. Those individuals must identify and define the problems and develop strategies to address them. Generally, officials need to be confident a policy is feasible if they are to develop a positive attitude toward its implementation. In addition, feasibility is not an absolute; rather, it is a matter of degree and is based on objective constraints and subjective considerations.
The development of sustainable transportation policies often involves interdepartmental and/or central and local government collaboration. It is useful, therefore, to develop coalitions so that the officials responsible for implementation support the core value of sustainable transportation. Senior officials play a key role in determining whether the objectives of sustainable transportation policy can be
realized. They must also be familiar with the strategic details so as to coordinate an agenda and effectively integrate the resources of industry, government, academia, and the private sector.
Many studies have noted the importance of understanding stakeholders’ beliefs regarding environmental polices (Harrison & Burgess, 2000; Tarrant & Cordell, 2002), but few have focused on the policy makers themselves, in part, because of a lack of suitable instruments to measure their viewpoints. Exploring policy beliefs can provide insights regarding the mindset of those initiating policies and, thus, help predict outcomes prior to implementation (Chang & Chen, 2009).
In addition, research focusing on the stakeholders’ views of sustainable transportation policies is still very scarce. The aim of the present study is to address this gap by examining policy beliefs of stakeholder groups (senior officials and the general public) engaged in sustainable transportation.
Exploring policy beliefs provides valuable knowledge not only for understanding stakeholders’ attitudes regarding sustainable transportation policy, but can also benefit implementation. This realization provides an insight into the mindset of stakeholders when initiating sustainable transportation policies, and helps predict the impact before a new policy is implemented (Chang & Chen, 2009). As such, one focus of this study is to develop a conceptual framework to measure the stakeholders’ policy beliefs on sustainable transportation implementation and then, using the developed instrument, conduct an experimental trial aimed at exploring stakeholders’ policy beliefs. Towards that end, we first discuss the development of policy beliefs and the factors affecting their development. An effective approach for measuring stakeholders’ policy beliefs is then suggested, and a study is designed based on this approach. We then
describe empirical studies of the policy beliefs of senior officials and the general public, as well as a comparison of two groups of stakeholders that was performed to ensure the idea and the findings would be convincing and contribute to achieving the above aims.
1.2 Research Objectives
The objectives of the research are to determine differences among stakeholder groups in their policy beliefs, to investigate whether policy beliefs can be used to effectively segregate stakeholders in well-defined groups, and to define those beliefs that contribute most in delineating stakeholder groups.
Towards those ends, this study looks at the nature of policy beliefs of senior officials and their confidence in implementing various strategies for achieving sustainable transportation. We conceptualized policy belief as the combined effect of a senior official’s objective constraints (e.g., financial infeasibility) and subjective considerations and viewed it as a latent trait determined, in part, by levels of expertise, seniority or authority, and administrative experience.
Next, policy beliefs related to sustainable transportation from the perspective of the general public would be analyzed using the Rasch model for quantitative evaluation. Some categorical data related to commuting modes and traffic characteristics were also collected from all respondents.
The observations of the public’s commuting modes and their willingness to act to reduce private transportation were connected to their policy beliefs related to sustainable transportation policies and produced some meaningful conclusions. Moreover, evaluating the extent to which a measure’s meaningfulness can be generalized across subgroups of a population is important. Differential item
functioning (DIF) analysis was applied in this study and concludes the items function differently for respondents from different groups.
Finally, policy beliefs of senior officials and the public were compared for different senior official and general public groups. Moreover, aggregating the subsamples allowed for a comparison with the senior officials or the general public, respectively, to address gaps or differences by examining policy beliefs of stakeholder groups.
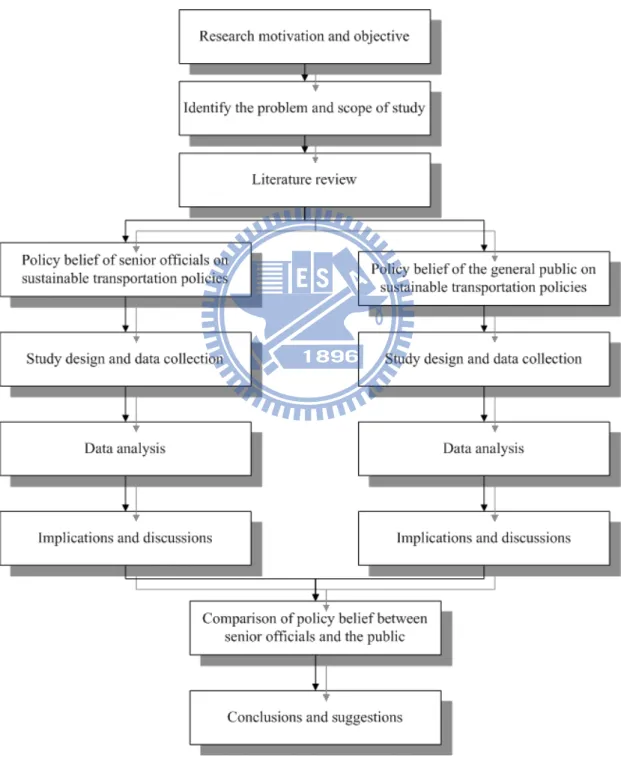
1.3 Research Framework
Given the objectives of this study, the research framework is illustrated in Figure 1.1. This dissertation contains seven chapters that are organized as follows. Chapter 1 introduces our research motivations, objectives, and framework. Chapter 2 presents the results of a literature review on sustainable transportation and policy beliefs. “Sustainability” is a complicated concept with multiple and arguable meanings. Transportation issues are increasingly discussed in the context of sustainable development, most commonly under the rubric of sustainable transport (Banister & Button, 1993; Greene & Wegener, 1997; Nijkamp, 1994; Whitelegg, 1993). However, discussions of sustainable transportation are usually limited to the environmental impact of transportation and possible measures to address these effects (Feitelson, 2002). Here we applied policy beliefs as empirical perceptions and normative opinions about relevant sustainable transportation policy questions and/or policy behaviors. Chapter 3 illustrates our methodology to explore the stakeholders’ policy beliefs. Chapter 4 is an empirical study that demonstrates the policy beliefs of senior officials regarding sustainable transportation policies. Chapter 5 is another empirical study that explores the policy beliefs of the general public related to sustainable
transportation policies. Chapter 6 is a comparison of the cognitive processes related to sustainable transportation policy beliefs between senior officials and the public. At the end of the dissertation, in Chapter 7, we provide a discussion of the findings from the policy beliefs of the senior officials and the general public, and propose suggestions for future study.
C
HAPTER
2 L
ITERATURE
R
EVIEW
2.1 Sustainable Transportation Concepts and Policy
The concept of sustainable development has long been implicitly or explicitly accepted as an important component in formulating long-term strategies, although discussions often remained in the qualitative scope. The concept of sustainability emerged in the 1970s as the result of the polarization between advocates of environmental preservation and backers of economic development. At the time, environmentalists claimed that the continued exponential growth in a finite environment would soon meet natural limitations. Gradually, this ‘‘limits to growth’’ argument lost steam and credibility, primarily because it seemed to somehow ignore claims that economic growth was vital in alleviating starvation, disease, and poverty (Torgerson, 1995).
The World Commission on Environment and Development (1987) issued a report that defined sustainable development as ‘‘development that meets the needs of the present without compromising the ability of future generations to meet their own needs.” This would be “a type of development that integrates production with resource conservation and enhancement, and that links both to the provision for all of an adequate livelihood base and equitable access to resources”. In the Commission’s view, sustainability would require action at the global, national, and local levels. Five years later, at the United Nations Conference on Environment and Development in Rio de Janeiro, representatives of several heads of states embedded the idea of sustainable development into a package of agreements, including a biodiversity convention; a climate change convention; a statement on forest principles; an agreement to work towards a desertification convention, the Rio Declaration on
environment and development; and Agenda 21, an 800-page plan for implementing the Rio Declaration (Ryan & Throgmorton, 2003). Given all of this, considerations of external effects in the environment, stakeholders’ equity in society, and efficient use of natural resources in the economy were simultaneously required of all policies of sustainability.
With the exceptions of climate change and atmospheric pollution concerns in urban areas, the emergence of a great number of additional sustainability concerns in recent years (bio-diversity, transport congestion, social exclusion, regional imbalances with their attendant political risks, etc.) have posed particular challenges to analysts with respect to integration and quantification of these problems (Zachariadis, 2005). One of the major issues in this agenda is transportation, which is accepted worldwide as a priority area in sustainability discussions (EEA, 2002; European Commission, 2001; IEA, 2002; WBCSD, 2001; World Bank, 1996). Work on sustainable transport is progressing well both in the research arena and in policy-oriented studies concentrating primarily on emissions of air pollutants (causing health problems) and greenhouse gases (affecting climate change), and is expanding to other sustainability concerns, such as congestion, noise, and accidents. Because of the inherent complexity of this sector in comparison to most other branches of economic activity, and due to the millions of travelers affected, policy measures often have to be viewed at the local level and take into consideration local particularities. In such cases, instead of concrete, quantified proposals, it is necessary to provide policy guidelines only, pointing to successful pilot projects around the world (OECD, 2002).
Additionally, The Organization for Economic Cooperation and Development (OECD, 2002) identified sustainable indicators along a causal generator, namely the “Driving force–State–Response Model,” which is adapted to take into account the
specificities of the public sector. The OECD indicators are established according to the tendencies for economic and environmental impact in the various sectors.
2.2 Policy Beliefs
In the process of policy-making, stakeholders bring different types of social values into the partnership process. Not all individuals are good candidates for participating in a collaborative process. Collaborative processes embody a particular set of social values, especially a belief in inclusive public participation, reciprocity, and the belief that environmental and economic values are not mutually exclusive. Another congruent social value is a general belief in consensus-based processes as an appropriate decision-making technique. To the extent stakeholders have social values congruent with the structure and purpose of the relevant policies, they are more likely to cooperate, and less likely use alternative venues to question the effectiveness and legitimacy of any outputs (Lubell & Leach, 2005). To discuss the social values of environmentalism and conservatism, and the possible conflicts between these values, the Advocacy Coalition Framework has been broadly applied by many authors. Case in point: Hovardas and Poirazidis, (2007) examined environmental policy beliefs of stakeholder groups engaged in protected area management and found environmental policy beliefs can be used to effectively divide stakeholders into well-defined segments that override the product-oriented definition of stakeholders. The use of K-means clustering revealed innovation-introduction and implementation-charged sample segments. The instrument utilized in that research proved quite reliable and valid in measuring stakeholders’ environmental policy beliefs. Furthermore, the methodology implied that stakeholder groups differ in a significant number of belief-system elements.
In several studies, pro-environmental behavior typically involves a tradeoff between individual and collective benefit, and it has often been conceptualized within models of altruism. In point of fact, Schwartz’s (1977) theoretical framework of normative influences on altruism was extended to the environmental domain (Black, Stern, & Elsworth, 1985; Hopper & Nielsen, 1991; Widegren, 1998). In the value-belief-norm (VBN) theory of environmentalism (Stern, 2000; Stern, Dietz, Abel, Guagnano, & Kalof, 1999), pro-environmental behavior is explained by a hierarchical sequence of variables. According to the theory, values, general environmental beliefs (e.g., general problem awareness, awareness of the adverse environmental effects of human actions (awareness of consequences)), and belief that one’s own actions could prevent those effects (ascription of responsibility), activate a personal norm. In turn, that personal norm, experienced as a feeling of moral obligation to act, is stipulated to create a willingness to act pro-environmentally (Eriksson, Garvill, & Norlund, 2006).
Different parts of this theoretical framework have been applied to environmentally significant intentions and behaviors. In the New Environmental Paradigm (NEP) (Dunlap & Van Liere, 1978), egocentric beliefs and problem awareness have been found to be positively related to pro-environmental behavior (Nordlund & Garvill, 2002; Stern, Dietz, & Guagnano, 1995; Thompson & Barton, 1994) and the acceptability of different transportation demand management (TDM) measures (Eriksson et al., 2006; Poortinga, Steg, & Vleck, 2002, 2004; Steg & Vlek, 1997). More comprehensively, Nordlund and Garvill (2003) demonstrated the importance of collective values, egocentric values, and problem awareness for a personal norm, which in turn is positively related to willingness to reduce car use. In addition, the full VBN theory has been used to explain acceptability of various energy
policies influencing households (Steg, Dreijerink, & Abrahamse, 2005).
As described by Collantes (2008), policy beliefs here are viewed as empirical perceptions and normative opinions about relevant policy questions and/or policy behaviors. Essentially, empirical perceptions are subjective assessments of cause– effect relationships. Normative opinions are subjective value assessments of policy questions and/or behaviors—they relate to the question of what policy-related behavior should be. Normative opinions are affected by empirical perceptions and by the expectations of relevant sectors of social pressure weighted by the stakeholder’s motivation to comply with social pressure.
However, a policy preference is a behavioral intention and it can be defined as the level of support that a stakeholder is ready to give to a specific policy course of action. Reliable measures of true policy preferences are often difficult to obtain. Public statements on policy preferences can be more reliably considered a mix of true policy preferences and strategic behavior. In general, what a stakeholder expresses in a public setting (public hearing, media, conferences, etc.) will be the result of his/her true policy preferences, the coordination with policy allies, and the expectations of the audience (peers, policy-makers, the general public, etc.). Such dissonance between what is true and what is stated may, to some extent, apply to policy beliefs as well.
Following, Collantes (2008), “policy belief” is defined as an individual’s level of confidence that a policy is practicable or effective. Presumably, each individual has a unique value representing his/her policy belief regarding sustainable transportation. Such a latent trait can be revealed by the person’s answers to items in a questionnaire. That is, people who have stronger beliefs regarding sustainable transportation will
respond with higher scores on a greater number of items than those who have weaker beliefs about the same issues. In addition, some policy strategies might be regarded as better than others in promoting sustainable transportation. Therefore, it can also be presumed that each item has a unique value of inherent resistance against the individual’s belief in sustainable transportation.
C
HAPTER
3 M
ETHODS
FOR
M
EASURING
A
L
ATENT
T
RAIT
3.1 Review of Item Response Theory
In order to provide objective and valid rating scales for addressing a situation like that outlined above, the item response model was developed and, subsequently, improved. Item response theory (IRT), which is a model-based measurement in which trait level estimates depend on both persons’ responses and on the properties of the items that were administered, has become the mainstream of psychological measurement (Hambleton, Swaminathan, & Rogers, 1991). Among the various models of IRT, the Rasch model is one that is widely applied for exploring psychological constructs. A review of IRT and the Rasch model are provided in the following parts of this chapter.
Psychological constructs are usually conceptualized as latent variables that underlie behavior. Latent variables are viewed as unobservable entities that influence manifest variables (e.g., test scores or item responses). Thus, the observation of these manifest variables can only serve as indicators of a person’s standing on the latent variables. As a result, measurement of psychological constructs is usually indirect; that is, latent variables are measured by observing behavior on relevant tasks or items. A measurement theory in psychology must provide a rationale that both persons and items on a psychological dimension should be inferred from behavior. Based on such a rationale, IRT was elaborated to serve as a methodology in developing or executing a psychological test.
Item response models are designed to estimate the values of latent variables on an interval scale from item scores that form an ordinal scale. Items scores, or linear combinations of item scores, are called “raw scores”. If the raw scores form a
uni-dimensional ordinal scale, then when the data is displayed with the items ordered according to item raw scores (the sum of each subject’s responses to a given item) and with the subjects ordered according to individual raw scores (the sum of each subject’s responses across all items), the data matrix will conform to a Guttman scale (Guttman, 1950).
A Guttman scale suggests that item raw scores are monotonic with item difficulty, and test scores are monotonic with the subject’s ability. The sum of scores across items for each person is the person’s raw score and the sum of scores across people for each item is item’s raw score. If the raw scores form a Guttman scale, then when people are rank-ordered by person raw score and items are rank-ordered by item raw score, the person rankings are the same for each item and item rankings are the same for each person. There are likely to be inconsistencies with this rigid rule, but the overall statistical pattern of responses should agree with these expectations. The more closely the data agree with the Guttman scale, the more likely it is that the raw scores represent at least an ordinal scale.
3.2 Brief Introduction of the Rasch Model
3.2.1 Formulation of the Rasch Model
The Rasch model has been intensively used in psychometric studies to estimate values on an interval scale based on ordinal responses (Fisher, Harvey, Taylor, Kilgore, & Kelly, 1995; Massof & Fletcher, 2001). To simplify, we initially consider only dichotomous responses; “Do you feel this strategy is practicable for implementing to achieve sustainable transportation?” A score of 1 is assigned to the response “yes”, while a score 0 is assigned to the response “no”. The probability that a respondent senior official n will respond “yes” for Item is expressed as i
; (1)
and the probability that the response is “no” is expressed as:
(2)
Therefore, the odds ratio that a respondent senior official will say “yes” to Item is
(3)
giving the logit specification;
(4)
that isolates the parameters of interest.
The person and item parameters in the case of dichotomous responses can be estimated from response odds ratios in the data set using the formulation in Equation (4). In addition to dichotomous responses, the Rasch model can be modified to be applicable to polytomous rating-scale instruments, such as a five-point Likert scale (Andrich, 1978; Masters, 1982). The modified Rasch model decomposes a polytomous response into several dichotomous responses, and formulates one multinomial-choice problem into several binary-choice problems. That is, it assigns
bix as the value of the item parameter (i.e., the inherent resistance against belief in this
study) for rating category to Item , and assumes that Equation (1) refers to the probability of subject n responding with rating category x rather than x-1 to Item i.
(
)
i n i n b b i n e e b P − − + = θθθ
1 , 1(
n i)
(
n i)
n bi e b P b P − + = − =θ
θθ
1 1 , 1 1 , 0 i(
)
(
)
n bi i n i n e b P b P = θ − θ θ , 0 , 1(
)
(
)
n i i n i nb
b
P
b
P
−
=
θ
θ
θ
,
0
,
1
ln
x iThus, we can model the log odds of the probability that a person responds in category for Item i, compared with category x-1, as a linear function of the person parameter (i.e., the person’s policy belief in this study) θn and the relative parameter
of category x, namely, for Item i:
(5)
Following Andrich’s (1978) modification of the Rasch model for a polytomous response, two types of formulations are widely applied in assessing the values of item and person parameters, namely the “rating-scales model” and the “partial-credit model”. The rating-scales model is used for instruments in which the definition of the rating scale is identical for all items, whilst the partial-credit model is employed when the definition of the rating scale differs from one item to another. The partial-credit model differs from the rating-scales model in the possession of its own threshold parameters Fix, for each category k (Wright, 1977). This is achieved by a
re-parameterization of Equation (5):
(6)
the partial-credit model can be demonstrated as:
. (7)
The partial-credit model (Masters, 1982) is used for items where (1) credit is given for partially correct answers, (2) there is a hierarchy of cognitive demands on the respondents for each item, (3) each item requires a sequence of tasks to be completed, or (4) there is a batch of ordered response items with individual thresholds
x ix n x ni nix b P P − = − θ ) 1 ( ln ix i ix b F b = + ix i n x ni nix b F P P − − = − θ ) 1 ( ln
for each item. In assessing the policy beliefs of decision makers (DMs), it is not necessary to assume the rating scales of the items are the same; thus, we adopted the partial-credit model for our empirical study.
The Rasch model is regarded as a prescriptive approach rather than a descriptive approach (Bond & Fox, 2001). In other words, the data must fit the model, or the assumptions of the model must be rejected for a particular data set. As a result, some assumptions must be made when we try to apply the Rasch model to measure policy beliefs: (1) people differ in their policy beliefs, (2) people’s responses to items depend only on their policy beliefs, (3) responses are probabilistic and conditional on their policy beliefs, and (4) the odds of achieving an item increases monotonically with the difference between the people’s policy belief parameters and the inherent-resistance parameter of the item.
Indices of reliability and validity for assessing a latent construct are also provided by the Rasch model via the person and item aspects, respectively (Wright and Masters, 1982). Reliability indices help us examine whether the model is convincing and the material is replicable, and validity indices help us examine whether the properties of our material are consistent with the assumption of the Rasch model.
3.2.2 Parameter Estimation of the Rasch Model
Based on different statistical assumptions, there are several approaches for estimating the parameters of the Rasch model. Among them, joint maximum likelihood (JML) estimation is a relatively simple and effective approach, which is also the core technique of the related computer programs: WINSTEPS and FACETS
n
θ
i
(Linacre and Wright, 1997). A simple introduction of JML estimation is given as follows.
In JML estimation, unknown construct levels are handled by using provisional trait level estimates as known values. The provisional trait level estimates themselves are improved by using subsequently estimated item parameters, which are successively improved. In other words, JML estimation is an iterative procedure that typically involves sequential estimates of person and item parameters. In the initial stage, person parameters are estimated.
The first iteration of the two-stage procedure involves specifying starting values for the item parameters so the maximum likelihood estimates of person parameters can be obtained. Then the item parameters are estimated using the person-parameter estimates. In the following iterations, person and item parameters are iteratively estimated using the improved person or item parameters change very little between the successive iterations (convergence status).
JML has been extensively applied in the estimation of many IRT models and it has several advantages in applications. First, this algorithm is easily programmable. Second, JML is applicable to many IRT models. Both 1PL IRT (e.g. the Rasch model) and 2PL IRT (e.g. the Multi-Facet Rasch Model) can be estimated with JML. Third, JML is efficient on computation. One thing that has to be noted in applying the JML estimation is that there is a strong limitation in applying the JML algorithm. In JML estimation, items or persons with perfect scores (all passed or all failed) provide no information about the parameters because there are no constraints placed on the solution.
available in the JML estimation. In fact, measures of items or persons with perfect scores mostly occur in the data of educational tests but rarely in psychological exploration. In psychological exploration, items with perfect scores are regarded as inappropriate because they provide no information about evaluating construct levels of the respondents; a person with perfect scores can be also considered as an ineffective observation because their construct levels are not comparable. It is generally suggested that these items or persons be excluded from the original data or withdraw the data and redesign the whole investigation program.
3.2.3 Reliability and Validity Statistics in the Rasch Model
In latent construct measurement, reliability indices help us to examine whether the model is convincing and the material is replicable, and validity indices help us to examine whether the properties of our material are consistent with the assumptions of the measurement. In the Rasch model, indices of reliability and validity are calibrated respectively via person and item factors (Wright & Masters, 1982) to provide the critical proofs on the quality control of data. We give a brief introduction of these two indices of Rasch measurement in the following paragraphs.
Reliability in latent construct measurement is commonly defined as the consistency of the responses to a set of items or the consistency of scores from the same instrument. Following such that definition, the reliability index R in the Rasch model is defined as the degree to which scores are free from measurement error (Andrich, 1988). As a result, the reliability estimate for persons (Rp) is shown (Bond
and Fox, 2001) as follows:
𝑅
𝑝=
𝑆𝐴𝑝2the total person variability (SDp2) represents how much respondents differ on the
measure of interest. The adjusted person variability (SAp2) represents the reproducible
part of this variability (i.e., the amount of variance that can be reproduced by the Rasch model). This reproducible variability is divided by the total person variability to obtain the person reliability estimate (Rp) with values ranging between 0 and 1,
which is consistent with the concept of Cronbach’s α (Wright, 1996).
On the other hand, reliability for items (R1) is estimated in the same manner as
for persons, in which item variance is substituted for person variance:
𝑅
1 = 𝑆𝐴1 2𝑆𝐷12 (9)
Where the total item variability (SD12) represents how much items differ on the
measure of interest. The adjusted item variability (SA12) also represents the proportion
of total item variability that can be reproduced by the Rasch model.
As noted earlier, the Rasch model is a prescriptive versus a descriptive approach (Bond & Fox, 2001). More specifically, the data must fit the model or the assumptions of the model must be rejected for a particular data set (i.e., the degree to which the previously described properties hold depends on how closely the data fit the model). With the comparison between the observed and expected patterns, two fit statistics, namely information-weighted fit (“infit”) and outlier-sensitive fit (“outfit”) are generated to evaluate the validity in the Rasch model (Smith, 1991).
The main difference between these two fit-statistics is that he outfit statistic places more emphasis on unexpected responses far from a person’s or item’s measure, while infit places more emphasis on unexpected responses near a person’s or item’s measure (Bonds & Fox, 2001). Expected values of these two mean-square fit statistics
are 1, and the guidelines for determining unacceptable departures from expectations remains the focus of many discussions (Smith et. al, 1995). To achieve more generalized standards, both outfit and infit can be further expressed as normalized residuals (Zstd) via a transformation into a t-statistic with an approximate unit-normal distribution (Wright & Stone, 1979). A Zstd (Z-standardized fit) statistic has an expected value of 0 and a variance of 1, which has previously been used to select items at the 0.05 significance level and according to the ± 2 criteria.
C
HAPTER
4 E
XPLORING
S
ENIOR
O
FFICIALS’
P
OLICY
B
ELIEFS
R
EGARDING
S
USTAINABLE
T
RANSPORTATION
4.1 Introduction
A policy is a statement by a government indicating what it intends to do or not do (Tuominen and Himanen, 2007). A considerable number of studies (Cai et al., 2008; Konidari & Mavrakis, 2007; Lund, 2007) have been made on policy validity or policy effectiveness. However, little attention has been given to the feasibility of policy implementation from the perspectives of those serving in public sectors. In the policy formation process, senior officials are responsible for setting policy and making the related critical administrative decisions. In facing the alternatives, senior officials must first clarify the problem and its causes. Strategies are then proposed through a number of management/motivational measurements. If senior officials are confident, and believe the policy or strategy is feasible, they will have a positive attitude towards implementation; otherwise, they are reluctant to take action. Senior officials might have some degree of confidence in the policy owing to both objective constraints and subjective considerations. Therefore, the term “policy belief,” derived from Collantes (2008), is defined here as senior officials’ empirical perceptions or subjective opinions about their confidence that the policy is practicable.
For the development of sustainable transportation, relevant policies may be interdepartmental and even require the collaboration of central and local governments. Therefore, government functionaries and officials responsible for the implementation of sustainable development measures must be supportive of the core value of sustainable transportation. Senior officials involved in the implementation of sustainable development strategies serve a key role in determining whether the
concept and meaning of sustainable transportation can truly be realized. They must also be familiar with the details of the strategies in order to coordinate an agenda and effectively integrate the resources of industry, government, academia, and the private sector, and put them to good use.
Although the importance of understanding stakeholder beliefs regarding environmental policy have been noted by many authors (Harrison & Burgess, 2000; Stoll-Kleemann, 2001; Tarrant & Cordell, 2002), research focusing on senior officials’ viewpoints is still very scarce and there is a lack of instruments to measure them. Exploring policy beliefs provides valuable knowledge not only for understanding senior officials’ attitudes regarding sustainable transportation policies, but can also benefit implementation. This realization provides insights into the mindset of senior officials when initiating sustainable transportation policies, and helps predict their impact before being implemented.
4.2 Questionnaire Design
Latent constructs are commonly explored by means of appropriate questionnaires that include items that portray the target constructs well and stimulate the respondents to effectively report their true feelings or thoughts. Since there was no available relevant questionnaire, a new questionnaire was formulated with items generated on the basis of proposed strategies. To ensure items in this questionnaire could motivate and guide respondents to express their true considerations and judgments on pursuing sustainable transportation, each responding official was asked, “How confident are you these strategies can achieve the goal of establishing a sustainable transportation environment?”
express their degree of feeling or judgment for each item. Therefore, the items used to measure the latent construct of policy belief were responded to on an ordinal scale, using a five-point Likert-type scale anchored by “Strongly Disagree” (coded as 1) and “Strongly Agree” (coded as 5). However, since ordinal data cannot be directly used for statistical inference, owing to violating the property of additivity, a special technique was needed to transfer these ordinal responses onto an interval scale in order to provide a comparative basis for further discussion.
4.3 Rationale for Applying the Rasch Model for Measuring the Policy
Belief
Presumably, each senior official has a unique value representing his/her policy belief regarding sustainable transportation (the person parameter). Such a latent trait can be revealed by the person’s answers to the items in a questionnaire. That is, senior officials who have stronger beliefs regarding sustainable transportation will respond with higher scores on a greater number of items than those who have weaker beliefs about those issues. In addition, some policy strategies might be regarded as better than others in promoting sustainable transportation. Therefore, it can also be presumed that each item has its unique value of inherent resistance (the item parameter bi) against
the officials’ belief in sustainable transportation. Items with lower levels of inherent resistance are those strategies that are considered by the officials as more suitable for promoting sustainable transportation.
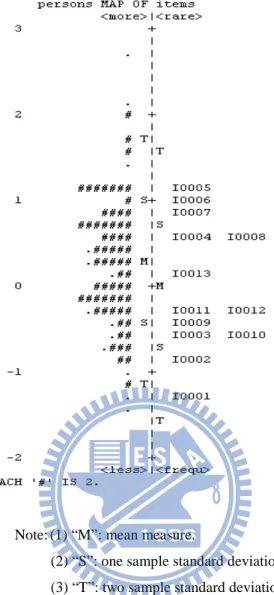
To better illustrate our formulation of the measures of person and item parameters, a simple example is shown in Figure 4.1. The right side of Figure 4.1 presents the relative levels of policy belief for three senior officials. Joe has the highest level of policy belief and Tom has the lowest. The left side of Figure 4.1
shows the relative inherent resistance of two proposed strategies for promoting sustainable transportation. This example indicates that “slowing down the growth of automobile use” has higher resistance against the belief in sustainable transportation than “improving public transportation systems”. Under the assumption that the item parameters are independent of the person parameters, some conclusions can be drawn from the information provided in Figure 4.1. Namely, all three senior officials tend to believe that “improving public transportation systems” would be more feasible in promoting sustainable transportation than “slowing down the growth of automobile use” because the former has lower inherent resistance against the belief of sustainable transportation.
Figure 4.1 Conceptual example of senior officials’ policy beliefs, and the inherent resistance of two strategies in promoting sustainable transportation (modified from
Chang & Wu, 2008)
Joe
Mary
Tom Slowing down the growth
of automobile use
Improving public transportation system
Inherent resistance against senior
officials’ policy belief Senior official’s policy belief
High
Low Weak
On the other hand, the person parameters of Joe, Mary, and Tom are in order from high to low according to the magnitudes of their policy beliefs in sustainable transportation. Therefore, for any specific alternative, Joe will believe it to be more feasible than Mary and Tom because he has a higher belief in sustainable transportation than the other two persons. If we consider the above characteristics, it is apparent that the difference between the person parameter and the item parameter will determine the tendency of the senior official’s n’s consideration of the policy strategy i. This tendency could then be formulated as a function of a probability and determined by the value.
In order to provide a theoretical basis for comparisons, the person parameters (policy beliefs) and item parameters (inherent resistance against the policy belief) must be measured on a consistent interval scale. However, all of the responses of senior officials to the questionnaire were collected on an ordinal scale in order to provide room for respondents to describe their judgments more precisely. Therefore, a statistical technique to convert the ordinal raw data into data on an interval scale was needed; thus, we chose the Rasch measurement model (Rasch, 1960) for the purpose of this study.
4.4 Design of the Empirical Exploration on Senior Officials’ Policy
Beliefs
4.4.1 Empirical Questionnaire Design
To demonstrate our conceptual framework and measurement approach for policy belief, an empirical study was carried out to explore senior officials’ beliefs regarding sustainable transportation policies. The questionnaire was designed based on 13 items collected from the extant literature (MOTC, 2006), which are strategies that benefit
i
sustainable transportation (Table 4.1). These 13 strategies were selected from the conclusions of transportation sector initiatives of the 2nd National Energy Conference in Taiwan. All 13 items were responded to on a five-point Likert-type scale, namely “Strongly Agree”, “Agree”, “Neutral”, “Disagree”, and “Strongly Disagree”. The responses in these five categories, from “Strongly Agree” to “Strongly Disagree” for each item, represented the respondents’ feelings about each strategy’s practicability for sustainable transportation policy from high to low, respectively.
Table 4.1 Content of the questionnaire for the senior officials
Items to explore self-rated perceptions Type
Using the scale provided, please indicate the extent to which you are confident these strategies can achieve the goal of establishing a sustainable transportation environment?
Item 1 Construct rail transport systems (e.g., MRT, HSR, Train, etc.) to promote public
transportation.
5-point scale
Item 2 Build public transport centers to facilitate transfer between different public
transportation modes.
5-point scale
Item 3 Integrate schedules and tickets for public transportation (e.g., EasyCard, One Day
Pass, etc.) to make transfers easier.
5-point scale
Item 4 Total vehicle volume control by limiting authorization of licenses (set quotas) to
reduce auto growth.
5-point scale
Item 5 Increase gasoline prices to reduce car use. 5-point scale
Item 6 Increase parking fees to reduce car use. 5-point scale
Item 7 Implement electronic toll collection (ETC) on highways to alleviate congestion and,
thus, reduce emissions.
5-point scale
Item 8 Provide instant traffic information to reduce driving time and, thus, reduce oil
consumption and improve air quality.
5-point scale
Item 9 Import public transportation that uses substitute energy, such as natural gas,
electricity, or combination-hybrid to reduce fossil fuel use.
5-point scale
Item 10 Develop new energy sources (electric cars, fuel-batteries, etc.) to substitute for the use of fossil fuel.
5-point scale
Item 11 Establish bicycle lanes to promote the use of bicycles. 5-point scale
Item 12 Build a friendly walking environment to reduce the use of private modes. 5-point scale
Item 13 Encourage public and private firms to use public transport to slow the use of cars and motorcycles.
5-point scale
Respondent’s personal characteristics Gender (male, 0; female, 1) binary response Age category response
Seniority category response Education category response
4.4.2 Data Collection
Data were obtained from participants in on-the-job training programs designed for senior officials. The on-the-job training programs hosted by the National Civil Service Institute in Taiwan are designed to improve administrative efficiency, enhance administrative effectiveness, increase the number and scope of the nation's competitive advantages by developing a world-class workforce of senior officials, and lay a firm foundation for the continued development of democratic politics. The data for this empirical study were collected by investigating 143 senior officials from federal to local governments engaged in relevant sustainable development sectors. These senior officials are all experienced in a relevant field, familiar with the sustainable issue and, more importantly, involved in the implementation of sustainable development action plans.
The respondents’ self-rated scores for each item and their personal characteristics were gathered through their completing the questionnaire with the assistance of well-trained investigators. Of these 143 respondents, 104 (72.7%) were male and 39 (27.3%) were female and their average age was 46.4 years. Categorical data related to seniority and level of education were also collected from all respondents.
4.4.3 Application of Rasch Analysis
The Rasch measurement model provides a means for constructing interval measures from raw ordinal category data. On the basis of the Rasch model, a value on an interval scale was estimated for each item (i.e., the item parameter) and for each respondent (i.e., the personal parameter). The responses of the 143 senior officials for the 13 items were analyzed with WINSTEPS (Linacre and Wright, 1997), an iterative computer program that estimates θn for senior official n and bi for item in i
logit units. WINSTEPS deals with polytomous responses by applying the Masters– Andrich modification (Masters, 1982) of the Rasch model. The estimated parameters and model fit statistics could, therefore, be calibrated via a joint maximum-unconditional-likelihood estimating procedure (Wright, 1996).
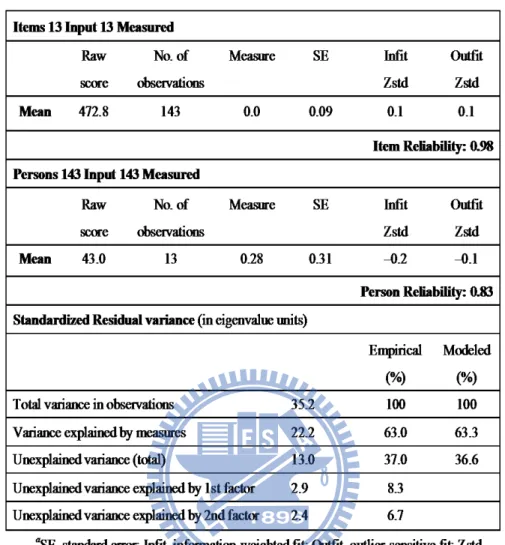
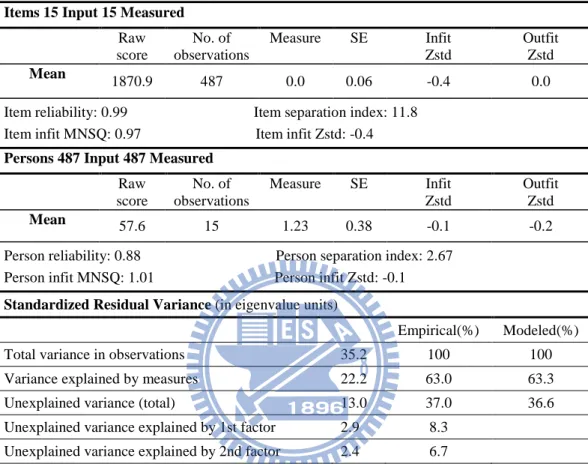
The estimated parameters and fit statistics for the entire Rasch model are shown in Table 4.2. The Rasch assessment fixed the average measure of all item parameters at zero logit to be a comparative basis of the relative interval scale; the average value of the policy belief of all respondent senior officials was 0.28 logit. Such a positive value indicates that these senior officials generally have strong beliefs in sustainable transportation policies. Before we start the detailed discussion and interpretations of the estimated item and person parameters, the reliability and validity of this Rasch model must first be discussed.
Reliability is commonly defined as the consistency of the responses to a set of items or the consistency of scores from the same instrument. It is also defined as the degree to which scores are free from measurement errors. The WINSTEPS program provided reliability information for both items and persons, as shown in Table 4.2. The person and item reliability coefficients can be interpreted similarly to a Cronbach alpha reliability coefficient for the internal consistency of responses to items (Wright, 1996). The item reliability index of 0.98 and person reliability index of 0.83 indicate the data are consistent with the assumptions of the Rasch model from the viewpoints of both items and persons.
Table 4.2 Model estimation and fit statistics obtained from Rasch analysis for the senior officials
Validity refers to the creation or selection of items to measure the same construct when performing a measurement of a latent characteristic. The validity information is expressed by the fit statistics in a Rasch measurement. Based on a comparison of the expected and the observed patterns, the fit statistics aid in quality control and in identification of data that do not meet the requirements of the model. Two fit statistics were estimated by WINSTEPS, namely an information-weighted fit (“infit”) and outlier-sensitive fit (“outfit”) (Smith, 1991). The infit and outfit are expressed as normalized residuals in Table 4.2. The Z-standardized fit statistic (Zstd) has
previously been used to select items at the 0.05 significance level and according to ±2 criteria. In our model, the infit and outfit statistics of the estimated parameters for both persons and items are all close to zero, which implies that the overall validity of our model is acceptable.
4.5 Findings and Interpretations
4.5.1 Findings for Item Parameters
Estimates of the item parameters are displayed in Table 4.3. The first column contains a description of each item; the second contains the raw score (a linear combination of item scores with a possible scale range of 143–715 for each item; the third shows the estimate for each item; and the fourth and fifth show the infit and outfit statistics, respectively, which provide evidence to determine the validity of each item. The fit statistics for these 13 items are all in the ±2 range, which implies the item responses do not deviate significantly from the assumptions of the Rasch model. The items in Table 4.3 have been ordered by their estimated values for comparison purposes.
All estimates from a Rasch model are relative. It is generally suggested that the average of all item estimates should be fixed at zero logit; therefore, the estimates for all the items and persons have been calibrated with reference to the average item estimate. The items with lower raw scores are those strategies that, for these officials, are generally considered as having lower levels of belief regarding the possibility of implementation for sustainable transportation policy. That is to say, items with higher estimates (i.e. strategies with higher inherent resistance against policy belief) are those strategies that are generally considered to be more difficult to achieve for these senior officials; items with lower estimates are those strategies that are generally
considered to be more feasible.
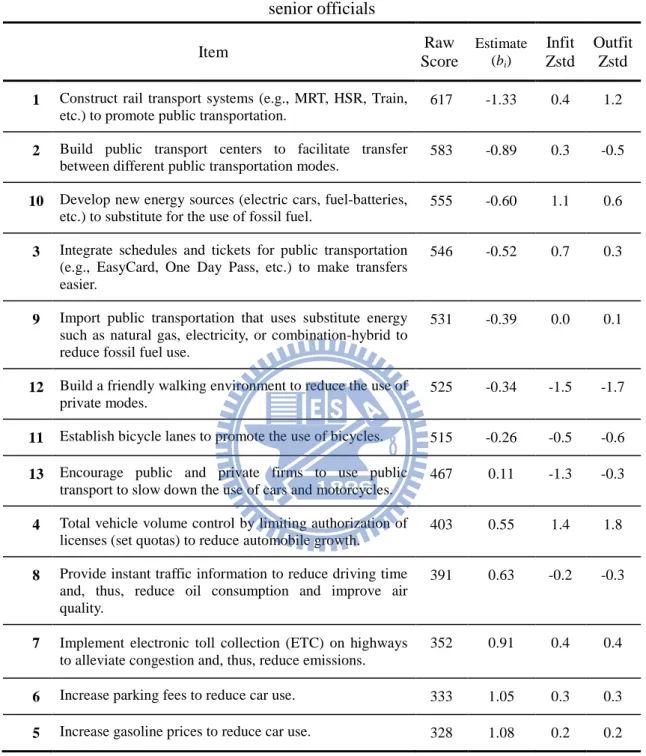
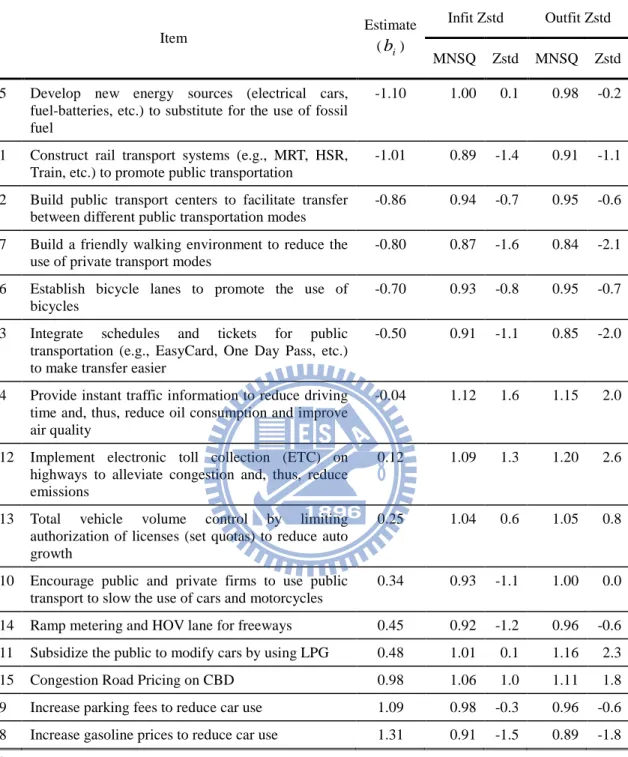
Table 4.3 Estimates of item measures and fit statistics from Rasch analysis for the senior officials Item Raw Score Estimate (bi) Infit Zstd Outfit Zstd
1 Construct rail transport systems (e.g., MRT, HSR, Train,
etc.) to promote public transportation.
617 -1.33 0.4 1.2
2 Build public transport centers to facilitate transfer
between different public transportation modes.
583 -0.89 0.3 -0.5
10 Develop new energy sources (electric cars, fuel-batteries,
etc.) to substitute for the use of fossil fuel.
555 -0.60 1.1 0.6
3 Integrate schedules and tickets for public transportation (e.g., EasyCard, One Day Pass, etc.) to make transfers easier.
546 -0.52 0.7 0.3
9 Import public transportation that uses substitute energy
such as natural gas, electricity, or combination-hybrid to reduce fossil fuel use.
531 -0.39 0.0 0.1
12 Build a friendly walking environment to reduce the use of
private modes.
525 -0.34 -1.5 -1.7
11 Establish bicycle lanes to promote the use of bicycles. 515 -0.26 -0.5 -0.6
13 Encourage public and private firms to use public
transport to slow down the use of cars and motorcycles.
467 0.11 -1.3 -0.3
4 Total vehicle volume control by limiting authorization of licenses (set quotas) to reduce automobile growth.
403 0.55 1.4 1.8
8 Provide instant traffic information to reduce driving time and, thus, reduce oil consumption and improve air quality.
391 0.63 -0.2 -0.3
7 Implement electronic toll collection (ETC) on highways
to alleviate congestion and, thus, reduce emissions.
352 0.91 0.4 0.4
6 Increase parking fees to reduce car use. 333 1.05 0.3 0.3
5 Increase gasoline prices to reduce car use. 328 1.08 0.2 0.2
The item parameter estimates for the 13 strategies on sustainable transportation policy are shown in Table 4.3, Item 5 (Increase gasoline prices to reduce car use) and Item 6 (Increase parking fees to reduce car use) have the two highest estimate values
of 1.08 logit and 1.05 logit, respectively. Those results indicate that increasing the cost of using automobiles, by increasing gasoline prices or parking fees, have the highest inherent resistance and, therefore, result in the lowest levels of confidence as practicable strategies to achieve sustainable transportation policy. On the other hand, the items with the two lowest estimates are “Construction of rail transport systems to promote public transportation” (Item 1; bi = -1.33) and “Build public transport centers
to facilitate transfer between different public transportation modes” (Item 2; bi =
-0.89). These results show that senior officials believe that promoting and improving public transportation are the most feasible strategies and are confident in their benefiting sustainable transport.
Items 3, 9, 10, 11, and 12 are the other five items with negative estimates. As such, improving energy efficiency, by developing new energy sources to substitute for the use of fossil fuel (Item 10) and importing public transportation that uses substitute energy such as natural gas, electricity, or combination-hybrid to reduce fossil fuel use (Item 9), as well as enhancing transportation demand management, such as integrating schedules and tickets for public transportation to making transfer easier (Item 3), building a friendly walking environment to reduce the use of private modes (Item 12), and establishing bicycle lanes to promote the use of bicycles (Item 11), would make the senior officials feel confident that the strategies are comparatively practicable. Items 4, 7, 8, and 13 (i.e., those with positive estimates) indicate that senior officials lack confidence in implementing strategies on sustainable transportation policy by reducing traffic flow and private vehicle ownership.
It also reveals that only three items (4, 5, & 6) with lower ranking in the Table 4.3 were viewed as restrictive strategies to limit the demand of private cars use; others were encouraging strategies to emphasize the supply of better transportation