www.elsevier.com / locate / chroma
Regulation of electroosmotic flow and electrophoretic mobility of
proteins for concentration without desalting
*
Wei-Lung Tseng, Huan-Tsung Chang
Department of Chemistry, National Taiwan University, Taipei, P.O. Box 23-34, Roosevelt Road, Section 4, No. 1, 10764, Taiwan
Abstract
Proteins were concentrated and separated in 0.6% poly(ethylene oxide) (PEO) solution using a capillary filled with Tris–borate (TB) buffer prior to analysis and detected by laser-induced native fluorescence using a pulsed Nd:YAG laser. During the concentration and separation, PEO solution entered the capillary by electroosmotic flow. When proteins dissolved in high salts (phosphate-buffered saline) were separated using 0.6% PEO solution prepared in 200 mM TB buffer, pH 9.0, the limits of detection (LODs) at signal-to noise ratios53 for carbonic anhydrase (CA) and a-lactalbumin (a-lac) were on the levels of sub mM and mM, respectively. The LOD values compared to those obtained in 38 mM TB buffer were relatively high, which is likely due to salt quenching, Joule heating and poor stacking. To improve sensitivity for analysis of proteins in high-conductivity media, two on-line concentration approaches without desalting were developed. When using a capillary filled with 1.5 M TB buffer, pH 10.0, and PEO solution prepared in 800 mM TB buffer, pH 9.0, the LOD values for CA and
a-lac were 13.8 nM and 126.0 nM, respectively, which were about 4.7 and 11.2-fold sensitivity enhancements compared to
those obtained by a conventional hydrodynamic injection (30 cm height for 10 s), respectively. The sensitivity was further improved by injecting a short plug of low pH buffer after protein injection using a capillary filled with 1.5 M TB buffer, pH 10.0, and PEO solution prepared in 400 mM TB buffer, pH 9.0. A linear relationship between the peak height and the injection volume up to 0.81 ml was obtained and the LOD values for CA and a-lac were down to 4.7 and 37.8 nM. 2001 Elsevier Science B.V. All rights reserved.
Keywords: Electrophoretic mobility; Electroosmotic flow; Proteins; Poly(ethylene oxide)
1. Introduction phoresis (SDS–PAGE) [6,7], in conjunction with
mass spectrometry [8] or silver staining [9]. Typical-There has been a long-standing interest in elucida- ly, desalting, preconcentration, and derivitization are tion gene products more directly on a protein level performed for optimum sensitivity and resolution [1,2]. The identification of proteins on cellular or prior to analysis by these techniques. However not subcellular levels is important for understanding only are these methods tedious and highly costly, but which cellular compartment the protein exerts its also denaturation, loss of samples and contamination function in [3]. Protein expression profiles can be may occur. Thus, methods allowing direct analyses analyzed using electrophoresis, such as capillary of biological samples are highly demanded.
electrophoresis (CE) [4,5] and two-dimensional so- Over the past decade, CE in combination with dium dodecylsulphate–polyacrylamide gel electro- laser-induced fluorescence (LIF) has been popular for protein analysis because of its high-resolving power, sensitivity, and rapidity [10–12]. In CE, a
*Corresponding author. Tel. / fax: 111-886-2236-21963.
E-mail address: [email protected] (H.-T. Chang). deactivated capillary is commonly used to minimize
0021-9673 / 01 / $ – see front matter 2001 Elsevier Science B.V. All rights reserved. P I I : S 0 0 2 1 - 9 6 7 3 ( 0 1 ) 0 0 7 3 5 - X
interactions with proteins and variations of electro- by EOF. With negative charges, proteins traverse the osmotic flow (EOF) [13–16]. To further improve boundary between the sample zone and the PEO resolution for separating proteins with different sizes, solution during concentration and separation. Conse-deactivated capillaries filled with gel matrices or quently, proteins stack mostly due to retardation by polymer solutions have been employed [17,18]. For PEO matrices. When migrating against EOF, proteins analysis of trace proteins in biological samples such with low electrophoretic mobility ( m ) are detectedep as plasma, CE with LIF is superior over with UV earlier in the cathode end. The LOD for CA is about absorbance detection that is more universal but less 31 pM when injected at 15 kV for 600 s, which is sensitive. To perform CE–LIF, proteins must be about three orders of magnitude of sensitivity en-labeled with suitable fluorephores such as fluorescein hancement compared to that injected at 1 kV for 10 and its derivatives or contain tryptophan, tyrosine s. Although this new method provides advantages and phenylalanine residues [19–21]. Generally, a over most conventional methods [24–28] in CE, limit of detection (LOD) at the nM level is easily including no need to fill the capillary with polymer achieved under mild conditions, such as low ionic solution prior to analysis; high stacking efficiency;
strengths [22]. less susceptibility to matrices; and simplicity,
pro-Although CE is powerful for analysis of biological teins in high salts did not stack effectively. Conse-samples, a technique permits analysis of trace quently, the maximum volume injected without loss amounts of analytes such as retinol binding proteins of resolution was only 9.6 nl and the LOD values for in plasma is still needed [23]. To increase sensitivity, most proteins were only at sub–mM levels. In an several concentration techniques such as isotacho- attempt to overcome problems associated with ma-phoresis [24–27] and field amplification [28] have trices, we have developed two methods for protein been developed in CE. However matrices cause a analysis without tedious desalting processes. In order number of problems, including irreproducibility, to enhance stacking efficiency (sensitivity), proteins poor resolution, poor stacking, and a short lifetime of prepared in high-salt media were injected into a capillaries [29–32]. Salts were also detrimental to capillary filled with 1.5M TB buffer and separated fluorescence intensity when CE–LIF was applied to using PEO solution prepared in 800 mM TB buffer. protein analysis. For example, we have found that The second strategy is that we injected a plug of low the LOD for human serum albumin (HSA) in urine pH buffer after sample injection to optimize sen-or phosphate-buffered saline (PBS) is only at sub sitivity. In this report, the results from these two new mM levels, which is at least one order higher than methods were compared with respects to maximum that in 50 mM Tris–borate (TB) buffer, pH 9.0 [33]. sample loading, stacking, migration time, and LOD. To minimize problems associated with matrix,
sam-ples are generally subject to desalting by membrane
filtration [34], chromatographic separation [35] and 2. Materials and methods
so on prior to analysis. In addition to tedious
processes and high cost, loss of analytes and con- 2.1. Equipment tamination may occur during pretreatment. Recently,
on-line concentration techniques using membrane or The basic design of the separation system has been hollow fiber have been developed [36,37]. These previously described [33]. Briefly, a high-voltage methods provide a high concentration factor and less power supply (Gamma High Voltage Research, Or-matrix problems, while suffering from limits to large mond Beach, FL, USA) was used to drive electro-size or hydrophobic proteins and no ease for automa- phoresis. The entire detection system was enclosed
tion. in a black box with an high-voltage interlock. The
Recently, we have developed a method for on-line high-voltage end of the separation system was protein concentration using bare fused-silica capil- housed in a Plexiglass box for safety. A Nd:YAG lary and a low-cost Nd:YAG laser [33]. During laser with 266 nm, 3000 Hz output from Continuum concentration and separation, poly(ethylene oxide) (model: EPO-5000, Santa Clara, CA, USA) was used (PEO) solution enters the capillary filled with buffer for excitation. One UG 5 filter from Melles Griot
(Irvine, CA, USA) was used to block 532-nm light washed with 0.5 M NaOH at 1.0 kV for 10 min to from the laser. The emission light was collected with remove PEO solution and refresh the capillary wall. a 103 objective (numerical aperture50.25). One UG Hydrodynamic injections were performed at 30 cm 1 filter from Edmund (Barrington, NJ, USA) was height for times over 10–520 s. The end of the used to block scattered light before the emitted light capillary was then immersed in PEO solution. Dur-reached the phototube (Hamamatsu R928). The ing the analysis, PEO solution entered the capillary amplified current was transferred directly through a by EOF.
10-kV resistor to a 24-bit A / D interface at 5 Hz (BorwinE, JMBS Developments, Le Fontanil,
France) and stored in a personal computer. Fused- 3. Results and discussion
silica capillaries (Polymicro Technologies, Phoenix,
AZ, USA) of 75 mm I.D.3365 mm O.D. were used 3.1. Effect of TB buffer filled in capillaries for protein separations without any coating process.
When injecting a long plug of proteins dissolved
2.2. Chemicals in high-conductivity media (e.g. PBS) into a
capil-lary filled with low concentrations of TB buffer All chemicals for preparing buffers were obtained (,400 mM ), band broadening occurs due adjusting from Sigma (St Louis, MO, USA), except that PEO the sample to the omega function inside the capillary (M 8 000 000) was from Aldrich (Milwaukee, WI,r [38], which causes poor resolution, loss of sensitivity USA). TB buffers prepared from tris(hydrox- and irreproducibility. When using a capillary filled ymethyl)aminomethane (Tris) were adjusted with with low concentration of TB buffer, irreproducibili-boric acid to pH 10.0 and 9.0. Unless otherwise ty and long separation time are also problematic noted, X mM TB buffer at different pH values means because PEO adsorption on the capillary wall is X mM Tris solution adjusted with a suitable amount marked that results in small EOF [33,39]. Another of boric acid. PBS was prepared by dissolving 8.0 g problem associated with high-conductivity samples is of NaCl, 0.2 g of KH PO , 0.46 g of Na HPO , and2 4 2 4 a long separation time because a lower voltage is 0.2 g of KCl in 1l of H O, pH 7.4. PEO (0.6 g) was2 generally applied to minimize Joule heating. To added to 100 ml of the TB buffers. Carbonic achieve reasonable resolution and sensitivity, it is anhydrase (CA), b-casein, a-lactalbumin (a-lac), and necessary to refocus the bands during separations. It trypsin inhibitor were dissolved in water and diluted however is not as easy as that in low-conductivity to suitable concentrations with PBS prior to analysis. media because of relatively low mep of proteins in high salts, wherein proteins spend much longer times
2.3. Polymer solution entering PEO solution from the sample zone. As a
result shown in our previous study, the maximum Increasing amounts of PEO were gradually added sample loading volume without loss of resolution is to the above buffers, respectively, in a water bath at much smaller (9.6 nl) and the LOD for CA was 0.18 85–908C. During the addition of PEO, a magnetic mM when injecting high-conductivity samples con-stirring rod was used to produce a homogeneous taining CA, b-casein, a-lac, and trypsin inhibitor suspension. After adding the PEO, the solution was [33].
stirred for a further hour. PEO solutions were If our reasoning above is right, concentration degassed with a vacuum system in an ultrasonic should be optimized if the differences in conduc-tank. The PEO solutions stored in a refrigerator at tivities among TB buffer, sample zone, and PEO are
48C were usable for 4 days. minimized and the electrophoretic mobility of
pro-tein in PEO solution reduced. To test this hypothesis, 2.4. On-line concentration and separation using a capillary filled with high concentrations of TB buffer and / or separating proteins in PEO solu-Capillaries were treated with 0.5 M NaOH over- tion prepared in high concentrations of TB buffer night prior to use. Before each run, capillaries were should be worthy trying. Table 1 shows the results of
Table 1
Effect of the concentration of free buffer and PEO solution on the migration time, peak height and peak width when injection volumes were 60 nl and 280 nl respectively
a b
TB buffer (M ) TB buffer (mM ) Vinj(nL) Migration time (min) Peak height (mV) Peak width (min) CA b-Casein CA b-Casein CA b-Casein
c 2.5 200 60 14.41 15.66 278 297 0.12 0.17 c 2.0 200 60 14.82 16.13 318 317 0.13 0.21 c 1.5 200 60 15.25 16.60 351 362 0.16 0.27 c d 0.4 200 60 N.D. N.D. N.D. N.D. N.D. N.D. c 0.4 800 60 34.25 35.66 112 79 0.34 0.21 e f 1.5 200 280 11.07 12.50 163 N.R. 0.07 N.R. e 1.5 400 280 18.78 19.92 332 259 0.15 0.18 e 1.5 800 280 21.43 22.84 334 321 0.14 0.18 a
pH 10, used to fill the capillary before separation.
b
pH 9.0, used to prepare PEO solution.
c [CA]50.5 mM, [b-casein]510 mM. d Not detected. e [CA]50.25 mM, [b-casein]55 mM. f
Not resolved from the peak corresponding to a-lac.
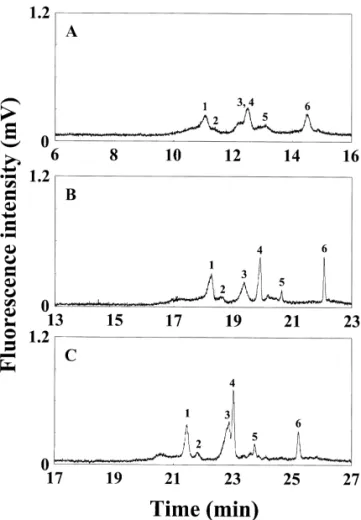
injecting 60-nL samples when using different TB stacking, resolution and migration time, we com-buffers to fill the capillary and to prepare PEO pared the results obtained from using 200, 400 and solutions, respectively. When using 400 and 200 mM 800 mM TB buffers to prepare PEO solutions, TB buffers to fill the capillary and to prepare PEO respectively. As expected, Fig. 1 shows that peak solution, the peaks corresponding to CA and b- height and migration times both increased with casein were not detected, implying poor stacking. increasing TB concentration when injecting 280 nl of Although they were detected using 800 mM TB to the sample. In 1.5 M TB buffer, PEO adsorption on prepare PEO solution, separation times were long the capillary wall was not profound [39]. In other (migration time for CA was 34.25 min) and protein words, PEO adsorption did not play a significant role did not stack effectively (relatively low intensities in determining EOF. On the other hand, in addition and broad peaks). For example, the maximum inject- to viscosity, the ionic strength of PEO solution was ing volume was about 120 nl and the LOD for CA another major factor for determining EOF. Please was about 28.4 nM. Herein we defined that the note that b-casein and a-lac were not resolved when maximum injection volume was the one to obtain the using 200 mM TB to prepare PEO solution. To maximum fluorescence intensity without dramatic conveniently compare the effects of PEO solution on loss of resolution (R .1.25) under certain condi-s protein analysis, the limits of detection (LOD) at tions, such as ionic strength, pH, capillary length, signal-to-noise ratios53, concentration factor (the Joule heating, and PEO solution. When comparing ratio of the LOD for proteins injected at 30 cm the results using a capillary filled with 1.5, 2.0, and height for 10 s to that for 180 s), and plate number 2.5 M TB buffers, respectively, and PEO solution were tabulated in Table 2. Although the separation prepared in 200 mM TB buffer, pH 9.0, peak heights time was comparatively shorter, PEO solution pre-decreased with increasing TB concentration, pre- pared in 200 mM TB buffer was not suitable, with sumably because of the salt dependence of the respect to resolution and stacking. For CA, b-casein, quantum yield. To the end, we suggested that the and a-lac, use of PEO solution prepared in 800 mM capillary filled with 1.5 M TB buffer was superior. TB provided better sensitivity and higher concen-tration factor (except that for CA). The LOD for
3.2. Effect of PEO solution carbonic anhydrase was 13.8 nM, which was a 4.7–
fold enhancement in sensitivity compared to that at To further explore the effect of PEO solution on 30 cm height for 10 s. On the other hand, for trypsin
inhibitor, PEO solution prepared in 400 mM TB buffer were more suitable. The LOD for trypsin inhibitor was 45.3 nM, which was a 12.5-fold enhancement in sensitivity compared to that at 30 cm height for 10 s. The fact that the concentration factor was relatively less than the ratio of the injection volumes was due to Joule heating, which was supported by the fact that a poor sensitivity and stacking efficiency occurred for trypsin inhibitor in the PEO solution prepared in 800 mM TB buffer. We should also mention that the quantum yields of these proteins decreased with increasing temperature. It is also interesting to note that resolution between two peaks corresponding to CA increased with increasing TB concentrations, while the best condition for resolving b-casein and a-lac was achieved using PEO solution prepared in 400 mM TB buffer. The efficiency shown here did not agree with the general rule in CE that separation is generally optimized using low-conductivity media in CE. Some facts contributed to the result, including significant differ-ences in migration time (diffusion), stacking ef-ficiency, quantum yield (peak height), and Joule heating at different ionic strengths, and the solvent dependency of the electrophoretic mobility of pro-teins.
Fig. 1. Effect of PEO solution on on-line concentration and
3.3. Effect of a plug of low pH buffer
separation of sample proteins at 15 kV. The 60-cm capillary (50 cm in effective length) was filled with 1.5 M TB buffer, pH 10.0.
Buffer vials contained 0.6% PEO solutions prepared in 200 mM Although the stacking efficiency of proteins in
(A), 400 mM (B) or 800 mM (C) TB buffer, pH 9.0. Hydro- PBS was improved using high concentrations of TB dynamic injections were performed at 30 cm height for 180 s.
buffer, the improvement result was not satisfied. To
Peak identity: 1 and 2 for CA (0.25 mM ); 3 for b-casein (5 mM );
further improve sensitivity, we used PEO solution
4 and 5 for a-lac (2.5 mM ); 6 for trypsin inhibitor (1 mM ).
prepared in 400 mM TB buffer and applied a short
Table 2
Effect of PEO solution on LOD, concentration factor (CF), and plate number
a
TB (mM)
CA b-Casein a-lac Trypsin inhibitor
200 400 800 200 400 800 200 400 800 200 400 800 b b LOD (nM) (S /N53) 28.2 18.8 13.8 N.R. 257.6 143.6 N.R. 228.3 126.0 109.1 45.3 70.7 CF 2.16 5.26 4.70 N.R. 4.90 5.09 N.R 7.41 11.17 3.88 12.52 7.05 5 Plate number (310 ) 2.54 1.45 2.32 N.R. 1.15 0.55 N.R. 3.64 6.02 0.60 15.92 7.83 a
Used to prepare PEO solutions, other conditions as shown in Fig. 1.
b
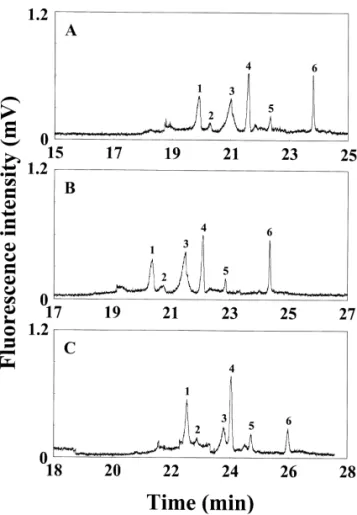
plug of low pH buffer (,pH 5.0) after injecting a long plug of proteins (18.4 cm). Because hydronium ions migrated much faster than proteins towards the cathode end, the proteins close to the injection end were affected by hydronium ions quickly and profoundly, leading to decreasing the mep due to decreases in negatively charged density. Consequent-ly, proteins close to the injection side migrated with a greater mobility towards the cathode end and thus stacked at the beginning of the concentration pro-cess. On the other hand, because the plug of low pH buffer was relatively short (0.4 cm) compared to the sample plug, the proteins close to the side of the TB buffer were affected quickly and profoundly by hydroxide ions, leading to a small migration mobility towards the cathode end. As a result, proteins stacked more effectively at the boundary between the TB buffer and PEO solution. Because pH changes did not cause significant effect on mobility of salts, proteins migrated further apart from sodium and chloride ions. Apparently, this method should allow one to inject a longer sample plug. When injecting a 10-s plug of low pH buffer, the maximum injection volume was increased to 810 nl, which was about 2.8-fold compared to that without applying this short plug. Important to note that the resolution between
Fig. 2. Effect of the plug length of low pH buffer on on-line
two peaks corresponding to CA increased in
pres-concentration and separation of sample proteins at 15 kV. Buffer
ence of a plug of low pH buffer. To further test the
vials contained 0.6% PEO solution prepared in 400 mM TB, pH
effect of the length of the plug on concentration and
9.0. Low pH buffer was injected at 30 cm height for 10 s (A), 20 s
separation, the low pH buffer were injected for 20 (B), and 30 s for (C). Other conditions were the same as in Fig. 1. and 30 s, respectively. As the plug length was
increased, migration times shown in Fig. 2 became
longer due to marked PEO adsorption at low pH solution prepared in 400 mM TB buffer, pH 9.0. Fig. [33,39]. Although the sensitivity for CA was im- 3A shows no peak detected when a hydrodynamic proved, resolution between b-casein and a-lac de- injection was performed for 10 s. The peaks corre-creased when injecting a 30 s plug of the low pH sponding to the four sample proteins only apparently buffer. In terms of speed, resolution and sensitivity, visible when injecting for 360 s (0.56 ml) and Fig. the optimum length of the plug was 10 s. To further 3B shows the electropherogram when injecting for support our suggestion, we performed analysis with / 520 s (0.81 ml). The peaks were narrow (peak widths without applying a 10-s plug of the pH buffer after at half height range from 5 to 13 s) even an 18-cm injecting 280-nl samples. The LOD values for b- sample plug was injected, indicating proteins stacked casein were 95.3 nM and 257.6 nM, respectively. well. Table 3 shows good reproducibility in migra-To obtain quantitative performance, we injected tion times (RSD values ,1.0%) even when injecting samples (prepared in PBS) containing 50 nM CA, 1 0.81 ml sample proteins. The separation time was mM b-casein, 500 nM a-lac, and 200 nM trypsin longer (33 min) due to a small bulk EOF when inhibitor into a capillary filled with 1.5 M TB buffer, injecting 0.81 ml of the sample. A linear relationship pH 10.0, at 30 cm height for times over 10-520 s and between the fluorescence intensity and the injection then a 10-s plug of low pH buffer using 0.6% PEO time occurred over the range from 360 to 520 s. The
LOD values for the four proteins were in the range from nM to sub-nM, leading to 21.2 to 44.7-fold enhancements in sensitivity compared to those in-jected for 10 s. A relatively large deviation in the linearity for carbonic anhydrase compared to the others was due to poor stacking (broader peak width) because it, with a small m , spent a longer timeep entering PEO solution form the sample zone. 3.4. Comparison of concentration methods
Table 4 shows comparisons of results obtained from this study and our previous one [33], with respect to maximum sample loading, migration time and LOD values. In our previous study, we illus-trated the maximum sample loading for proteins dissolved in 38 mM TB buffer, pH 9.0, was 1.40 ml when using a 60 cm capillary filled with 400 mM TB buffer, pH 10.0, and PEO solution prepared in 200 mM TB buffer, pH 9.0. The LOD values for CA and a-lac were 0.79 and 8.8 nM, respectively. The reason for using 38 mM TB buffer to dissolve proteins is to minimize PEO adsorption (long separation time) and allow a long injection length. As mentioned above, proteins dissolved in PBS did not stack effectively
Fig. 3. Separation of low-concentration sample proteins without and the quantum yields were low under the same
and with on-line concentration. Hydrodynamic injections were conditions. As a result, the LOD for CA was 1.8 mM. performed at 30 cm height for 10 s in (A) and 520 s in (B). Peak
Without a 10-s plug of low pH buffer, the maximum
identity: 1 and 2 for CA (50 nM ); 3 for b-casein (1 mM ); 4 and 5
sample loading without loss of resolution was 0.28
for a-lac (500 nM ); 6 for trypsin inhibitor (200 nM ). Conditions
ml. The LOD values for CA and a-lac were 18.8 and were the same as in Fig. 2.
228.3 nM, respectively. On the other hand, the
Table 3
On-line concentration and separation of four sample proteins dissolved in PBS in 0.6% PEO solution prepared in 400 mM TB, pH 9, using a 60-cm capillary filled with 1.5 M TB buffer, pH 10.0
CA b-Casein a-lac Trypsin inhibitor
a
Linear regression y50.84x2252.6 y51.05x2330.6 y51.76x2480.3 y51.25x2381.0 2
Linear regression coefficient (r ) 0.941 0.972 0.998 0.987
b LOD (mM ) 0.10 1.26 1.69 0.57 c LOD (nM ) 4.7 40.6 37.8 13.2 CF 21.3 31.0 44.7 43.2 c, d
Migration time (min)(RSD) 27.71 (0.71%) 29.22 (0.74%) 29.88 (0.75%) 32.62 (0.82%)
5
Plate number (310 ) 2.69 1.15 6.48 5.45
a
y is the peak height (mV), x is the injection time (s). b
Injection volume was about 10 nl.
c
Injection volume was about 810 nl.
d n53.
Table 4
Effect of matrix and separation buffer on concentration performance using 60 cm capillaries
a b
TB buffer Matrix Vinj, max(ml) Migration time (min) CF LOD (nM ) Ref. CA a-lac CA a-lac CA a-lac
c 0.4 M 38 mM TB 1.4 30.25 (0.68) 31.27 (0.88) 148.3 35.1 0.79 8.8 33 d e PBS 0.0096 14.33 (0.85) 15.58 (1.20) ND ND 180.7 512.8 This work f PBS 0.12 31.86 (0.43) 33.18 (0.72) 6.1 11.2 28.4 66.2 This work g 1.5 M PBS 0.28 18.78 (1.35) 22.82 (1.33) 5.3 12.5 18.8 228.3 This work h PBS 0.81 27.71 (0.71) 29.88 (0.75) 21.3 44.0 4.7 37.8 This work a
Buffer used to fill the capillaries prior to analysis.
b
Concentration factor, the LOD obtained compared to that obtained when injecting at 1 kV for 10 s in Ref. [33], and to that obtained when hydrodynamically injecting at 30 cm height for 10 s in this work.
c
% RSD (n53).
d
the buffer used to prepare PEO solution was 200 mM TB, pH 9.0.
e
Not determined due to poor stacking.
f
The buffer used to prepare PEO solution was 800 mM TB, pH 9.0.
g
The buffer used to prepare PEO solution was 400 mM TB, pH 9.0.
h
The buffer used to prepare PEO solution was 400 mM TB, pH 9.0, low pH buffer was injected at 30 cm height for 10 s after sample injection.
maximum sample loading was increased to 0.81 ml this method is robust, which can be applied to when injecting a 10-s plug of lower pH buffer after on-line concentration of small (in preparation) and sample injection. The LOD values for CA and a-lac macromolecules in high and low-conductivity media. were 4.7 and 37.8 nM, respectively. These results In the future, we will focus on testing the possibility apparently show the potential for analysis of proteins of using this method for analysis of peptides in in biological samples. Compared to other conven- biological samples, among which many, with con-tional concentration methods such as ITP [24–27], centration in the sub to nM range, have been known the proposed new method shows advantages, includ- as important hormones. As our research of interest ing less susceptibility to matrix effects, simplicity, has currently been switched to proteomics, we would reproducibility, and high sensitivity. like to extend this method to protein screening.
4. Conclusion Acknowledgements
Using a capillary filled with 1.5 M TB buffer and This work was supported by the National Science 0.6% PEO solution prepared in 800 mM TB buffer, Council of Taiwan, under the contract number NSC proteins dissolved in PBS stacked without desalting. 89-2113-M-002-062.
When injecting a 10-s plug of low pH buffer after protein injection, the stacking efficiency was further
improved in PEO solutions prepared in 400 mM TB References buffer. We have shown that the maximum sample
loading was 0.81 ml and the LOD for CA was 4.7 [1] P. Buckel, Trends Pharmacol. Sci. 17 (1996) 450.
nM. On the basis of these and our previous results [2] J. Znang, L. Zhang, S. Zhao, E.Y.C. Lee, Biochemistry 37 (1998) 16728.
[33], we infer the potential of this new proposed
[3] L. Li, E.V. Romanova, S.S. Rubakhin, V. Alexeeva, K.R.
method for analysis of proteins in biological samples
Weiss, F.S. Vilim, J.V. Sweedler, Anal. Chem. 72 (2000)
such as urine and plasma. One of the advantages of 3867.
these proposed methods over other on-line concen- [4] V. Klyushhnichenko, V. Tishhhkov, M.R. Kula, J. Biotechnol.
[5] A. Pantazaki, M. Taverna, C. Vidal-Madjar, Anal. Chim. [23] T. Marshall, K.M. Williams, Electrophoresis 19 (1998) 1752. Acta 383 (1999) 137. [24] F. Foret, E. Szoko, B.L. Karger, J. Chromatogr. 608 (1992) [6] P. Cash, Anal. Chim. Acta 372 (1998) 121. 3.
[7] H. Sarioglu, F. Lottspeich, T. Walk, G. Jung, C. Eckerskorn, [25] I.S. Krull, R. Strong, Z. Sosic, B.-Y. Cho, S.C. Beale, C.-C. Electrophoresis 21 (2000) 2209. Wang, S. Cohen, J. Chromatogr. B 699 (1997) 173.
´ ´
[8] M. Pardo, M. Ward, A. Pitarch, M. Sanchez, C. Nombela, W. [26] M. Dankova, D. Kaniansky, S. Fanali, F. Ivanyi, J. Chroma-Blackstock, C. Gil, Electrophoresis 21 (2000) 2651. togr. A 838 (1999) 31.
´ ` ´ ´
[9] I. Ueon, T. Sakai, M. Yamaoka, R. Yoshida, A. Tsugita, [27] D. Kaniansky, M. Masar, J. Bieleikova, F. Ivanyi, F. ¨ Electrophoresis 21 (2000) 1832. Eisenbeiss, B. Stanislawski, B. Grass, A. Neyer, M. Johnck, [10] I. H Lee, D. Pinto, E.A. Arriaga, Z. Zhang, N.J. Dovichi, Anal. Chem. 72 (2000) 3596.
Anal. Chem. 70 (1998) 4546. [28] S. Locke, D. Figeys, Anal. Chem. 72 (2000) 2684. [11] D.M. Pinto, E.A. Arriaga, D. Craig, J. Angelova, N. Sharma, [29] J.R. Veraart, C. Gooijer, H. Lingeman, N.H. Velthorst,
H. Ahmadzadeh, N.J. Dovichi, C.A. Boulet, Anal. Chem. 69 U.A.Th. Brinkman, Chromatographia 44 (1997) 581. (1997) 3015. [30] J.R. Veraart, H. Lingeman, U.A.Th. Brinkman, J. Chroma-[12] M.D. Harvey, D. Bandilla, P.R. Banks, Electrophoresis 19 togr. A 856 (1999) 483.
(1998) 2169. [31] J. Boden, K. Bachmann, J. Chromatogr. A 734 (1996) 319. [13] Y. Wang, P.L. Dubin, Anal. Chem. 71 (1999) 3463. [32] M.J. van der Schans, J.K. Allen, B.J. Wanders, A. Gutman, J. [14] E. Cordova, J. Gao, G.M. Whitesides, Anal. Chem. 69 Chromatogr. A 680 (1994) 511.
(1997) 1370. [33] W.L. Tseng, H.-T. Chang, Anal. Chem. 72 (2000) 4805. [15] I. Miksik, Z. Deyl, J. Chromatogr. A 852 (1999) 325. [34] Y. Shen, F. Xiang, T.D. Veenstra, E.N. Fung, R.D. Smith, [16] V. Barbara, C. Gelfi, P.G. Righetti, J. Chromatogr. A 868 Anal. Chem. 71 (1999) 5348.
(2000) 85. [35] R.T. Kennedy, I. German, J.E. Thompson, S.R. Witowski, [17] A. Hiraoka, T. Arato, I. Tominaga, N. Eguchi, H. Oda, Y.J. Chem. Rev. 99 (1999) 3081.
Urade, Chromatogr. A 802 (1998) 143. [36] E. Rohde, A.J. Tomlinson, D.H. Johnson, S. Naylor, J. [18] G. Hunt, W. Nashabeh, Anal. Chem. 71 (1999) 2390. Chromatogr. B 713 (1998) 301.
[19] K.C. Chan, G.M. Muschik, H.J. Issaq, Electrophoresis 21 [37] X.Z. Wu, A. Hosaka, T. Hobo, Anal. Chem. 70 (1998) 2081. (2000) 2062. [38] S. O Roberts, P.H. Rhodes, R.S. Snyder, J. Chromatogr. 480 [20] L. Tao, R.T. Kennedy, Anal. Chem. 68 (1996) 3899. (1989) 35.
[21] C.E. MacTaylor, A.G. Ewing, J. Microcol. Sep. 12 (2000) [39] W.L. Tseng, M.-M. Hsieh, S.J. Wang, H.-T. Chang, J.
279. Chromatogr. A 894 (2000) 219.