Tai-Chia Chiu Ming-Feng Huang Chih-Ching Huang Ming-Mu Hsieh Huan-Tsung Chang Department of Chemistry, National Taiwan University, Taipei, Taiwan
Indirect fluorescence of aliphatic carboxylic acids
in nonaqueous capillary electrophoresis using
merocyanine 540
A method for the analysis of aliphatic carboxylic acids (ACAs) in nonaqueous capillary electrophoresis (NACE) in conjunction with indirect laser-induced fluorescence (ILIF) using merocyanine 540 (MC 540) is described. Performing the analysis in organic solvent is advantageous when using MC 540, because of its greater quantum yield in aprotic solvent. To achieve a high dynamic reserve (DR) and optimize resolution, we have tested a number of aqueous mixtures containing alcohols and acetonitrile (ACN). The optimum buffer for the analysis of C2-C18 ACAs, in terms of sensitivity, resolution, and speed, is an aqueous mixture of 40% ACN, 30% ethanol, and 1 mM Tris at apparent pH 7.4 (adjusted with ascorbic acid). Under this condition, the DR is greater than 1000, thereby the limits of detection for acids are in the range of sub-mM tomM. Linear plots show that the dynamic ranges for the analysis of ACAs are at least two decades in concentration, with regression coefficients all greater than 0.98. The relative standard deviations of the migration times and peak heights for all ACAs are less than 2.0%. Furthermore, this simple and cost-effective method has been applied to the analysis of marine lipid concentrate, with the concentrations of 1.676 0.03 and 4.506 0.05 mM(n = 5) for C14 and C16 acids, respectively, in a tablet of marine lipid concentrate sample.
Keywords: Aliphatic carboxylic acid / Indirect laser-induced fluorescence / Merocyanine 540 /
Nonaqueous capillary electrophoresis EL 4795
1 Introduction
Although capillary electrophoresis (CE) in aqueous solu-tion has been emerged as a very promising tool for analy-sis of numerous analytes including small solutes and macromolecules [1–3], it remains an important issue for some nonpolar analytes. To overcome problems asso-ciated with solubility, such as poor resolution and irrepro-ducibility, nonaqueous CE (NACE) has been developed [4–9]. In addition, the acid-base behavior of analytes is affected by solvent properties, which leads to greater flexibility in selectivity adjustment [10]. Another advan-tage of using organic solvents, such as acetonitrile (ACN), is less Joule heating generated during a run, allow-ing much higher electric field strengths than are currently used in CE [11]. As a result, a fast separation can be achieved. This also allows the use of wide-bore capillaries for greater amounts of sample loading, thereby improving sensitivity [12].
Analysis of aliphatic carboxylic acids (ACAs) is of im-portance and interest because of their roles in environ-mental and biological processes [13, 14]. However, in addition to the low solubility for large ACAs, the low sensitivity due to small molar absorption coefficients (e.g., ,50 L mol–1cm–1for n-octadecanoic acid at 210 nm) is problematic when conducting the analysis via UV absorp-tion. To circumvent these disadvantages, NACE has been developed for the analysis of ACA derivatives [15]. How-ever, this technique suffers from tedious derivatization procedures and possible interference from by-products. It is also not attractive from the standpoint of spatial reso-lution and dynamics in sampling processes, like biochem-ical processes. Thus, easier and nondestructive techni-ques providing features of sensitivity and universality are highly demanded. One good example is NACE in con-junction with indirect UV absorption that has been employed for the analysis of ACAs, with limits of detection (LODs) at themM-level [16].
To achieve better sensitivity, indirect laser-induced fluo-rescence (ILIF) should be prominent [17, 18]. Surprisingly, its use in NACE is rare [19] although it is well known that some dyes have greater quantum yields and are more stable in organic solvent [20]. One main reason for ILIF not becoming popular in NACE is because most common solvatochromic dyes are neutral or the dissociation of dyes is less compared to that in aqueous solvent [21]. In Correspondence: Dr. Huan-Tsung Chang, Department of
Chem-istry, National Taiwan University, Roosevelt Road, Sec. 4, Taipei 106, Taiwan, R.O.C.
E-mail: [email protected] Fax: +886-2-2362-1963
Abbreviations: ACA, aliphatic carboxylic acid; DR, dynamic
reserve; ILIF, indirect laser-induced fluorescence; NACE, nona-queous capillary electrophoresis; TA, Tris–ascorbic acid buffer;
TR, transfer ratio
ª WILEY-VCH Verlag GmbH, 69451 Weinheim, 2002 0173-0835/02/0302–449 $17.50+.50/0
CE
and
order to take advantages of NACE-ILIF, there is thus a need to search for suitable ionic dyes that have greater fluorescent quantum yields in organic solvent. In addition, the use of a very stable laser is essential for achieving a high dynamic reserve (DR), in turn optimizing sensitivity, according to Eq. (1) [22]:
CLOD= Cm/(DR6TR) (1)
where CLODis the concentration limit of detection, and Cm is the concentration of relevant mobile-phase compo-nent, DR is the ability to measure a small change on top of a large signal, and equals to a signal-to-noise ratio (S/N) of the background signal, and TR refers to transfer ratio, which is the degree of displacement of the probe (co-ion) by the analyte. A high TR is also required for opti-mum sensitivity as shown in Eq. (1). This can be realized when fluorophores with high charge densities and com-parable mobility with analytes are utilized [23]. The peak profile for the analyte with its mobility similar to the probe is generally symmetric, thereby optimizing resolution. An-other requirement for achieving reproducibility, stable baseline, and high sensitivity is that the mobility of the buffer ions should be as different as possible from that of analytes [24, 25]. Recently, the effect of optically transpar-ent and absorbing co-ions on the peak symmetry, number of system peaks, and sensitivity has been carefully com-pared [26].
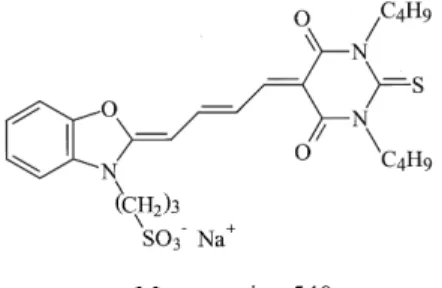
The purpose of this work is to develop NACE-ILIF for the analysis of C2-C18 ACAs with high sensitivity and efficiency. To minimize matrices interference and reduce the cost, a He-Ne laser at 543.6 nm and merocyanine 540 (MC 540) were used. MC 540 belongs to the family of benzoxazol merocyanine dyes with heterocyclic aro-matic groups linked by a polymethine chain, whose struc-ture is depicted in Fig. 1. It has been known that its optical characteristics are very sensitive to the changes in en-vironmental factor, such as viscosity, temperature, and polarity [27, 28]. Thus, we also focused on the impact of organic solvents on the stability and quantum yield of MC 540 in this study. In addition, the effects of organic sol-vents, buffer ions, and sample additives on resolution, peak shape, and sensitivity were also carefully elucidated.
Figure 1. Chemical structure of the probe, MC 540.
2 Materials and methods
2.1 Capillary electrophoretic system
The basic design of the NACE-ILIF system has been previously described [19]. Briefly, a high-voltage power supply (Gamma High Voltage Research, Ormond Beach, FL, USA) was used to drive electrophoresis. The entire detection system was housed in a black box with a high-voltage interlock. The high-high-voltage end of the separation system was put in a laboratory-made plexiglass box for safety. A 4 mW He-Ne laser with 543.6 nm output from Melles Griot (Irvine, CA, USA) was used for excitation. The light was collected with a 106objective (numeric aperture = 0.25). One OG 590 cutoff filter was used to block scattered lights before the emitted light reached the photomultiplier tube (Hamamatsu R928). The fluores-cence signal was directly transferred through a 10 kO resistor to a 24 bit A/D interface at 10 Hz (Borwin, JMBS Developments, Le Fontanil, France) and stored in a per-sonal computer. Fused-silica capillaries (Polymicro Tech-nologies, Phoenix, AZ, USA) used were 40 cm (30 cm in effective length)675 mm ID.
2.2 Chemicals
All chemicals were of reagent grade and were obtained from Sigma (St. Louis, MO, USA). Buffers prepared from aqueous mixtures were described in Section 3. Briefly, nonaqueous buffers containing 1 mMTris were adjusted with ascorbic acid to suitable apparent pH (pH*) values. Herein, these buffers are called 1 mMTA buffers.
2.3 Analysis of marine lipid concentrate
The marine lipid concentrate (OMEGA-3) was obtained from Triple Treasures (Christchurch, New Zealand). To obtain a completely miscible sample solution and mini-mize a mismatch of the composition between the sample and buffer, each of the 10mL sample was mixed with an aliquot of 9.99 mL aqueous mixture containing 40% ACN, 30% ethanol, 1 mMTA, and 0.5 mMphenol, pH* 7.4.
2.4 Electrophoretic procedures
New capillaries were rinsed with 0.5MNaOH overnight. Prior to analysis, the capillary was flushed with the run-ning buffer for 20 s, and was subsequently conditioned with the running buffers for 20 min at 15 kV. To obtain a relatively stable baseline, it is suggested that the capillary
was conditioned with the running buffers for 10 min at 15 kV after each run. Hydrodynamic injection was con-ducted at 20 cm height for 10 s.
3 Results and discussion
3.1 Impact of organic solvent
It has long been known that the use of solvent with a high ratio of the dielectric constant to viscosity (e/Z) is essen-tial for achieving a rapid analysis [8]. In this regard, ACN and water withe/Z ratios of 110.29 and 88.08, respec-tively, should be good candidates. In comparison with water, separation can be performed at extremely high electric field strength when using ACN buffer because of much less Joule heating generated. As mentioned in Sec-tion 1, ACN offers another advantage in terms of sensitiv-ity because the quantum yield of MC 540 in aprotic sol-vent is greater. This is because MC 540 tends to form dim-mers and undergoes a faster photoisomerization, leading to a low quantum yield in protic solvent [28]. However, with a low autoprotolysis constant, the ability to dissolve ionic compounds and keep the stability of ionized solutes is sometimes problematic when using ACN, which leads to irreproducibility and loss of resolution. To overcome these disadvantages and optimize TR, the use of an aqueous mixture containing ACN should be prominent. Recently, Kenndler and co-workers [29, 30] have carefully elucidated the effect of a series of aqueous mixtures on changes in separation selectivity for numerous organic acids. They concluded that viscosity, basicity, and solva-tion properties of aqueous mixtures all play an important role in determining selectivity. Changes in electroosmotic flow and the electrophoretic mobility and apparent disso-ciation of solutes also attribute to different separation results.
Because NACE-ILIF was performed for the separation of ACAs in this study, particular attention should be paid to the effect of solvent on sensitivity. To ensure high sen-sitivity, we tested a number of aqueous mixtures, includ-ing alcohols and ACN. We found that the fluorescence intensity of MC 540 in water is weaker when compared to that in ethanol, ACN, or the mixture of these two sol-vents with water. Unfortunately, the separation of C2-C18 ACAs was failed when using a solution containing 1 mMTA, 30% ethanol, and 70% ACN, pH* 7.4. The use of 100% ethanol to prepare a buffer for separating C2-C18 ACAs was also not successful. The problem is even more serious when using 100% ACN (aprotic sol-vent), presumably because of promoting the formation of ion pairs, thereby reducing the dissociation of ACAs. Although a higher quantum yield of MC 540 could be achieved using aqueous mixtures containing ACN and
alcohols with greater viscosity, such as pentanol and glycerol, problems associated with a long migration time and loss of resolution due to diffusion were found (not shown). For example, the electroosmotic flow (EOF) mobi-lity at 15 kV was 1.93610–4cm2V–1s–1when using an aqueous mixture containing 1 mMTA, 30% glycerol and 40% ACN, pH* 7.4. To this end, we inferred that aqueous mixtures containing ethanol and ACN are good candi-dates.
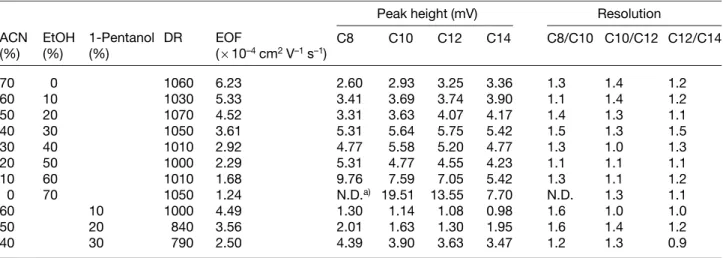
To optimize sensitivity, resolution and speed, we tested a number of aqueous mixtures containing 1 mMTA, with different volume percentages of alcohols and ACN, at pH* 7.4. The overall concentration of organic solvents over 70% is not suitable because the compatibility among three solvents is problematic. Table 1 shows DR values were all above 1000, implying that low limits of detection (LOD) for ACAs could be achieved, and only slightly changed with different fractions of ACN and etha-nol. For comparison, the results obtained using buffers containing ACN and 1-pentanol are also listed. Although the quantum yield of MC 540 is high in 1-pentanol than in ethanol, DR values were lower. The relatively longer separation time, mainly due to the higher viscosity, was another problem. In spite that the quantum yield of MC 540 is much higher in ACN than in ethanol, there is no clear trend in DR with varying the fraction of ACN. We rea-soned that the variation of DR should be due to the changes in the properties of the aqueous mixtures, including polarity, viscosity, and dielectric constant. It is important to note that our system provides a comparable DR with a reported one [31], wherein a DR of 1400 was observed using 8-hydroxypyrene-1,3,6-trisulfonic acid as a probe and a violet (415 nm) diode laser. In terms of resolution and speed, the optimum aqueous mixture con-tains 40% ACN and 30% ethanol.
3.2 Effect of pH
The apparent dissociation constants (pKa*) for acids in aqueous-organic mixtures generally increases by 1–3 units than that in aqueous solution, depending on several fac-tors such as the basicity and the ability to solvate and stabilize anions of the solvent [32]. As suggested that optimum resolution is achieved at pH* around the pKa* of ACAs [19], we investigated the pH effect on sensitivity and resolution, over a pH* range from 6.5 to 8.4. As in aqueous solution, Table 2 stands out slight increases in EOF mobility with increasing pH*. The sensitivity in-creased with increasing pH*, likely due to more efficient displacement (the degrees of the dissociation of MC 540 and ACAs both increased). Although the analysis at pH* 7.9 provided better sensitivity, losses of resolution between C18/C16 and C16/C14 ACAs were observed. In
Table 1. Dependence of the organic solvent on background fluorescence intensity, DR, EOF, peak height and resolution
Peak height (mV) Resolution
ACN (%) EtOH (%) 1-Pentanol (%) DR EOF (610–4cm2V–1s–1) C8 C10 C12 C14 C8/C10 C10/C12 C12/C14 70 0 1060 6.23 2.60 2.93 3.25 3.36 1.3 1.4 1.2 60 10 1030 5.33 3.41 3.69 3.74 3.90 1.1 1.4 1.2 50 20 1070 4.52 3.31 3.63 4.07 4.17 1.4 1.3 1.1 40 30 1050 3.61 5.31 5.64 5.75 5.42 1.5 1.3 1.5 30 40 1010 2.92 4.77 5.58 5.20 4.77 1.3 1.0 1.3 20 50 1000 2.29 5.31 4.77 4.55 4.23 1.1 1.1 1.1 10 60 1010 1.68 9.76 7.59 7.05 5.42 1.3 1.1 1.2 0 70 1050 1.24 N.D.a) 19.51 13.55 7.70 N.D. 1.3 1.1 60 10 1000 4.49 1.30 1.14 1.08 0.98 1.6 1.0 1.0 50 20 840 3.56 2.01 1.63 1.30 1.95 1.6 1.4 1.2 40 30 790 2.50 4.39 3.90 3.63 3.47 1.2 1.3 0.9 a) Not detected
Table 2. Effect of pH* on EOF, peak height, and resolutiona)
Peak height (mV) Resolution
pH* EOF (610–4cm2V–1s–1) C8 C10 C12 C14 C8/C10 C10/C12 C12/C14 6.5 3.44 5.80 6.10 6.20 5.95 1.0 1.1 0.9 6.9 3.56 6.60 6.90 6.80 6.45 1.3 1.1 1.6 7.4 3.61 7.85 7.90 7.90 6.90 1.4 1.4 1.8 7.9 3.63 16.00 14.80 13.20 12.10 1.2 1.2 1.4 8.4 3.88 N.D.b) 35.00 29.00 22.00 N.D. 1.1 1.2
a) Electrophoretic conditions were as in Fig. 2. b) Not detected
terms of resolution and sensitivity, the optimum pH* was 7.4. Because resolution is generally optimized at pH* nears the pKa* values for acids, this result suggested that the pKavalues for C2-C18 ACAs are about 3 units higher than that in aqueous solution.
3.3 Role of co-ions
To achieve high sensitivity and minimize peak distortion, it is important to use the probe with mobility close to that of solutes. However, it is impossible to meet the requirement with a single probe for separating C2-C18 ACAs, which have the effective electrophoretic mobilities ranging from 0.98 to 3.86610–4cm2s–1V–1in aqueous solution [33]. To solve this problem, the use of multiple probes or adding co-ions has been developed [21, 34, 35]. The latter is more easily carried out because suitable probes are difficult to find in NACE-ILIF. Please note that co-ions
are anions appearing in the buffer electrolyte except MC 540. To elucidate the impacts of co-ions on separa-tion performance, the electropherograms for separating C2-C18 ACAs using aqueous mixtures (30% ethanol and 40% ACN) containing 1 mMTA with/without 0.5 mM hydro-gen carbonate (pKa1= 6.35) are depicted in Figs. 2A and B, respectively. The pH* values of the aqueous mixtures with and without hydrogen carbonate were 7.4 and 7.6, respectively. The significant differences, in terms of peak shape, migration time, and system peaks, between these two electropherograms indicate that co-ions play crucial roles in separation. It has been known that the peak pro-file relies on the mobility of the analytes, probe, and co-ions [21]. Whichever has the similar mobility with the analytes, it dominates the replacement. To explore these effects, the magnitude of the electrophoretic mobilities of anions appearing in the system should be provided. The decreasing order at pH* 7.4 is ascorbic acid (pKa= 4.25)
Figure 2. Comparison of the analysis of C2-C18 ACAs under two different buffer conditions at 15 kV. The capil-lary was filled with an aqueous mixture containing 40% ACN, 30% ethanol, 1 mMTA, 10mMMC 540, and (A) in the absence and (B) presence of 0.5 mMsodium hydrogen carbonate, respectively. pH* values were (A) 7.4 in and (B) 7.6, respectively. The samples were separately pre-pared in the aqueous mixture containing (A) 0.5 mM phe-nol in and (B) 0.5 mM sodium hydrogen carbonate. The concentrations of all ACAs were 50mM. The dotted lines were given to measure peak heights.
. C2-C4 ACAs . MC 540 . C6-C18 ACAs .. hydrogen carbonate. The electrophoretic mobilities of butanoic acid, hexanoic acid, octanoic acid, and MC 540 at pH* 7.4 were 1.45, 1.27, 0.92, and 1.43610–4cm2V–1s–1, respectively. With similar mobilities to that of MC 540, the peaks corresponding to butanoic and hexanoic acids are more symmetrical and move close to the second system peak (with the electrophoretic mobility equal to that of MC 540). The fronted peak profile for acetic acid is due to its higher electrophoretic mobility than that of MC 540 [35]. It is important to point out that adding phenol (pKa= 10.09) into the sample is required for separating C6-C18 ACAs when using aqueous mixture without hydrogen carbo-nate. In the absence of phenol, there was only one very
broad peak instead of seven separated peaks. We rea-soned that phenol possibly plays an important role in stacking, so-called sample self-stacking [36].
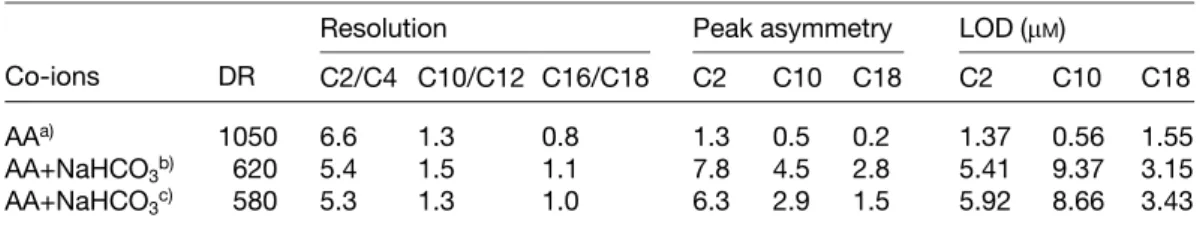
As a result, the peak profiles (fronted) for the analytes migrating earlier than the second system peak were par-tially affected by phenol. On the other hand, the separa-tion of samples containing phenol was not successful when the aqueous mixture contained hydrogen carbo-nate, pH* 7.6. Strangely, the second system peak shown in Fig. 2A disappeared and the peak profiles for n-de-canoic acid and octanoic acid became flatten (Fig. 2B). The appearance of a system peak in front of that corre-sponding to n-octadecanoic acid indicates that hydrogen carbonate acted as a second co-ion. This suggestion is further supported by the fact that the peak profiles shown in Fig. 2B become tailing. It is also important to point out that differential migration times for ACAs under the two different conditions are also due to a slight difference in the EOF mobilities, which were 3.77 and 3.65610–4cm2 V–1s–11 at pH* values 7.4 and 7.6, respectively. A slightly lower EOF mobility in the latter case is likely due to adsorption of sodium ions on the capillary wall, leading to decreases in thez-potential. To compare the results in detail using two different buffer electrolytes, DR, resolu-tion, peak asymmetry, and LOD are summarized in Table 3. Apparently, the analysis under the second con-ditions provided better resolution for larger ACAs, but quantitative determinations of C10 and C8 ACAs are impossible. The fact that a low DR was obtained in the second case also suggested that co-ions play an impor-tant role in determining sensitivity. To this end, we should note that the RSD values of the migration times for all the solutes were less than 2.0%. As discussed above, it should be useful to further improve reproducibility by minimizing the impacts of the system peaks, which could be approached through careful control of the pH as well as the content of organic solvent, and selection of co-ions. Owing to electrolysis and evaporation of the background electrolytes (BGEs) during separation, the use of large volumes of BGE and capping the reservoirs
Table 3. Effect of co-ions on DR, resolution, peak shape, and LOD
Resolution Peak asymmetry LOD (mM)
Co-ions DR C2/C4 C10/C12 C16/C18 C2 C10 C18 C2 C10 C18
AAa) 1050 6.6 1.3 0.8 1.3 0.5 0.2 1.37 0.56 1.55
AA+NaHCO3b) 620 5.4 1.5 1.1 7.8 4.5 2.8 5.41 9.37 3.15
AA+NaHCO3c) 580 5.3 1.3 1.0 6.3 2.9 1.5 5.92 8.66 3.43
a) Conditions were as in Fig. 2A, AA represents ascorbic acid. b) Conditions were as in Fig. 2B.
Figure 3. Electropherogram for 0.5 mM C2-C18 ACAs. Conditions were as in Fig. 2A.
are essential to further improve reproducibility. With respect to the stability of MC 540, the use of low-conduc-tivity BGEs is of considerable importance.
3.4 LOD
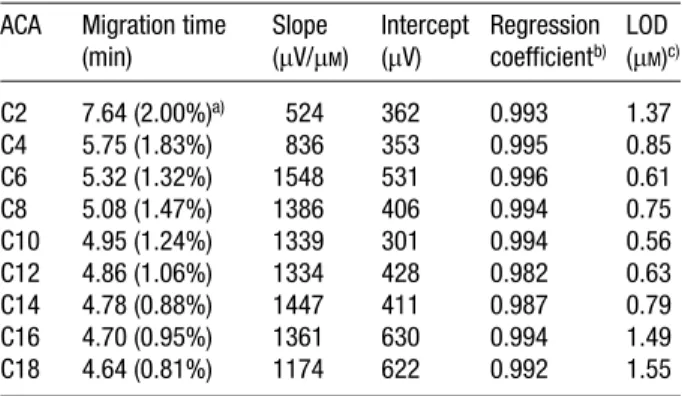
Figure 3 shows the separation of a sample containing 0.5mMC2-C18 ACAs and 0.5 mMphenol. Owing to small amounts of solutes injected, the peaks were separated more completely when compared to Fig. 2A. Because of less sensitivity for large and small solutes, as shown in Table 4, only C4-C14 ACAs were detected. It is important to note that the LOD values at a S/N of 3 for C4-C14 ACAs ranged from 0.56 to 0.85 mM, which are lower about 1–2 orders of magnitude when compared with that by Table 4. Migration time, reproducibility, linear regression
data and LOD ACA Migration time
(min) Slope (mV/mM) Intercept (mV) Regression coefficientb) LOD (mM)c) C2 7.64 (2.00%)a) 524 362 0.993 1.37 C4 5.75 (1.83%) 836 353 0.995 0.85 C6 5.32 (1.32%) 1548 531 0.996 0.61 C8 5.08 (1.47%) 1386 406 0.994 0.75 C10 4.95 (1.24%) 1339 301 0.994 0.56 C12 4.86 (1.06%) 1334 428 0.982 0.63 C14 4.78 (0.88%) 1447 411 0.987 0.79 C16 4.70 (0.95%) 1361 630 0.994 1.49 C18 4.64 (0.81%) 1174 622 0.992 1.55 a) RSD (%), n = 5 b) Linear range: 1.0mMto 0.1 mM
c) Estimated from the electropherogram shown in Fig. 3 at S/N = 3, except that C2, C4, C16, C18 ACAs were estimated from the electropherogram (not shown) when the concentrations were 5mM.
Figure 4. Analysis of acids in a marine lipid concentrate sample. Conditions were as in Fig. 2A.
indirect absorption [37]. Plots of the peak heights as a function of concentration over a range of 1.0 mM to 0.1 mMfor C2-C18 ACAs were linear, with all regression coefficients greater than 0.98. With such as low LOD and good reproducibility (, 2.0% RSD), this method has been proved the potential for trace analysis of ACAs.
3.5 Analysis of acids in marine lipid concentrate
To allow miscibility and minimization of matrix interfer-ence, each aliquot of 10mL marine lipid concentrate was mixed with 9.99 mL of buffer prior to the analysis using aqueous mixtures containing 1 mMTA, 30% ethanol, 40% ACN, pH* 7.4. The electropherogram depicted in Fig. 4 shows that the analysis was complete in 8 min. The peak profiles were broader compared to that shown in Fig. 2A, presumably because of the matrix effect. In order to iden-tify the analytes corresponding to the peaks, we spiked C14 and C16 acids to the sample. On the basis of the increases in the peak heights, we learned the first two peaks corresponding to C14 and C16 acids. According to the linear regression plots listed in Table 4, we esti-mated the concentrations of C16 and C14 ACAs in a tablet of the marine lipid concentrate were 4.506 0.05 and 1.676 0.03 mM(n = 5).
4 Concluding remarks
By taking advantages of MC 540 with a greater stability and quantum yield in aqueous mixtures containing etha-nol and ACN, the sensitivity for the analysis of ACAs has been improved. On the other hand, we have found that adding 0.5 mM phenol into the sample is useful for improving resolution for the analysis of ACAs. Under the
separation conditions, the LOD for n-decanoic acid was down to 0.56mM, mainly due to a high DR (. 1000). With-out a power stabilizer, the sensitivity obtained using a low-cost He-Ne laser is comparable to that by derivatiza-tion with suitable fluorophores using He-Cd or argon-ion lasers. As results show in the analysis of the real samples, this method has proved feasibility for analysis of biologi-cal samples. However, problems associated with matrices and the need to use buffer electrolytes to prepare compli-cated samples must be overcome before this method can be realized for on-line analysis. Owing to the universal characteristics of NACE-ILIF, it is possible to extend this method for the analysis of a number of anions, such as halides, peptides, and catecholamines metabolites, etc. As co-ions play a significant role in determining separa-tion performance, efforts to search for suitable co-ions should be made to make this method more rugged. This work was supported by the National Science Council of the Republic of China (Grant NSC 90-2113-002-058).
Received July 2, 2001
5 References
[1] Heller, C., Electrophoresis 2001, 22, 629–643.
[2] Pantazaki, A., Taverna, M., Vidal-Madjar, C., Anal. Chim. Acta 1999, 383, 137–156.
[3] Hsieh, M.-M., Tseng, W.-L., Chang, H.-T., Electrophoresis 2000, 21, 2904–2910.
[4] Wright, P. B., Lister, A. S., Dorsey, J. G., Anal. Chem. 1997, 69, 3251–3259.
[5] Karbaum, A., Jira, T., Electrophoresis 1999, 20, 3396–3401. [6] Ward, V. L., Khaledi, M. G., J. Chromatogr. A 1999, 859, 203–
219.
[7] Riekkola, M.-L., Jussila, M., Porras, S. P., Valkó, I. E., J. Chromatogr. A 2000, 892, 155–170.
[8] Steiner, F., Hassel, M., Electrophoresis 2000, 21, 3994–4016. [9] Li, J., Fritz, J. S., Electrophoresis 1999, 20, 84–91.
[10] Chiari, M., Kenndler, E., J. Chromatogr. A 1995, 716, 303– 309.
[11] Cherkaoui, S., Veuthey, J.-L., J. Chromatogr. A 2000, 874, 121–129.
[12] Jussila, M., Palonen, S., Porras, S. P., Riekkola, M.-L., Elec-trophoresis 2000, 21, 586–592.
[13] Salimi-Moosavi, H., Cassidy, R. M., Anal. Chem. 1996, 68, 293–299.
[14] Jussila, M., Sundberg, S., Hopia, A., Mäkinen, M., Riekkola, M.-L., Electrophoresis 1999, 20, 111–117.
[15] Gallaher, D. L., Johnson, M. E., Anal. Chem. 2000, 72, 2080– 2086.
[16] Zuriguel, V., Caussé, E., Bounéry, J. D., Nouadje, G., Siméon, N., Nertz, M., Salvayre, R., Couderc, F., J. Chromatogr. A 1997, 781, 233–238.
[17] Wallenborg, S. R., Bailey, C. G., Anal. Chem. 2000, 72, 1872–1878.
[18] Shamsi, S. A., Danielson, N. D., Warner, I. M., J. Chromatogr. A 1999, 835, 159–168.
[19] Chen, M.-J., Chen, H.-S., Lin, C.-Y., Chang, H.-T., J. Chro-matogr. A 1999, 853, 171–181.
[20] Ward, V. L., Khaledi, M. G., J. Chromatogr. B 1998, 718, 15–22.
[21] Doble, P., Haddad, P. R., J. Chromatogr. A 1999, 834, 189– 212.
[22] Yeung, E. S., Kuhr, W. G., Anal. Chem. 1991, 63, 275A–282A. [23] Bocˇek, P., Gebauer, P., Beckers, J. L., Electrophoresis 2001,
22, 1106–1111.
[24] Dabek-Zlotorzynska, E., Keppel-Jones, K., LC?GC 2000, 18, 950–966.
[25] Macka, M., Johns, C., Doble, P., Haddad, P. R., LC?GC 2001, 19, 178–188.
[26] Doble, P., Haddad, P. R., Anal. Chem. 1999, 71, 15–22. [27] Brooker, L. G. S., Craig, A. C., Heseltine, D. W., Jenkins,
P. W., Lincoln, L. L., J. Am. Chem. Soc. 1965, 87, 2443– 2450.
[28] Cˇ underlíková, B., Ikurová, L., Chem. Phys. 2001, 263, 415– 422.
[29] Sarmini, K., Kenndler, E., J. Chromatogr. A 1998, 811, 201– 209.
[30] Sarmini, K., Kenndler, E., J. Chromatogr. A 1999, 833, 245– 259.
[31] Melason, J. E., Boulet, C. A., Lucy, C. A., Anal. Chem. 2001, 73, 1809–1813.
[32] Drange, E., Lundanes, E., J. Chromatogr. A 1997, 771, 301– 309.
[33] Desbène, A. M., Morin, C. J., Mofaddel, N. L., Groult, R. S., J. Chromatogr. A 1995, 716, 279–290.
[34] Johns, C., Macka, M., Haddad, P. R., Electrophoresis 2000, 21, 1312–1319.
[35] Beckers, J. L., Everaerts, F. M., J. Chromatogr. A 1997, 787, 235–242.
[36] Beckers, J. L., Bocˇek, P., Electrophoresis 2000, 21, 2747– 2767.
[37] Roldan-Assad, R., Gareil, P., J. Chromatogr. A 1995, 708, 339–350.