ORIGINAL PAPER
Seasonality in pediatric asthma admissions: the role of climate
and environmental factors
Sudha Xirasagar&Herng-Ching Lin&Tsai-Ching Liu
Received: 24 November 2005 / Accepted: 20 April 2006 / Published online: 23 May 2006
#Springer-Verlag 2006
Abstract
Background Population-based data from Taiwan are used to examine seasonality in pediatric asthma admissions (proxy for asthma exacerbations) and associations with air pollutants and climatic factors. Monthly admission rates per 100,000 population, classified into three age groups, 0∼2, 2∼5, and 6∼14 years (calculated from a total of 27,275 hospitalizations during 1998–2001) were subjected to autoregressive integrated moving average (ARIMA) mod-eling to examine seasonality. Spearman rank correlations were used to examine associations with criterion air pollutants (PM10, SO2, CO, O3, NO2) and meteorological
factors (ambient temperature, relative humidity, atmospher-ic pressure, rainfall, and sunshine hours).
Results Both seasonality and associations with air pollut-ants and climate factors vary by age group. Among under-twos, the rates are lowest in January–February and highest in November, with a trough in June–July. Among pre-schoolers, the rates are lowest in June–July and highest in November, with two upsurges in August and March. Among school-goers, admission rates are lowest during June–August, with upsurges in March and September. The
number of weather and pollutant predictors increases with age. Among under-twos, only two factors, PM10 and
rainfall, significantly predict admissions. For preschoolers, five factors (PM10, CO, O3, temperature, and pressure), and
for school-goers, all air pollutants except NO2, and all
climatic factors except rainfall are significant.
Conclusion Seasonality in pediatric asthma admissions vary by age in a subtropical island setting.
Keywords Seasonality . Asthma admissions . Air pollutants . Climate
Introduction
Increasing prevalence of pediatric asthma with economic development is well documented, and it continues to increase in the developed countries (for example, from 3.6% to 6.2% between 1980 and 1996 in the US [1], and 5.3% to 11.7% between 1986 and 2001 in Denmark [21]). Many developing countries also have high rates, such as Oman, 20.7% in 13–14 year olds and 10.5% in 6–7 year– olds, and Rio De Janeiro in Brazil, 15–19% pediatric asthma rates, depending on local pollutant levels [2–4]. Taiwan, a subtropical island, has also witnessed increasing asthma rates among school children; 1.3%, 5.07%, and 8.45%, respectively, in 1974, 1985, and 1997 [22]. Currently, asthma affects an estimated half a million of its 23 million population, causing 30,500 hospitalizations every year [20].
The seasonality of pediatric asthma is widely docu-mented in the UK, Greece, and Hong Kong [7,15,23]. Yet, the environmental physico-chemical variables mediating asthma attacks remain uncertain. Current literature on real-time seasonal associations with atmospheric pollutants,
S. Xirasagar
Department of Health Services Policy and Management, Arnold School of Public Health, University of South Carolina, Columbia, SC, USA
H.-C. Lin (*)
School of Health Care Administration, Taipei Medical University, 250 Wu-Hsing Street,
Taipei 110, Taiwan, Republic of China e-mail: henry11111@tmu.edu.tw T.-C. Liu
Department of Public Finance, National Taipei University, Taipei, Taiwan, Republic of China
vehicular traffic counts, and meteorological factors is limited to convenience or random samples of subjects [4,
8]. No population-based studies are documented. Popula-tion-based studies can guide clinical and biological research into the etio-pathogenesis of asthma, and enable targeted asthma mitigation programs.
Nationwide claims data from Taiwan’s National Health Insurance Database present a unique opportunity to identify seasonality in asthma severity by using hospitalization as a proxy for severe exacerbations. Due to universal, compre-hensive health benefit coverage of all citizens under National Health Insurance (NHI), the data include all asthma admissions in Taiwan. In addition, the recent development of its local petro-chemical industry has aggravated air pollution levels [24], presenting a window of opportunity to examine pollution-related factors in childhood asthma, concurrent with climatic variations.
Methods
Hospitalization data and study sample
All inpatient claims for children aged 0–14 years admitted during 1998 to 2001 with a principal diagnosis of asthma or asthmatic bronchitis (ICD-9-CM code 493) were studied among a total of 27,275 cases. All admissions were regarded as discrete episodes, even if a patient had multiple admissions during the study period. The study’s focus is to identify the asthma aggravation potential of meteorological and pollution factors. Therefore, each hospitalization, representing each (episode of aggravation), rather than the patient, is treated as the unit of analysis. Patients were categorized into <2 years (very young children), 2∼5 years
(pre-school), and 6∼14 years (school-goers) groups. Na-tional age-specific and gender-specific monthly asthma admission rates per 100,000 population were calculated, based on annual population data.
Air pollution and meteorological data
Monthly average concentrations of five priority air pollut-ants (particulate matter less than 10 microns in PM10, SO2,
CO, O3, and NO2) of Taiwan were calculated by
aggregat-ing daily data from 55 air quality monitoraggregat-ing data banks of Taiwan’s Environmental Protection Administration (EPA). We excluded 11 stations with inadequate air pollutant data and/or were located in the central mountainous area with very little population. Taiwan is a small island (27,000 square miles), stretching to a maximum of 280 miles N–S, and 110 miles E–W, with the moderating coastal influence uniformly present in all inhabited areas. With limited habitable area, its population of 23 million-plus lives under quite uniform conditions of urbanization and industrializa-tion. Therefore, we decided to average the values across all observatories on the island. We use monthly mean data because average values across a month tend to be smoother spatially, and, therefore, may better represent community levels of these pollutants [14]. Similarly, monthly mean meteorological data on ambient temperature, relative humidity, atmospheric pressure, rainfall, and hours of sunshine were calculated from the daily data provided by 23 weather observatories.
Statistical analysis
Monthly asthma admission rates (admissions per 100,000 population) were calculated across the four-year study 0 5 10 15 20 25 30 35 40
Jan Feb Mar April May June July Aug Sep Oct Nov Dec
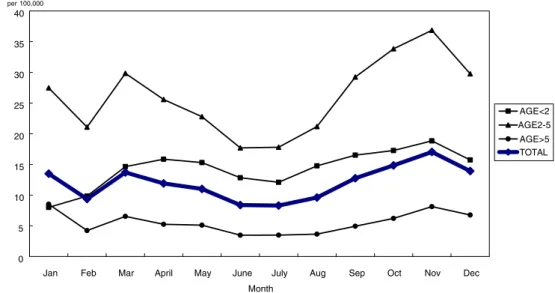
Month Asthma admissions per 100,000 AGE<2 AGE2-5 AGE>5 TOTAL
Fig. 1 Monthly asthma admission rates per 100,000 population by age group
period for males, females, and both, aged <2, 2∼5, and 6∼14 years. Seasonality is a general component of time series pattern. Therefore, the seasonality trend was evalu-ated using autoregressive integrevalu-ated moving average (ARIMA) modeling to capture each variable as a univariate time series function of its past values. ARIMA modeling has been found to be suitable for seasonality studies in past research. ARIMA models account for time trends and detect repetitive patterns representing seasonality, if any. The EViews 4 (2000) computer software package was used for the analyses.
Results
Hospitalization data
Of the total number of 27,275 pediatric hospitalizations, 64% were male. Their age distribution was as follows: <2 years=3,851 (14%); 2∼5 years=15,700 (58%); and >5 years=7,724 (28%). Preschool children had the highest mean admission rate (26.1 per 100,000 population), which
was about four times the average rate for 5–14 year-olds (5.5 per 100,000).
Seasonal variation
Figure 1 illustrates seasonal variations in the monthly admission rates for each age group, and all age groups pooled together. Taiwan’s seasons are spring from February to April, summer from May to July, autumn from August to October, and winter from November to January.
The ARIMA seasonality models for each age group and all age groups together showed distinct seasonality patterns (table not presented). Among under-twos, January and February have similar and the lowest admission rates, rising in March (5.72/100,000 more than January) to a peak in April (point estimate 7.51), then declining to a trough in July (though 4.3 higher than in January), sharply rising again in August, followed by a gradual increase to a peak in November, and declining in December to the lowest trough for the year in January–February. Among preschool children (2∼5 year-olds), June–July show the lowest admission rates (11.98 and 12.18 less than January), followed by a sharp increase in August, a gradual increase to the peak in November, a gradual decline in December that is sustained in January, a sharp, significant fall in February, a short-lived increase in March, and a decline in April and May continuing to the June–July trough. School-goers show the lowest admission rates in June, July, and August (5.40/100,000, 5.37/100,000, and 5.32/100,000 less than January), gradually increasing to the peak during December and January, and then declining in February, showing a short surge in March, and, thereafter, declining gradually to the June–August trough.
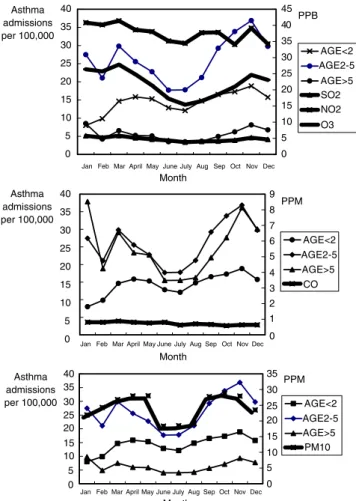
Correlations with air pollutants and climatic factors Associations of asthma admission rates with mean monthly air pollutant levels and climatic factors are presented in Figs.2 and3, respectively. Mean levels of PM10, SO2, CO,
O3, NO2, ambient temperatures, relative humidity,
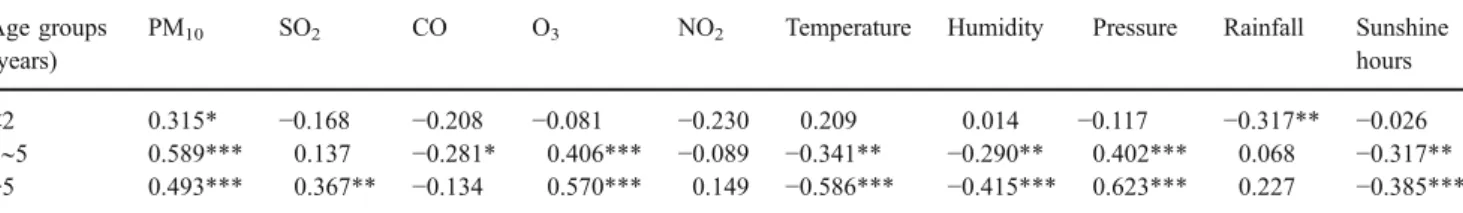
atmospher-ic pressure, rainfall, and sunshine hours were 24.4 ug/m3, 4.7 ppb, 0.73 ppm, 21.9 ppb, 37.6 ppb, 23.9°C, 77.2%, 1,009.8 hPa, 207.8 mm, and 140.3 h, respectively, across the four-year period. Table 1 shows the correlations of monthly admission rates with the rankings of the monthly mean air pollutant levels and climatic factors. In the <2 age group, the monthly admission rates correlated significantly with PM10 (r=0.321, p<0.05) and rainfall (r=−0.330,
p<0.05). For pre-school children, correlations with PM10
(r=0.564, p<0.001), CO (r=0.295, p<0.05), O3 (r=0.368,
p<0.05), ambient temperature (r=−0.353, p<0.05), and pressure (r=0.372, p<0.001) were significant. Among school-goers, correlations were significant with all air 0 5 10 15 20 25 30 35 40 0 5 10 15 20 25 30 35 40 0 5 10 15 20 25 30 35 40
Jan Feb Mar April May June July Aug Sep Oct Nov Dec Month
Jan Feb Mar April May June July Aug Sep Oct Nov Dec Month
Jan Feb Mar April May June July Aug Sep Oct Nov Dec Month Asthma admissions per 100,000 Asthma admissions per 100,000 Asthma admissions per 100,000 0 5 10 15 20 25 30 35 0 5 10 15 20 25 30 35 40 45 PPB AGE<2 AGE2-5 AGE>5 SO2 NO2 O3 0 1 2 3 4 5 6 7 8 9 PPM AGE<2 AGE2-5 AGE>5 CO PPM AGE<2 AGE2-5 AGE>5 PM10
pollutants except NO2, and all climatic factors except
rainfall.
Discussion
Our findings on asthma exacerbation with PM10, CO,
and O3levels in a subtropical island setting are supported
by studies from other countries [8, 16]. Differing season-ality among the three age groups in Taiwan render an “average” assessment of “pediatric” seasonality
question-able, and also makes it difficult to compare our findings with other studies (e.g., Wales, Greece, South Africa, and Finland [6,10, 11, 15]). Variation in seasonal trends with age are widely documented (e.g., UK, US, Greece, and New Zealand [3,7,15]).
In our study, the apparent seasonality discrepancies between age groups are resolved by the pattern of associations: school-goers’ asthma admissions are signifi-cantly predicted by eight out of ten criterion air pollutants and meteorological indicators, whereas among under-twos, only one air pollutant, PM10, and one climatic factor,
0 10 20 30 40 0 10 20 30 40 0 10 20 30 40
Jan Feb Mar April May June July Aug Sep Oct Nov Dec
Month
Jan Feb Mar April May June July Aug Sep Oct Nov Dec
Month
Jan Feb Mar April May June July Aug Sep Oct Nov Dec
Month
Jan Feb Mar April May June July Aug Sep Oct Nov Dec
Month
Jan Feb Mar April May June July Aug Sep Oct Nov Dec
Month Asthma admissions per 100,000 Asthma admissions per 100,000 Asthma admissions per 100,000 Asthma admissions per 100,000 Asthma admissions per 100,000 950 970 990 1010 1030 P(hPa) AGE<2 AGE2-5 PRESSURE 0 10 20 30 40 C AGE<2 AGE2-5 AGE>5 TEMPERATURE 0 5 10 lm AGE<2 AGE2-5 AGE>5 RAINFALL 0 10 20 30 40 0 100 200 300 hr AGE<2 AGE2-5 AGE>5 SUNSHINE 0 10 20 30 40 0 50 100 % AGE<2 AGE2-5 AGE>5 HUMIDITY
Fig. 3 Mean monthly trends of climatic factors
Table 1 Spearman rank correlations of monthly asthma admission rates with air pollutants and climatic factors (n=27,275 hospitalizations) Age groups
(years)
PM10 SO2 CO O3 NO2 Temperature Humidity Pressure Rainfall Sunshine
hours
<2 0.315* −0.168 −0.208 −0.081 −0.230 0.209 0.014 −0.117 −0.317** −0.026
2∼5 0.589*** 0.137 −0.281* 0.406*** −0.089 −0.341** −0.290** 0.402*** 0.068 −0.317**
>5 0.493*** 0.367** −0.134 0.570*** 0.149 −0.586*** −0.415*** 0.623*** 0.227 −0.385***
rainfall, predicts exacerbations. Among preschoolers, five factors (three air pollutants, PM10, CO, and O3, and two
climatic factors, ambient temperature and pressure) predict asthma admissions.
The sharp deviation of under-twos’ asthma seasonality from older children is plausibly due to being mostly home-bound, relatively insulated from outdoor environmental exposures. Being confined to a bed or crawling on the floor, under-twos are likely to experience prolonged exposure to allergens, such as house dust mite Dermatophagoides pteronyssinus (Dp). The growth of Dp is highest at 22– 25°C temperatures and at relative humidity levels of 75– 80%, typical of indoor conditions in Taiwan during August to November. Peak indoor Dp levels in Taiwan have been documented in August–November, declining in December through January, and to a trough in February [12, 19], which coincides with the peaks and troughs of under-twos’ hospitalizations. Clinical-immunological studies have also suggested that mite exposure is an important factor in pediatric asthma in Taiwan [18,19].
Past studies of real-time correlations with dust mite levels and other indoor allergenic exposures, such as cockroaches, indoor water damage/mold, and parent-per-ceived pollution, may have yielded mixed or ambivalent results due to the confounding of indoor and outdoor exposures across age groups [5,25]. Our findings suggest the need for clinical and biomedical exploration into the role of dust mites in infant asthma.
Another factor in the November peak among under-twos could be respiratory syncytial virus (RSV) infections, a widely documented winter virus that predisposes very young children to winter wheezing [4,26]. Due to the lack of data on concurrent RSV in our database, we are unable to explore this issue.
Toddlers’ asthma correlations (PM10, CO, O3,
tempera-ture, and pressure) appear to reflect the activity stage transition that occurs between under-twos and school-goers from home-bound, crawling status to increasing walking and outdoor exposures. School-goers’ asthma correlations with all air pollutants except NO2,are quite similar to adult
asthma correlates [13], probably reflecting the similarity of outdoor exposures of school-goers and adults. During school hours (7:30 am to 4:00 pm), classroom windows and doors (typically at street level or, at the most, a couple of stories high) are kept open, directly exposing children to ambient pollutants and meteorological conditions. Most schools (by design), are almost always in centrally located, busy neighborhoods, increasing school-goers’ exposure to high intensity traffic emissions. By contrast, home-bound infants and toddlers may be protected by the overwhelming preponderance of high-rise buildings for housing (due to very high population density in the inhabited areas). High-rise buildings limit the reach and intensity of traffic-related
pollutants. Schools are typically located in stand-alone spaces, and are hardly two–four stories high. The air-conditioning systems of many homes (in contrast to schools) may further protect infants and toddlers from ambient pollutants.
An inverse relationship between asthma admissions and ambient temperatures among toddlers and school-goers is consistent with several studies. Among school-goers, the sharp upturns in September and March synchronize with school re-openings for the fall and spring semesters (August and February), possibly due to the increased transmission of viral infections [9,17].
Study limitations
Our study has several limitations. Information on parents’ smoking status is not available. We did not control for co-morbidities, including viral infections, which are additional risk factors for hospitalization. Other key items for exploration are the height of the child’s home/school above ground level, location (flyovers and traffic-dense junctions), and concurrent data on house dust mite levels, as well as RSV transmission.
This is a cross-sectional study, with each admission regarded as a discrete episode. We could not identify multiple hospitalizations of the same patient due to the lack of patient identifier information. This limits the study’s utility for distinguishing seasonality effects among habitual versus sporadic sufferers (atopic versus intrinsic asthma).
Air pollution impact studies are often constrained by a high correlation between pollutants, rendering it difficult to pin-point specific causative pollutants. For this reason, multivariate analyses are needed, using longer periods of data for statistical power, region-wise admissions, and weekly averages of pollutant levels. Another study limita-tion is the lack of observatory data on PM2.5 in Taiwan,
which has been recently documented as being aerodynam-ically more significant in lower airway disorders than PM10.
Clinical and policy implications
Despite the above limitations, our findings provide direc-tion for clinical and bio-medical research, chiefly, the role of dust mites and their influence in infant and toddler asthma. Regarding atmospheric pollutants, better emission controls, local pollutant monitoring in busy areas and school neighborhoods, and early warning systems may help to protect susceptible children. Physicians could also be alerted to aggressively abort respiratory infections in predisposed children during such periods. Given current
exhortations to limit antibiotic use to rein in drug resistance, early warnings to provide timely antibiotic treatment may protect susceptible children.
Comprehensive research using longitudinal designs would enable the computation of asthma hospitalization costs that are specifically attributable to vehicular traffic, specific industries, etc. In turn, this may enable cost-effectiveness comparisons between alternatives such as cleaner fuels, improving public transportation, etc.
Acknowledgments We gratefully acknowledge Samuel L. Baker, PhD, Associate Professor, Department of Health Services Policy and Management, University of South Carolina, USA, for his helpful comments. This study is based, in part, on data from the National Health Insurance Research Database provided by the Bureau of National Health Insurance, Department of Health, Taiwan, and managed by the National Health Research Institutes. The interpreta-tions and conclusions contained herein do not represent those of the Bureau of National Health Insurance, Department of Health, or the National Health Research Institutes.
References
1. Akinbami LJ, Schoendorf KC (2002) Trends in childhood asthma: prevalence, health care utilization, and mortality. Pediatrics 10(2 Pt 1):315–322
2. Al-Riyami BM, Al-Rawas OA, Al-Riyami AA, Jasim LG, Mohammed AJ (2003) A relatively high prevalence and severity of asthma, allergic rhinitis and atopic eczema in schoolchildren in the Sultanate of Oman. Respirology 8(1):69–76
3. Blaisedell CJ, Weiss SR, Kimes DS, Levine DS, Myers M, Timmins S, Bollinger ME (2002) Using seasonal variations in asthma hospitalizations in children to predict hospitalization frequency. J Asthma 39(7):567–575
4. Bont L, Steijn M, Aalderen WM, Brus F, Th Draaisma JM, Van Diemen-Steenvoorde RA, Pekelharing-Berghuis M, Kimpen JL (2004) Seasonality of long term wheezing following respiratory syncytial virus lower respiratory tract infection. Thorax 59 (6):512–516
5. Cole Johnson C, Ownby DR, Havstad SL, Peterson EL (2004) Family history, dust mite exposure in early childhood, and risk for pediatric atopy and asthma. J Allergy Clin Immunol 114 (1):105–110
6. Ehrlich RI, Weinberg EG (1994) Increase in hospital admissions for acute childhood asthma in Cape Town, 1978–1990. S Afr Med J 84(5):263–266
7. Fleming DM, Cross KW, Sunderland R, Ross AM (2000) Comparison of the seasonal patterns of asthma identified in general practitioner episodes, hospital admissions, and deaths. Thorax 55(8):662–665
8. Garty BZ, Kosman E, Ganor E, Berger V, Garty L, Weitzen T, Waisman Y, Mimouni M, Waisel Y (1998) Emergency room visits of asthmatic children, relation to air pollution, weather, and airborne allergens. Ann Allergy Asthma Immunol 81(6):563–570
9. Gern JE (2000) Viral and bacterial infections in the development and progression of asthma. J Allergy Clin Immunol 105(2 Pt 2): S497–S502
10. Harju T, Keistinen T, Tuuponen T, Kivela SL (1997) Seasonal variation in childhood asthma hospitalisations in Finland, 1972– 1992. Eur J Pediatr 156(6):436–439
11. Khot A, Burn R, Evans N, Lenney C, Lenney W (1984) Seasonal variation and time trends in childhood asthma in England and Wales 1975–81. BMJ 289(6439):235–237
12. Li CS, Wan GH, Hsieh KH, Chua KY, Lin RH (1994) Seasonal variation of house dust mite allergen (Der pI) in a subtropical climate. J Allergy Clin Immunol 94(1):131–134
13. Lin HC, Xirasagar S (2006) Seasonality in adult asthma admissions, air pollutant levels and climate: a population-based study. J Asthma (in press)
14. Lipfert FW (1994) Air pollution and community health. A critical review and data sourcebook. Van Nostrand Reinhold, New York 15. Priftis K, Anagnostakis J, Harokopos E, Orfanou I, Petraki M,
Saxoni-Papageorgiou P (1993) Time trends and seasonal variation in hospital admissions for childhood asthma in the Athens region of Greece: 1978–88. Thorax 48(11):1168–1169
16. Rosas I, McCartney HA, Payne RW, Calderon C, Lacey J, Chapela R, Ruiz–Velazco S (1998) Analysis of the relationships between environmental factors (aeroallergens, air pollution, and weather) and asthma emergency admissions to a hospital in Mexico City. Allergy 53(4):394–401
17. Storr J, Lenney W (1989) School holidays and admissions with asthma. Arch Dis Child 64(1):103–107
18. Sun HL, Lue KH (2000) Household distribution of house dust mite in central Taiwan. J Microbiol Immunol Infect 33(4):233–236 19. Tang RB, Tsai LC, Hwang HM, Hwang B, Wu KG, Hung MW
(1990) The prevalence of allergic disease and IgE antibodies to house dust mite in schoolchildren in Taiwan. Clin Exp Allergy 20 (1):33–38
20. The Bureau of National Health Insurance. Home page athttp:// www.nhi.gov.tw/english/index.asp?menu=&menu_id=30
21. Thomsen SF, Ulrik CS, Larsen K, Backer V (2004) Change in prevalence of asthma in Danish children and adolescents. Ann Allergy Asthma Immunol 92(5):506–511
22. Tsuang HC, Su HJ, Kao FF, Shih HC (2003) Effects of changing risk factors on increasing asthma prevalence in southern Taiwan. Paediatr Perinat Epidemiol 17(1):3–9
23. Tseng RY, Lo CN, Li CK, Ling TW, Mok MM (1989) Seasonal asthma in Hong Kong and its management implications. Ann Allergy 63(3):247–250
24. Wang TN, Ko YC, Chao YY, Huang CC, Lin RS (1999) Association between indoor and outdoor air pollution and adolescent asthma from 1995 to 1996 in Taiwan. Environ Res 81(3):239–247
25. Wickens K, de Bruyne J, Calvo M, Choon-Kook S, Jayaraj G, Lain CK, Lane J, Maheshwari R, Mallol J, Nishima S, Purdie G, Siebers R, Sukumaran T, Trakultivakorn M, Crane J (2004) The determinants of dust mite allergen and its relationship to the prevalence of symptoms of asthma in the Asia-Pacific region. Pediatr Allergy Immunol 15(1):55–61
26. Viegas M, Barrero PR, Maffey AF, Mistchenko AS (2004) Respiratory viruses seasonality in children under five years of age in Buenos Aires, Argentina: a five-year analysis. J Infect 49 (8):222–228