Energy Procedia 61 ( 2014 ) 2280 – 2283 Available online at www.sciencedirect.com
ScienceDirect
1876-6102 © 2014 The Authors. Published by Elsevier Ltd. This is an open access article under the CC BY-NC-ND license (http://creativecommons.org/licenses/by-nc-nd/3.0/).
Peer-review under responsibility of the Organizing Committee of ICAE2014 doi: 10.1016/j.egypro.2014.12.447
The 6
thInternational Conference on Applied Energy – ICAE2014
A Comparative Study of Energy Efficiency of OECD Countries:
An Application of the Stochastic Frontier Analysis
Jin-Li Hu
a,*
, Satoshi Honma
ba
Institute of Business and Management, National Chiao Tung University, Taiwan
bSchool of Political Science and Economics, Tokai University, Japan
Abstract
We parametrically estimate total-factor energy efficiency (TFEE) scores for 10 industries in 14 developed countries for the period 1995-2005 using stochastic frontier analysis (SFA) technique. The model includes four inputs (labor, capital stock, energy, and non-energy intermediate inputs) and one output (value added). Unlike previous studies that use data envelopment analysis (DEA), our method can take into account statistical noises. The results show that More than half of the industries have insignificant changes in the inefficiency trend. However, construction, paper, and textile industries have significantly increasing inefficiency (decreasing efficiency). The metal industry is the only industry which has decreasing inefficiency (increasing efficiency). As a result, most of the OECD industries have much room in improving their total-factor energy efficiency. M oreover, more than half of the industries have insignificant changes in the inefficiency trend. However, construction, paper, and textile industries have significantly increasing inefficiency. The metal industry is the only industry which has decreasing inefficiency. As a result, most of the OECD industries have much room in improving their total-factor energy efficiency.
© 2014 The Authors. Published by Elsevier Ltd.
Selection and/or peer-review under responsibility of ICAE
Keywords: Industry Energy Efficiency, Stochastic frontier analysis (SFA), Total-factor energy efficiency (TFEE), International
comparison
* Corresponding author. Tel.: +886-2-23812386 x 57641; Fax: +886-2-23494922.
E-mail address:[email protected]
© 2014 The Authors. Published by Elsevier Ltd. This is an open access article under the CC BY-NC-ND license (http://creativecommons.org/licenses/by-nc-nd/3.0/).
Jin-Li Hu and Satoshi Honma / Energy Procedia 61 ( 2014 ) 2280 – 2283 2281
1. Introduction
Since Hu and Wang [1] and Hu and Kao [2] construct the total-factor energy efficiency (TFEE) index, it has been widely applied and improved by the following literature [3]. However, most of the existing literature applies the TFEE index to analyze regional or economy-wide energy efficiency. The application of TFEE to industry-wide energy efficiency still remains to apply and promote. Moreover, most of the existing papers applying TFEE use only the traditional CCR [4] and BCC [5] models. More advanced DEA approaches or the use of stochastic frontier to co mpute or estimate TFEE can still be further tried, as this two-year pro ject will do. We apply and extend the SFA model proposed by Zhou, Ang and Zhou [6] to estimate the industry energy efficiency across countries in different years. This paper is a co mpanion paper of our previous work, Honma and Hu [7] in wh ich we resorted to the DEA technique measure the industry-level TFEE.
Nomenclature
D() distance function
Kit capital stock
Lit labor employment
Iit non-energy intermediate inputs
Eit energy input
Yit real economic output
i region t time
vit statistical noise
uit inefficiency term
2. Methodology and Data
Following Zhou, Ang and Zhou [6], we assume that the stochastic frontier distance function is included in the Cobb–Douglas function as
ln D (Kit, Lit, Eit, Yit) = E0 + EK lnKit + EL lnLit + EI lnIit + EE lnEit + EY lnYit + vit (1) Because the distance function is homogeneous to degree one in the energy input, the above equation can be rearranged as:
ln DE (Kit, Lit, Eit, Yit) = lnEit + E0 + EK lnKit + EL lnLit + EI lnIit + EEln1 + EYlnYit + vit (2) which can be also be arranged as
-lnEit = E0 + EKlnKit + ELlnLit + EI lnIit + EE ln1 + EYlnYit + vit - lnDE (Kit, Lit, Eit, Yit) (3) That is,
2282 Jin-Li Hu and Satoshi Honma / Energy Procedia 61 ( 2014 ) 2280 – 2283
The TFEE of region i at time t is then
TFEEit = exp(−uit) (5) The above model can be estimated by using the panel data SFA model proposed by Basttese and Coelli [8]. This model includes four inputs (labor, capital stock, energy, and non-energy intermed iate inputs) and one output (value added). The economic data are taken fro m EU-KLEM S 2008, while data on purchasing power parity (PPP) are also fro m EU-KLEM S. The values for the variables are in Eu ros with 1997 as the base year. The energy and economic dataset contains 10 industries in 14 developed countries for the period 1995-2005. The countries include Australia, Austria, the Czech Republic, Den mark, Fin land, Germany, Italy, Japan, South Korea, the Netherlands, Portugal, Sweden, the United Kingdom, and the United States. The industries include the construction industry; the chemical and petrochemical industry; the food and tobacco industry; the iron, steel, and non -ferrous metals industries; the machinery industry; the non-metallic minerals industry; the paper, pulp and printing industry; the textile and leather industry; the transport equipment industry; and the wood and wood products industry.
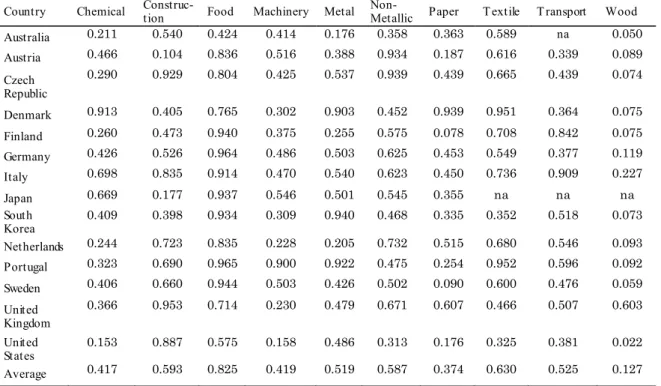
Table 1 Mean total-factor energy efficiencies for 10 industries during 1995-2005
Country Chemical Construc-tion Food Machinery Metal Non-Metallic Paper T extile T ransport Wood
Australia 0.211 0.540 0.424 0.414 0.176 0.358 0.363 0.589 na 0.050 Austria 0.466 0.104 0.836 0.516 0.388 0.934 0.187 0.616 0.339 0.089 Czech Republic 0.290 0.929 0.804 0.425 0.537 0.939 0.439 0.665 0.439 0.074 Denmark 0.913 0.405 0.765 0.302 0.903 0.452 0.939 0.951 0.364 0.075 Finland 0.260 0.473 0.940 0.375 0.255 0.575 0.078 0.708 0.842 0.075 Germany 0.426 0.526 0.964 0.486 0.503 0.625 0.453 0.549 0.377 0.119 Italy 0.698 0.835 0.914 0.470 0.540 0.623 0.450 0.736 0.909 0.227 Japan 0.669 0.177 0.937 0.546 0.501 0.545 0.355 na na na South Korea 0.409 0.398 0.934 0.309 0.940 0.468 0.335 0.352 0.518 0.073 Netherlands 0.244 0.723 0.835 0.228 0.205 0.732 0.515 0.680 0.546 0.093 Portugal 0.323 0.690 0.965 0.900 0.922 0.475 0.254 0.952 0.596 0.092 Sweden 0.406 0.660 0.944 0.503 0.426 0.502 0.090 0.600 0.476 0.059 United Kingdom 0.366 0.953 0.714 0.230 0.479 0.671 0.607 0.466 0.507 0.603 United States 0.153 0.887 0.575 0.158 0.486 0.313 0.176 0.325 0.381 0.022 Average 0.417 0.593 0.825 0.419 0.519 0.587 0.374 0.630 0.525 0.127 3. Results
3.1 total-factor energy efficiency
More than half of the industries have insignificant changes in the inefficiency trend. However, construction, paper, and textile industries have significantly increasing inefficiency (decreasing efficiency). The metal industry is the only industry which has decreasing inefficiency (increasing
Jin-Li Hu and Satoshi Honma / Energy Procedia 61 ( 2014 ) 2280 – 2283 2283
efficiency). As a result, most of the OECD industries have much room in improving their total-factor energy efficiency.
Countries perform quite d ifferently in d ifferent industries. The best performers in d ifferent industries are: chemical (Den mark), construction (United Kingdom), food (Portugal), machinery (Po rtugal), metal (South Korea), non-metallic (Czech Republic), paper (Den mark), textile (Portugal), transport (Italy), and wood (United Kingdom).
Table 1 presents the mean total- factor energy efficiencies for 10 industries during 1995-2005. c The average total-factor energy efficiency scores are: chemical (0.417), construction (0.593), food (0.825), mach inery (0.419), metal (0.519), non-metallic (0.587), paper (0.374), textile (0.630), transport (0.525), and wood (0.127).
3.2 Comparison of DEA and SFA TFEE
We compare the SFA TFEEs obtained in this study with the DEA TFEEs in our earlier work [ 7] for each industry. Due to the space limitation, figures for the comparison are omitted in this proceedings paper. We can observe that, if the number of DM Us is s mall like this study, the SFA TFEE approach has a higher discriminating power than DEA.
4. Concluding Remarks
In this paper, we parametrically measure industry-level TFEEs of 10 industries of 14 developed countries using the SFA technique with consideration for statistical noises. Using a panel data set, even when the total number of DM Us are small like this study, one can measure the total-factor energy efficiency by SFA. We believe that this SFA approach provides an alternative measure of the total-factor energy efficiency.
The next step would be to introduce developed stochastic models in the SFA literature. Our model does not include any environmental variables. Using the technical inefficiency effects model provided by Batttese and Coelli [9] can lead to explore determinants of the inefficiency.
References
[1] Hu JL, Wang SC. T otal-factor energy efficiency of regions in China. Energy Policy 2006; 34: 3206-17. [2] Hu JL, Kao CH. Efficient energy-saving targets for APEC economies. Energy Policy 2007; 35: 373-82.
[3] Zhou, P, Ang- B.W.-!Zhou, D.Q. Measuring economy-wide energy efficiency performance: a parametric frontier approach. Applied Energy 2012; 90: 196-200.
[4] Charnes A, Cooper WW., Rhodes E. Measuring the Efficiency of Decision Making Units. European Journal of Operational Research 1978; 2: 429-444.
[5] Banker, RD, Charnes A, Cooper WW. Some Models for Estimating T echnical and Scale Efficiencies in Data Development Analysis. Management Science 1984; 30: 1078-1092.
[6] Zhou P, Ang BW-!Zhou DQ. Measuring economy-wide energy efficiency performance: a parametric frontier approach. Applied Energy 2012; 90: 196-200.
[7] Honma S, Hu JL. Industry-level total-factor energy efficiency in developed countries: A Japan-centered analysis. Applied Energy 2014; 119: 67-78.
[8] Battese GE, Coelli TJ. Frontier production functions, technical efficiency and panel data: with application to paddy farmers in India. Journal of Productive Analysis 1992; 3: 153-169.
[9] Battese GE, Coelli T J. A model for technical inefficiency effects in a stochastic frontier production function for panel data. Empirical Economics 1995; 20: 325-332.