F. Rothlauf et al. (Eds.): EvoWorkshops 2005, LNCS 3449, pp. 125–135, 2005. © Springer-Verlag Berlin Heidelberg 2005
GEMPLS: A New QSAR Method Combining Generic
Evolutionary Method and Partial Least Squares
Yen-Chih Chen1, Jinn-Moon Yang2, Chi-Hung Tsai1, and Cheng-Yan Kao1 1 Department of Computer Science and Information Engineering,
National Taiwan University, Taipei, Taiwan {r91051, d90008, cykao}@csie.ntu.edu.tw
2 Department of Biological Science and Technology & Institute of Bioinformatics, National Chiao Tung University, Hsinchu, Taiwan
moon@cc.nctu.edu.tw
Abstract. We have proposed a new method for quantitative structuactivity re-lationship (QSAR) analysis. This tool, termed GEMPLS, combines a genetic evolutionary method with partial least squares (PLS). We designed a new genetic operator and used Mahalanobis distance to improve predicted accuracy and speed up a solution for QSAR. The number of latent variables (lv) was encoded into the chromosome of GA, instead of scanning the best lv for PLS. We applied GEMPLS on a comparative binding energy (COMBINE) analysis system of 48 inhibitors of the HIV-1 protease. Using GEMPLS, the cross-validated correlation coefficient (q2) is 0.9053 and external SDEP (SDEPex) is 0.61. The results
indi-cate that GEMPLS is very comparative to GAPLS and GEMPLS is faster than GAPLS for this data set. GEMPLS yielded the QSAR models, in which selected residues are consistent with some experimental evidences.
1 Introduction
QSAR techniques are commonly regarded as a key role to computational molecular design. The major goal of QSAR is to formulate mathematical relationships between physicochemical properties of compounds and their experimentally determined in
vi-tro biological activities. Thus the derived QSAR model can be subsequently used to
predict the biological activities of new derivatives. A good QSAR model both en-hances our understanding of the specifics of drug action and provides a theoretical foundation for lead optimization 1.
Many QSAR methodologies have been studied, such as comparative molecular field analysis (CoMFA) 2, the partial least square (PLS) 3, comparative molecular binding energy analysis (COMBINE) 4,5. Among those methodologies, the PLS analy-sis is able to deal with strongly collinear input data and make no restriction on the number of variables used. Unfortunately, the predictive performance of PLS model drops and the PLS model becomes complicated when the number of features in-creases. Several feature selection methods for PLS have been proposed, in which ge-netic algorithm (GA) combined with PLS approach (GAPLS) has demonstrated the improvement on the prediction and interpretation of model 6. The essence of GA is to
mimics the metaphor of natural biological evolution. GA operates on a population of potential solutions applying the principle of survival of the fittest to produce succes-sively better approximations to optimum solution. Hasegawa et al. 7 examined a set of 48 human immunodeficiency virus type I (HIV-1) protease inhibitors by applying GAPLS to the variables derived from COMBINE. Several improved GAPLS models with significantly better predictability than the original study were formulated 5,7,8.
However, the accuracy of GAPLS was still blemished by many features especially deriving from CoMFA or COMBINE. The numerous noise features, which GAPLS did not eliminated completely, were interfered with the significant features strongly correlating with biological activity. Besides, with regard to each possibly select fea-ture set GAPLS needed to spend additional time to decide the optimum number of la-tent variables (lv) through PLS.
Here, we have developed an efficient method for evolving QSAR models by intro-ducing a number of successive refinements which can be summarized as follows: 1) An extra bit lv, representing the number of latent variables, was appended to the chromosome of GA and expected to efficiently solve the problem of the optimum number of latent variables though evolutionary process; 2) Mahalanobis distance was adopted to select significant features from numerous features from COMBINE; 3) A new genetic operator, called biased mutation, was designed to lead the evolution of GA toward significant feature set and to reduce the interference of noise features. In this paper, we proposed a new QSAR method by integrating a generic evolutionary method, modified and enhanced from our previous works 9,10 and above issues, and PLS (GEMPLS). GEMPLS is general able to evolve the relationship between biologi-cal activities and compound features generated by other methods, such as CoMFA and COMBINE. Here we applied GEMPLS to evolve the QSAR models according to the interaction energy features generated by the COMBINE method on 48 HIV-1 pro-tease inhibitors. Experiments show that GEMPLS is able to improve the predictability and efficiency, at the same time, the selected residues in the yielded QSAR model are consistent with some experimental evidences.
2 Material and Methods
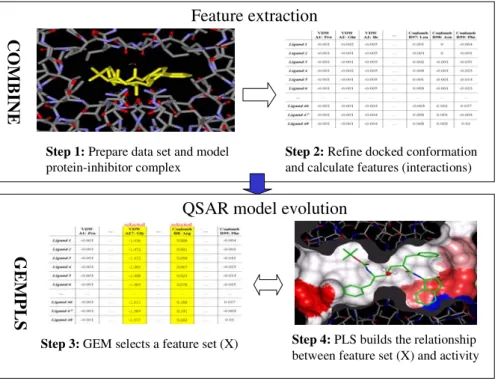
Fig. 1 shows the main steps of applying GEMPLS in the COMBINE analysis: 1) pre-pare the inhibitor set and model inhibitor complexes; 2) refine protein-inhibitor complexes and calculate features (i.e., energy interactions); 3) select impor-tant features by Mahalanobis distance; 4) select features and evolve QSAR models. Each step is described in the following subsections.
2.1 COMBINE: Feature Extraction
The COMBINE analysis is the use of structural information about ligand-receptor complexes 4,5. When the three-dimensional structure of macromolecule is available, ligand-receptor interaction energies could be calculated as features, which are sub-jected to statistical analysis in COMBINE. A subset of these features will be account
for the ligand affinity. The critical interaction patterns between ligands and the recep-tor could be identified and be used to derive the correlation of binding affinities.
Step 1: Prepare data set and model protein-inhibitor complex
Step 2: Refine docked conformation and calculate features (interactions)
Step 3: GEM selects a feature set (X) Step 4: PLS builds the relationship between feature set (X) and activity
CO
M
B
INE
GEMPLS
Feature extraction
QSAR model evolution
Fig. 1. The framework and steps of GEMPLS applied in the COMBINE analysis
2.1.1 Prepare Data Sets and Model Protein-Inhibitor Complexes
Here, we have chosen 48 inhibitors of human immunodeficiency virus type I (HIV-1) protease studied in previous works 5,7,8. The chemical structures of HIV-1 protease in-hibitors and the 48 complexes were modeled on the crystallographic structure of the complex of HIV-1 protease with L-689,502 solved at 2.25A resolution 11 using the in-teractive graphics program Insight II. All crystallographic waters were removed with the exception, which is involved in hydrogen bonding with the NH's of the flap resi-dues IleA50 and IleB50 and the oxygen of the inhibitors 12. All inhibitors were built using L-689, 502 as a template except for the more differential inhibitors 39-45, which employed the inhibitor saquinavir from the HIV-1 protease complex (protein data bank is 1c6z) as a template.
2.1.2 Refine Protein-Inhibitor Complexes and Calculate Features (Interactions)
Each complex model was performed a mild and progressive refinement. The flexibil-ity of each inhibitor was manually explored as necessary to obtain a satisfactory formation in the enzyme active site, which also corresponded to a low energy con-former. The docked conformation of an inhibitor was energy minimized in the three
stages using the consistent valence force field, CVFF 13. In the first stage, the hydro-gen atoms of each complex were allowed reorient. Then the geometry of the inhibitor was optimized while the atoms of both the protein and the water were held fixed. Fi-nally, the whole complex was energy minimized but the protein atoms were restrained to their crystallographic positions. Atom-centered charges for all the inhibitors were derived by fitting the molecular electrostatic potential calculated with the AM1 Ham-iltonian 14 to a monopole-monopole expression 15.
The calculated ligand-receptor interaction energies in the refined complexes were partitioned on a per residue basis. Since HIV-1 protease has two protein subunits (subunit A and subunit B) of 99 amino acids, and two energy contributions (van der Waals and electrostatic) are considered for each residue. There are 396 features were yielded to characterize each protein-inhibitor complex. A data matrix was built with 396 columns representing each of the interaction energy features and with 48 rows representing each inhibitor in the data set.
2.2 GEMPLS: QSAR Model Evolution
PLS has played a critical role in the derivation of QSAR in CoMFA or COMBINE studies. Recently, more and more people recognize the benefits of feature selection before PLS regression. GAPLS has been shown as a practical solution. But when the number of features becomes large, GAPLS still has difficulty in driving out noises. And scanning for best lv is too inefficient and time consuming. Here, we introduce a number of successive enhancements, which are described in the following paragraphs, to construct our model GEMPLS to overcome the drawbacks of GAPLS.
The general idea of PLS is to try to extract these latent variables, accounting for as much of the manifest feature variation as possible while modeling the inhibitory ac-tivities well. To decide both the optimum number of latent variables and prediction error of a QSAR model, we defined the weighted standard deviation error of the pre-dictions (WSDEP) as the scoring function of our GEMPLS:
(
)
2 , 100 1 95 lv i pred i y y WSDEP N lv − = − −⎛
⎞
⎜
⎟
⎝
⎠
∑
, (1)where yi and ypred,i are the observed and predicted inhibitory activities belong to
in-hibitor i, N is the total number of samples, and lv is the number of latent variables in the current model. In order to improve on the efficiency, we append an extra bit lv, representing the number of latent variables, to the original chromosome and expect GEMPLS model to efficiently solve the problem of the optimum number of latent variables though evolutionary process.
2.2.1 Select Features by Mahalanobis Distance
Mahalanobis distance is able be used to measure the deviation of a sample from the mean of the distribution in multivariable calculus. Therefore, the Mahalanobis dis-tance is adopted to identify significant features from all of those.
(
)
(
)
2 1
M is the Mahalanobis distance from the feature vector v (column vector of data matrix
here) to the mean vector µ, where Σ is the covariance matrix of the features.
2.2.2 Feature Selections and QSAR Models Evolution
The inhibitory activity usually correlates with few important interaction energy fea-tures, that is, most of interaction energy features are meaningless or not apparently distinct from each other. GEM was applied to find out the significant interaction en-ergy features and PLS was used to build the QSAR models based on these selected features. WSDEP was used as the objective function to provide a measure of how the internal predictability with respect to the selected features. The fittest individual will have the lowest WSDEP.
GEM, modified and enhanced from our previous works 9,10, consists of five steps briefly described in the following:
(1) Initiation and evaluation of the initial population (Gt=0). Each chromosome
is composed by an array of feature set and an lv value. For example, a chromosome has n+3 bits if the number of candidate feature is n and three bits for lv value. The ini-tial population (Gt=1) of population size (Np) is created by setting feature bits (0
de-note the absence of corresponding feature, and 1 dede-note its presence) and an lv value (denote the number of latent variables and range in [1~5]) of each chromosome to random values and one, respectively. Then PLS is used to build a quasi-QSAR model, and evaluated by the scoring function (WSDEP), for each chromosome.
(2) Selection of the reproductive population. The chromosomes of reproductive population (PsGt) are selected from the population (Gt) with a fixed proportion (Ps)
according to the stochastic universal sampling 16.
(3) Crossover and mutate the reproductive population (PsGt). The offspring
population (Goff) is generated by uniform crossover with a probability (crossover rate:
Pc) and mutation operators, including uniform and biased mutation operators, with a
probability (mutation rate: Pm).
(4) Evaluation of the offspring population (Goff). PLS is then used to build a
quasi-QSAR model, evaluated by WSDEP, for each chromosome in the offspring population.
(5) Reinsertion of the child population. To form the population of the next gen-eration (Gnext), the chromosomes of the current population (Gt) with lower objectives
in the preceding (1- Ps) proportion are protected to the next generation, while the
oth-ers are replaced with better ones from the offspring population (Goff). Let t = t+1 and
Gt = Gnext.
(6) The cycle of above four steps (from step 2 to 5) is repeated until the number of generation reaches to the maximum number of generations (Nmax). The values of
em-pirical parameters are defined as follows: Np = 100, Nmax = 200, Ps = 0.9, Pc = 0.6, and
Pm = 0.05.
Biased Mutation. The uniform mutation may incur a risk of local convergence and
slow evolution because plenty of features will raise the combinatorial complexity of feature space. To reduce the phenomena, the uniform mutation was cooperated with
biased mutation to lead the evolution of GA toward significant feature set and to re-duce the interference of noise features.
( )
(
)
1 f i i f N x F x MIN MAX MINN − = + − × −
⎛
⎞
⎜
⎟
⎝
⎠
, (3)where F(xi) is the probability of selection of feature i; xi is the rank of feature i in the
descending order of Mahalanobis distance of all features, MIN and MAX are the lower and upper bounds, respectively, of probability of biased mutation; Nf is the number of
significant features. The value of F(xi) is derived from xi only when xi is ahead of Nf,
otherwise F(xi) is set to MIN. The meaning of F(xi) is that the more significant
fea-ture, the more higher probability of selection. In this study, MAX=0.8, MIN=0.2 and
Nf =39.
2.3 Performance Evaluation
The predictability of QSAR model was assessed by the conventional correlation coef-ficient (r2), the cross-validated correlation coefficient (q2), the cross-validated SDEP (SDEPcv), and external SDEP (SDEPex):
(
)
(
)
2 , 2 2 1 i pred i i y y q y y − = − −∑
∑
, (4)(
)
2 , i pred i y y SDEP N − =∑
, (5)where yi and ypred,i are the observed and predicted activity of inhibitor i, ypred,i,
respec-tively, y is the average activity value of the inhibitor set, and N is the total number of inhibitors. The model with more remarkable predictability can provide the higher cor-relation coefficient (r2, q2) and the lower SDEP between the observed and predicted inhibitory activities.
3 Results and Discussion
To evaluate the performance of PLS, GAPLS, and GEMPLS, 48 compounds shown in Table A (see appendix) were randomly divided into 6 subsets, and a six-fold cross validation was performed. For each round, one subset (8 compounds) was used as evaluation set, and other subsets (40 compounds) were used to train a QSAR model by Leave-One-Out method to optimize WSDEP. Table 1 shows the results, which were the average values of the six-fold cross validation. Five filter conditions (M>0,
M>1, M>5, M>10, and M>15) of Mahalanobis distance of features were used to
pre-screen candidate features before GA feature selection steps. That is, there were five kinds of data matrices (396 (M>0), 188 (M>1), 85 (M>5), 48-by-59 (M>10), and 48-by-39 (M>15)) to be examined on those QSAR models according to these five conditions.
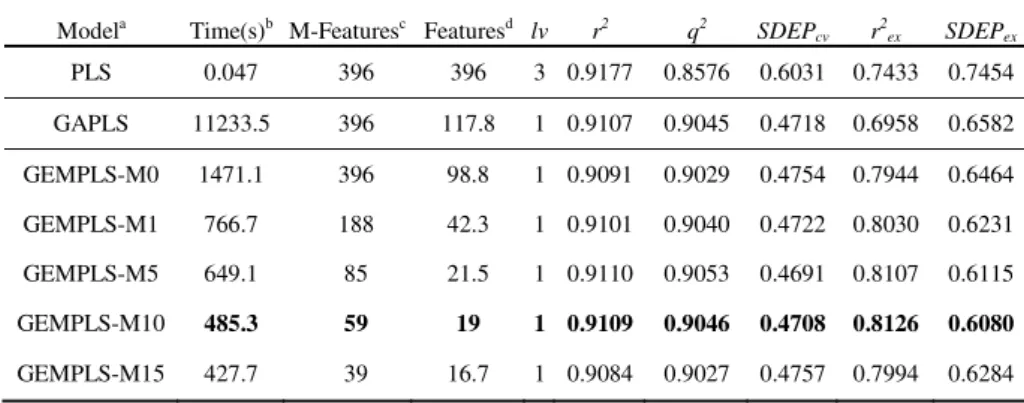
Table 1 shows the execution times, the numbers of selected features, and the values of lv of PLS, GAPLS and GEMPLS with five different Mahalanobis distance criteria. Several widely used performance measures, correlation coefficient (r2), cross-validated correlation coefficient (q2), cross-validated SDEP (SDEPcv), external
corre-lation coefficient (r2ex), and external SDEP (SDEPex), were also summarized in Table
1. With the increasing of the degree of filter criteria, the better results were obtained for GEMPLS when the Mahalanobis distance threshold is less than 10. The highest
SDEPex (0.6080) was obtained by GEMPLS with Mahalanobis distance threshold 10.
These results reveal that the usage of Mahalanobis distance could successfully dis-criminate significant features and reduce the ill effect of numerous features generated by the COMBINE method. But when the Mahalanobis distance threshold get higher, the performance degraded due to some important features were filtered out. The ad-justment of proper amount of significant features would further improve the predict-ability and interpretation of QSAR models.
Table 1. The average predictive accuracies of PLS as well as GAPLS and GEMPLS with five different Mahalanobis distances for the HIV-1 protease by six-fold cross validation
a
GEMPLS-M0, M1, M5, M10, M15 mean that GEMPLS analysis performed with feature sets filtered by different Mahalanobis distance thresholds (i.e., 0, 1, 5, 10, and 15).
b
The executing time is measured on a single-processor of 1.4GHz/PentiumIV PC in seconds. c
The number of candidate features is selected by the Mahalanobis distance. d
The number of selected features is finally selected by GEMPLS and Mahalanobis distance.
The COMBINE method essentially generates numerous interaction energy features and the usage of Mahalanobis distance is able to reduce the number of these features. One of the evolutionary forces of GEMPLS is come from Mahalanobis distance be-tween a wide distribution of features. At the same time, GEMPLS could decide the optimum number of latent variables for each chromosome though evolutionary proc-ess since the lv bit was encoded in the chromosome. Table 1 shows that GEMPLS is much faster than GAPLS and slightly better than GAPLS on this data set. Both GEMPLS and GAPLS outperform PLS.
Modela Time(s)b M-Featuresc Featuresd lv r2 q2 SDEP
cv r2ex SDEPex PLS 0.047 396 396 3 0.9177 0.8576 0.6031 0.7433 0.7454 GAPLS 11233.5 396 117.8 1 0.9107 0.9045 0.4718 0.6958 0.6582 GEMPLS-M0 1471.1 396 98.8 1 0.9091 0.9029 0.4754 0.7944 0.6464 GEMPLS-M1 766.7 188 42.3 1 0.9101 0.9040 0.4722 0.8030 0.6231 GEMPLS-M5 649.1 85 21.5 1 0.9110 0.9053 0.4691 0.8107 0.6115 GEMPLS-M10 485.3 59 19 1 0.9109 0.9046 0.4708 0.8126 0.6080 GEMPLS-M15 427.7 39 16.7 1 0.9084 0.9027 0.4757 0.7994 0.6284
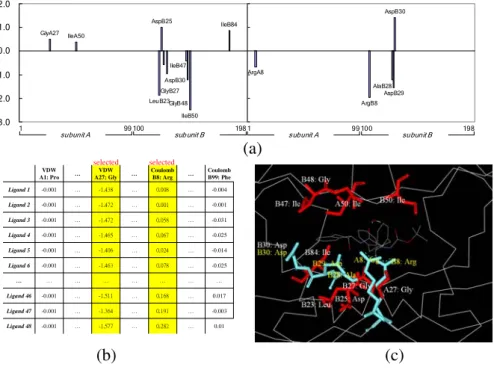
Figure 2 shows a typical QSAR model yielded by GEMPLS. This model reveals some experimental evidences. Figure 2(b) shows the features selected by GEMPLS and Figure 2(a) indicates the pseudo coefficients of the QSAR model evolved by PLS according to these selected features. This evolved QSAR model reflects some important residues of HIV-1 protease shown in Figure 2(c). Residues Asp25, Thr26, and Gly27 are highly conserved catalytic triad and Asp25 is essential to both catalyti-cally and structurally. Residues Ala28 and Asp30 located at subsite S2. The mobile flap, residues 46-54, contains three characteristic regions: side chains that extend out-ward (Met46, Phe53), hydrophobic chains extending inout-ward (Ile47, Ile54), and a gly-cine rich region. Residues Pro81, Val82, and Ile84 form the binding pocket. Residues Arg8 and Asp29 at the subsite S3, potentially bind polar residues. These results show that our QSAR model is able to yield many biological meanings.
ArgA8 ArgB8 AspB29 AspB30 AlaB28 -3.0 -2.0 -1.0 0.0 1.0 2.0 GlyA27 IleA50 LeuB23 AspB25 IleB50 IleB84 GlyB27 AspB30 GlyB48 IleB47 -3.0 -2.0 -1.0 0.0 1.0 2.0 subunit A subunit B 1 99 100 198 subunit A subunit B 1 99 100 198 … … … … … … … … … … … 0.01 … 0.282 … -1.577 -0.001 Ligand 48 -0.003 … 0.191 … -1.364 -0.001 Ligand 47 0.017 … 0.168 … -1.511 -0.001 Ligand 46 … … … … … … … -0.025 … 0.078 … -1.463 -0.001 Ligand 6 -0.014 … 0.024 … -1.406 -0.001 Ligand 5 -0.025 … 0.067 … -1.465 -0.001 Ligand 4 -0.031 … 0.058 … -1.472 -0.001 Ligand 3 -0.001 … 0.001 … -1.472 -0.001 Ligand 2 -0.004 … 0.008 … -1.438 -0.001 Ligand 1 Coulomb B99: Phe … Coulomb B8: Arg … VDW A27: Gly VDW A1: Pro selected selected
(a)
(c)
(b)
Fig. 2. GEMPLS evolves a typical QSAR model of the HIV-1 protease. a) The pseudo coeffi-cients of QSAR model, b) features selected by GEMPLS, and c) the important residues of the QSAR model are consistent with some experimental evidences
4 Conclusions
In summary, we have developed an evolutionary method with a novel scoring func-tion for evolving QSAR models. By integrating a number of genetic operators, each having a unique search mechanism, GEMPLS blends the local and global searches so that they work cooperatively. Our scoring function is indeed able to enhance the
pre-diction accuracy. GEMPLS not only increases the predictability and interpretation of a QSAR model, but also improves the performance and efficiency for feature selec-tion. Our results demonstrate the applicability and adaptability of GEMPLS for QSAR models.
References
(1) Kubinyi, H. QSAR and 3-D QSAR in drug design. 2. Applications and problems. Drug
Discovery Today 1997, 2, 538-546.
(2) Cramer, R. D.; Patterson, D. E.; Bunce, J. D. Comparative molecular field analysis (CoMFA). 1. Effect of shape on binding of steroids to carrier proteins. Journal of the
American Chemical Society 1988, 110, 5959-5967.
(3) Wold, S.; Johansson, E.; Cocchi, M. PLS - Partial least-squares projections to latent structures. In H.Kubinyi Ed., 3D QSAR in Drug Design; Theory, Methods and Applica-tions. ESCOM Science Publishers, Leiden Holland 1993.
(4) Ortiz, A. R.; Pisabarro, M. T.; Gago, F.; Wade, R. C. Prediction of drug binding affinities by comparative binding energy analysis. Journal of Medicinal Chemistry 1995, 38, 2681-2691.
(5) Perez, C.; Pastor, M.; Ortiz, A. R.; Gago, F. Comparative binding energy analysis of HIV-1 protease inhibitors: incorporation of solvent effects and validation as a powerful tool in receptor-based drug design. Journal of Medicinal Chemistry 1998, 41, 836-852. (6) Wanchana, S.; Yamashita, F.; Hashida, M. QSAR analysis of the inhibition of
recombi-nant CYP 3A4 activity by structurally diverse compounds using a genetic algorithm-combined partial least squares method. Pharmaceutical Research 2003, 20, 1401-1408. (7) Hasegawa, K.; Kimura, T.; Funatsu, K. GA Strategy for Variable Selection in QSAR
Studies: Enhancement of Comparative Molecular Binding Energy Analysis by GA-Based PLS Method. Quantitative Structure-Activity Relationships 1999, 18, 262-272.
(8) Holloway, B. A prior prediction of activity for HIV-1 protease inhibitors employing en-ergy minimization in the active site. Journal of Medicinal Chemistry 1995, 38, 305-317. (9) Yang, J.-M.; Chen, C.-C. GEMDOCK: a generic evolutionary method for molecular
docking. Proteins: Structure, Function, and Bioinformatics 2004, 55, 288-304.
(10) Yang, J. M.; Kao, C. Y. An evolutionary algorithm for the synthesis of multilayer coat-ings at oblique light incidence. IEEE/OSA Journal of Lightwave Technology 2001, 19, 559-570.
(11) Thompson, W. J.; Fitzgerald, P. M.; Holloway, M. K.; Emini, E. A.; Darke, P. L. et al. Synthesis and antiviral activity of a series of HIV-1 protease inhibitors with functionality tethered to the P1 or P1' phenyl substituents: X-ray crystal structure assisted design.
Journal of Medicinal Chemistry 1992, 35, 1685-1701.
(12) Wang, Y. X.; Freedberg, D. I.; Yamazaki, T.; Wingfield, P. T.; Stahl, S. J. et al. Solution NMR Evidence That the HIV-1 Protease Catalytic Aspartyl Groups Have Different Ionization States in the Complex Formed with the Asymmetric Drug KNI-272.
Biochemistry 1996, 35, 9945-9950.
(13) Lifson, S.; Hagler, A. T.; Dauber, P. Consistent Force Field Studies of Intermolecular Forces in Hydrogen Bonded Crystals I: Carboxylic Acids, Amides, and the C=O…H Hydrogen Bonds. Journal of the American Chemical Society 1979, 101, 5111-5120. (14) Dewar, M. J. S.; Zoebisch, E. G.; Healy, E. F.; Stewart, J. J. P. AM1: A New General
Purpose Quantum Mechanical Molecular Model. Journal of the American Chemical
(15) Besler, B. H.; Merz, K. M.; Kollman, P. A. Atomic Charges Derived from Semiempirical Methods. Journal of Computational Chemistry 1990, 11, 431-439.
(16) Baker, J. E. Reducing Bias and Inefficiency in the Selection Algorithm. The Second
International Conference on Genetic Algorithms and their Application 1987, 14-21.
Appendix:
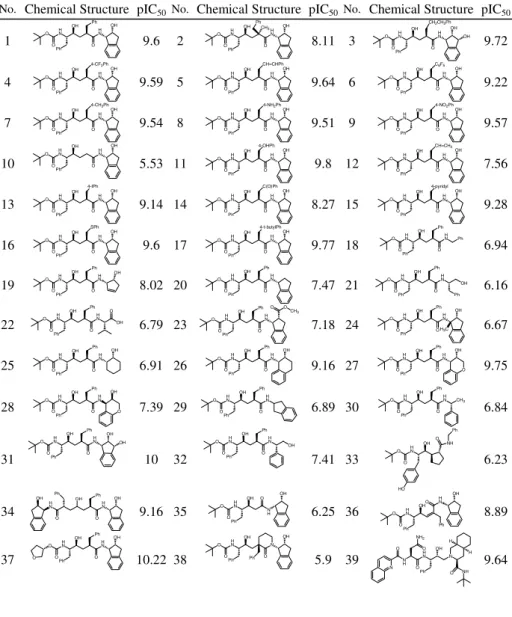
Table A. HIV-1 protease inhibitors used in training set (1-32) and test set (33-48), and their corresponding observed inhibitory activities (pIC50)
No. Chemical Structure pIC50 No. Chemical Structure pIC50No. Chemical Structure pIC50
1 9.6 2 8.11 3 9.72 4 9.59 5 9.64 6 9.22 7 9.54 8 9.51 9 9.57 10 5.53 11 9.8 12 7.56 13 9.14 14 8.27 15 9.28 16 9.6 17 9.77 18 6.94 19 8.02 20 7.47 21 6.16 22 6.79 23 7.18 24 6.67 25 6.91 26 9.16 27 9.75 28 7.39 29 6.89 30 6.84 31 10 32 7.41 33 6.23 34 9.16 35 6.25 36 8.89 37 10.22 38 5.9 39 N 9.64 H H N O Ph N NH2 O O N OH H H O NH O HN O Ph OH N O OH Ph O HN O Ph OH OH O HN Ph O HN O Ph OH O N H OH Ph H N O OH OH Ph H N O OH O HN O OH HO O NH Ph O HN O Ph OH Ph H N O OH O HN O Ph OH Ph H N O CH3 O HN O Ph OH Ph H N O O HN O Ph OH Ph H N O OH O O HN O Ph OH Ph H N O OH O O HN O Ph OH Ph H N O OH O HN O Ph OH Ph H N O OH H3C O HN O Ph OH Ph H N O O O CH3 O HN O Ph OH H N O OH O Ph O HN O Ph OH H N O OH Ph Ph O HN O Ph OH H N O Ph O HN O Ph OH H N O Ph Ph O HN O Ph OH H N O OH 4-t-butylPh O HN O Ph OH H N O OH SPh O HN O Ph OH H N O OH 4-pyridyl O HN O Ph OH H N O OH C(O)Ph O HN O Ph OH H N O OH CH=CH2 O HN O Ph OH H N O OH 4-OHPh O HN O Ph OH H N O OH O HN O Ph OH H N O OH 4-NO2Ph O HN O Ph OH H N O OH 4-NH2Ph O HN O Ph OH H N O OH 4-CH3Ph O HN O Ph OH H N O OH C6F5 O HN O Ph OH H N O OH CH=CHPh O HN O Ph OH H N O OH 4-CF3Ph O HN O Ph OH H N O OH OH CH2CH2Ph O HN O Ph OH H N O OH CH3 Ph O HN O Ph OH Ph H N O OH O O HN O Ph OH Ph H N O OH OH O HN O Ph OH Ph H N O OH O HN O Ph OH H N O OH Ph O HN O Ph OH H N O OH 4-IPh O HN O Ph OH Ph H N O OH
No. Chemical Structure pIC50 No. Chemical Structure pIC50No. Chemical Structure pIC50 40 8.27 41 10.27 42 7.28 43 5.17 44 5.52 45 8.12 46 6.64 47 5.33 48 5.86 O HN O Ph Ph N H O O OH OH O HN O Ph OH N Ph O O O HN O Ph H N OH Ph O NH OH N H H NH O OH Ph H N O OH H H N HN O O HN O Ph OH N H O H N O OH Ph N H H NH O N N H H N O Ph N O N OH H H O NH H H O N H H N O Ph N O N OH H H O NH H H O N H H NH O OH H H N HN O