國
立
交
通
大
學
電機與控制工程學系
博 士
論
文
複雜型複合式文件影像壓縮方法之研究
THE STUDY OF THE COMPRESSION ALGORITHMS FOR
COMPLEX COMPOUND DOCUMENT IMAGES
研 究 生:瞿忠正
指導教授:吳炳飛 教授
複雜型複合式文件影像壓縮方法之研究
THE STUDY OF THE COMPRESSION ALGORITHMS FOR
COMPLEX COMPOUND DOCUMENT IMAGES
研 究 生:瞿忠正 Student:Chung-Cheng Chiu
指導教授:吳炳飛 Advisor:Bing-Fei Wu
國 立 交 通 大 學
電 機 與 控 制 工 程 學 系
博 士 論 文
A DissertationSubmitted to Department of Electrical and Control Engineering College of Electrical Engineering and Computer Science
National Chiao Tung University In partial Fulfillment of the Requirements
for the Degree of Doctor of Philosophy
in
Electrical and Control Engineering
December 2004
Hsinchu, Taiwan, Republic of China
複雜型複合式文件影像壓縮方法之研究
學生:瞿忠正 指導教授:吳炳飛 教授
國立交通大學 電機與控制工程學系 博士班
摘 要
由於複合式文件影像中包含許多文字資訊,當文件影像以傳統壓縮方法壓縮時, 文字資訊會產生大量的失真,文字和一些屬於高頻的資訊會變的模糊。所以,傳統壓 縮方法並不適合拿來直接對複合式文件影像作壓縮處理,同時,壓縮後文件影像中的 文字,也無法容易的被電腦辨識或被我們閱讀。因為文件中文字資訊的重要性,所以 文件影像的文字切割技術已經發展了十多年,但是針對複合式文件影像的研究,仍是 一個新鮮的研究課題。目前已有許多學者針對複合式文件影像研究文字切割的方法, 但是這些方法依然不能適用於目前報章雜誌上圖文交疊、背景變化多端的複雜型複合 式文件影像。像這類複雜型複合式文件影像的文字切割技術,可以說是文件影像處理 的一大挑戰。如果可以從不同複雜程度的影像中,將文字切割出來,那就可以適用於 所有的文件影像處理。本篇論文研究目標就是發展出一種可以解決複雜型複合式文件 影像的文字切割方法,使文件影像壓縮可以達到更高的壓縮倍數與視覺品質。 本篇論文提出三個文字切割的方法,這三個方法所處理的複合式文件影像難度依 章節順序增高。本文中提出的切割方法應用於文件影像壓縮,可以明顯的看出壓縮倍數與視覺品質優於 JPEG 或 DjVu,而且在本文第三個切割方法(MLSM)中,提出新的
區域性區塊特徵分離與拼圖式全圖整合的方法,在解決複雜型複合式文件影像的文字
切割問題時,即使在同一張完整的文件影像中,包含各種不同程度的複雜狀況,也可
以順利的將不同顏色、不同複雜背景與不同交疊程度的文字切割出來,提高各種複雜
THE STUDY OF THE COMPRESSION ALGORITHMS
FOR COMPLEX COMPOUND DOCUMENT IMAGES
Student:Chung-Cheng Chiu Advisor:Prof. Bing-Fei Wu
Department of Electrical and Control Engineering
National Chiao Tung University
ABSTRACT
Traditional image compression methods are not suitable for compound document
images because such images include much text. These image data are high-frequency
components, many of which are lost in compression. Text and the high-frequency
components thus become blurred. Then, the text cannot be recognized easily by the human
eye or a computer. The text contains most information, separating the text from a
compound document image is one of the most significant areas of research into document
images. Document image segmentation, which separates the text from the monochromatic
background, has been studied for over ten years. Segmenting compound document images
is still an open research field. Many techniques have been developed to segment document
images. However, they are insufficient when the background includes sharply varying
contours or overlaps with text. Finding a text segmentation method of complex compound
documents remains a great challenge and the research field is still young. This dissertation
presents three segmentation algorithms for compressing image documents, with a high
proposed algorithms greatly outperform the famous image compression methods, JPEG and
DjVu, and enable the effective extraction of the text from a complex background, achieving
ACKNOWLEDGEMENTS
第一次見到恩師 吳炳飛教授,就深深被教授的獨特氣質與淵博的學養所吸引,當下 就決定進到 CSSP 實驗室展開人生一段非常重要的學術研究訓練。這一段學習的過程當 然是多采多姿,研究的工作雖然辛苦,但是絕不會累!因為一路上有教授幫忙排除萬難; 研究的路途雖然遙遠,但是決不孤獨!因為一路上有許多實驗室的夥伴陪伴。 能順利完成博士學位,需要感謝的人很多,首先要感謝的就是恩師 吳炳飛教授與師 母,感謝教授為我開啟一扇智慧之門,讓我未來可以走的更遠更平順;感謝師母的協助,讓 教授能有更多的時間來指導我們。感謝強哥與旭哥在我研究的過程一路陪伴,真懷念我們一 起在 CSSP 實驗室並肩熬夜打拼的日子;尤其要感謝陳彥霖學弟,他從碩士班開始就跟著我 做研究,並直攻到博士班,一路陪伴我完成博士學業;感謝實驗室所有學弟、妹們,與各位 合作研究的經驗,是我這一生重要的回憶。 感謝口試委員 宋開泰教授、張志永教授、賈叢林教授、陸儀斌教授與蘇崇彥教授, 給予我在研究上許多寶貴的意見。 更要感謝我的父親 瞿梓庭先生與母親 羅金妹女士,從小就給我一個模範的榜樣, 感謝父親嚴厲的身教與言教,讓我能掌握人生的方向,謝謝您們! 最後要感謝的是我的妻子 李明珍小姐,由於研究工作的繁重,這段時間感謝妳的陪 伴與支持,兩個頑皮小子旭民與瑞宏也照顧的很出色,讓我無後顧之憂的將研究工作圓 滿完成,謹將此成果與妳分享。 忠正 於國立交通大學電機與控制工程學系 CSSP 實驗室 2004/12/14CONTENTS
ABSTRACT (Chinese) ……….……….………. ii ABSTRACT (English) ………..…. iv ACKNOWLEDGEMENTS ……….……….………. vi CONTENTS ……….……….………. vii LIST OF TABLES ……….……….………. ix LIST OF FIGURES ……….……….………. x 1. INTRODUCTION ……….………..………..……. 1 1.1 Motivation……….……….. 11.2 Organization of the dissertation……….. 2
2. THE FUZZY-BASED TEXT SEGMENTATION METHOD ...………..………….. 7
2.1 Introduction ……… 8
2.2 The characteristics of coefficients in wavelet transform………. 9
2.3 Fuzzy picture-text segmentation algorithm………..……... 12
2.4 Color document images compression method………. 27
2.5 Experimental results……… 31
2.6 Concluding remarks……… 32
3. THE COMPRESSION ALGORITHMS FOR COMPOUND DOCUMENT IMAGES WITH LARGE TEXT/BACKGROUND OVERLAP……….…. 35
3.2 Text segmentation algorithm………...… 38
3.3 Document image compression algorithm……… 48
3.4 Experimental results……….………... 53
3.5 Concluding remarks……… 55
4. THE MULTI-LAYER SEGMENTATION METHOD FOR COMPLEX DOCUMENT IMAGES………... 68
4.1 Introduction………. 69
4.2 Multi-layer segmentation method………..……. 73
4.2.1 Block-based clustering algorithm………. 77
4.2.2 Jigsaw-puzzle layer construction algorithm………... 81
4.3 Text extraction algorithm……….. 97
4.4 Experimental results and discussions……… 104
4.5 Concluding remarks………... 108
5. CONCLUSIONS AND PERSPECTIVE……….. 116
REFERENCE……….. 120
VITA………. 125
PUBLICATION LIST………. 127
LIST OF TABLES
Table 1 The dynamic range of UV-plane coefficient……… 20
Table 2 The fractal dimension influenced by the resolution of images……… 23
Table 3 Comparison the compression ratio and PSNR for the proposed methods to JPEG & DjVu...
LIST OF FIGURES
Fig.1 Image after 2-level discrete wavelet transformation.……….... 10
Fig.2 The flowchart of Fuzzy picture-text Segmentation algorithm………….. 13
Fig.3 The influence of threshold………... 14
Fig.4 Example of CRLA and region growing……… 17
Fig.5 The edge projection of text components in high frequency band………. 18
Fig.6 Two kinds of projection histogram………... 19
Fig.7 Images with text/picture component………. 23
Fig.8 The characteristics of three parameters……… 25
Fig.9 The membership functions of three parameters……… 25
Fig.10 Fuzzy Rule Table……… 26
Fig.11 Possible fuzzy quantization by triangle-sharp fuzzy number…………. 27
Fig.12 The flowchart of proposed compression algorithm……… 28
Fig.13(a) The original image(512×1024, scanned by ScanMaker V600 at 200dpi)………... 33
Fig.13(b) JPEG image(CR=104.1)……… 33
Fig.14(a) The original image(1024×512, scanned at 200dpi)……… 34
Fig.14(b) JPEG image(CR=83.1)………... 34
Fig.14(c) Proposed method(CR=84.31)………. 34
Fig.15 The original full image (200 dpi)……… 39
Fig.16 The planes after clustering algorithm………….……… 40
Fig.17 An example of text extraction algorithm (size=256×128)……….. 46
Fig.18 Document image compression format……… 50
Fig.19 Segmentation images of proposed algorithm CSSP-I……… 59
Fig.20 Compared with proposed algorithm CSSP-I & JPEG……… 61
Fig.21 Processed images of the DjVu……… 64
Fig.22 Processed images of the CSSP-II………... 66
Fig.23 An example of the results after the block-based clustering algorithm... 75
Fig.24 Flowchart of the decision procedure to construct or extend an object layer……… 89
Fig.25 An example of the MLSM (image size=1361x1333)………. 96
Fig.26 The example of the text extraction algorithm of the Fig.25(d)……….. 101
Fig.28 Test image 2 (image size=1829x2330)………... 111
Fig.29 Test image 3 (image size=2462x3250)………... 112
Fig.30 Test image 4 (image size=2333x3153)………... 113
Fig.31 Test image 5 (image size=2469x3535)………... 114
CHAPTER 1
INTRODUCTION
1.1 Motivation
As the electronic storage, retrieval and transmission of documents become faster
and cheaper, documents are becoming increasingly digitized. The image size of a
magazine page at 300 dpi is 3300 pixels high and 2500 pixels wide, it occupies about
25 Mbytes of memory in uncompressed form. The volume of data greatly prolongs
the transmission time and makes the storage cost high. Therefore, the document
images should be compressed before transmission or storage.
A typical digital image encoder initially converts the input image data into
coefficients by means of one of the transform procedures, such as DCT and FFT. The
obtained coefficients are then encoded using scalar or vector quantization followed by
one of entropy-based coders which is a Huffman coder in a majority of cases. The
combination of discrete wavelet transform [1],[2] and zerotree coding [3],[4] was
proposed to compress a nature image.
However, using those methods on color document images as advertisements
characteristics of text and pictures are different, it is not suitable to compress them by
the same method like JPEG [5] or discrete wavelet transform. Digitized images of
printed documents typically consist of a mixture of texts, pictures, and graphics
elements, which have to be separated for further processing and efficient
representation. Because text captures the most information, how to segment the text
from printed document images becomes an important step in document analysis.
So far, there are more and more documents printed with gorgeous styles such as
various color texts and background objects. They must be segmented from an image
to facilitate further processing. Therefore, many researchers have developed valuable
segmentation techniques for applications that include document analysis, image
segmentation, image compression, and pattern recognition.
1.2 Organization of the dissertation
In this dissertation, three segmentation methods for document images proposed
to extract texts from compound document images.
In the Chapter 2, a compression method for color document images based on the
wavelet transform and fuzzy picture-text segmentation is presented. This approach
addresses a fuzzy picture-text segmentation method, which separates pictures and
texts by using wavelet coefficients from color document images. Two components,
algorithms.
The fuzzy picture-text segmentation method separates the text and picture from
the monochromatic background. However, the rapid development of multimedia
technology has led to increasing numbers of real-life documents, including stylistic
text strings with decorated objects and colorful, slowly or highly varying background
components. These documents overlap the text strings with the background images.
Therefore, the fuzzy picture-text segmentation method cannot effectively segment all
important objects. It is insufficient when the background includes sharply varying
contours or overlaps with text.
Therefore, Chapter 3 proposes a new segmentation algorithm for separating text
from a document image with a complex background. However, the image of text
cannot easily be directly separated from the background image because the difference
between the gray values is too small. Therefore, two phases are used to accomplish
the desired purpose. In the first phase, which involves color transformation and
clustering analysis, the monochromatic document image is partitioned into three
planes, the dark plane, the medium plane, and the bright plane. The color of the text is
almost all the same, so the variance of the text’s grayscale is small. Therefore, all the
text can be grouped in the same plane. When the text is black, the text and some of the
background with a gray value close to that of the text is put in the dark plane. In
noise are coarsely separated from the background. In the second phase, an adaptive
threshold is determined to refine the text by adaptive binarization and block extraction.
Then, two compression algorithms that yield a high compression ratio are also
proposed.
The segmentation algorithm focuses on processing the images whose texts are
overlap to the complex background. The study is powerful in extracting texts from
complex backgrounds. However, we can find many advertisements or magazines
whose background images contain many different cases including 1) monochromatic
background with/without texts, 2) slowly varying background with/without texts, 3)
highly varying background with/without texts and 4) complex varying background
with/without different color texts. It is hard to extract the texts when all of the cases
spread in a compound document image, especially. Furthermore, the color of texts
may be more than three. Therefore, the segmentation algorithm in the Chapter 3 may
be insufficient to extract the text from document images in all cases. The text
segmentation method of those complex images becomes a great challenge and still a
novel research field.
To conquer this challenge, we present a text segmentation algorithm for various
document images in Chapter 4. The proposed segmentation algorithm incorporating
with a new multi-layer segmentation method (MLSM) can separate the text from
overlap. This method solves various problems associated with the complexity of
background images.
The MLSM provides an effective method to extract objects from different
complex images. The complex image includes many different objects such as
difference color texts, figures, scenes and complex backgrounds. Those objects could
be overlapped or non-overlapped by each others. Because those objects have
different features, the image can be partitioned into many object-layers by means of
the features of objects embedded in it. Then the block-based clustering algorithm can
be performed on those layered image sub-blocks and cluster them to form several
object layers. Consequently, different text, non-text objects and background
components are segmented into separate object layers. The proposed method can
separate or objects from 8-bit grayscale or 24-bit true-color images, no matter the
objects overlap a simple, slowly or highly varying background. The block-based
clustering algorithm decomposes the sub-block image into different layered
sub-block images, LSBs, in the order of darkest to lightest corresponding to the
original sub-block image. In the jigsaw-puzzle layer construction algorithm, some
statistical and spatial features of adjacent LSBs are introduced to assemble all LSBs
of the same text paragraph or object.
segmented into several independent object layers for further extraction process. When
applied to real-life, complex document images, the proposed method can successfully
extract text strings with various colors and illuminations from overlaying non-text
objects or complex backgrounds, as determined experimentally. Experimental results
obtained using different document images scanned from book covers, advertisements,
brochures, and magazines reveal that the proposed algorithm can successfully
segment Chinese and English text strings from various backgrounds, regardless of
whether the texts are over a simple, slowly varying or rapidly varying background
CHAPTER 2
THE FUZZY-BASED TEXT SEGMENTATION
METHOD
This chapter presents a compression method for color document images based on
the wavelet transform and fuzzy picture-text segmentation. This approach addresses a
fuzzy picture-text segmentation method, which separates pictures and texts by using
wavelet coefficients from color document images. The number of colors, the ratio of
projection variance, and the fractal dimension are utilized to segment the pictures and
texts. By using the fuzzy characteristics of these parameters, a fuzzy rule is proposed
to achieve the purpose of picture-text image segmentation. Two components, text
strings and pictures, are generated and processed by different compression algorithms.
The picture components and the text components are encoded by zerotree wavelet
coding and by the modified run-length Huffman coding, respectively. Experimental
results have shown that the work has achieved promising performance on high
2.1 Introduction
Digitized images of printed documents typically consist of a mixture of texts,
pictures, and graphics elements, which have to be separated for further processing and
efficient representation. Because text captures the most information, how to segment
the text from printed document images becomes an important step in document
analysis. Accordingly, various techniques have been developed to segment document
images. Many approaches devoted to process monochrome document have been
proposed in the past years. Wahl et al. [6] designed a prototype system for document
analysis and a constrained run length algorithm (CRLA) for block segmentation.
Nagy et al. [7] presented an expert system with two tools: the X-Y tree and formal
block-labeling schema, to accomplish document analysis. Fletcher and Kasturi [8]
proposed a robust algorithm, which uses the Hough transform to group connected
components into local character strings, to separate text from mixed text/graphics
document images. Kamel and Zhao [9] presented two new extraction techniques: a
logical level technique and a mask-based subtraction technique. Tsai [10] proposed an
approach to automatic threshold selection using the moment-preserving principle.
Some other systems based on the prior knowledge of some statistical properties of
various blocks [11]-[15], or texture analyses [16],[17] have also been successively
developed. Those systems all focus on processing monochrome document. In contrast,
[19] presented a text string extraction algorithm, which uses the edge-detection
technique and text block identification to extract the text string. Haffner et al. [20]
proposed an image compression technique called “DjVu” that is specially geared
toward the compression of document image in color.
In this chapter, we present a compression method for color document images by
using a new fuzzy picture-text segmentation algorithm. This proposed segmentation
algorithm separates the text from color document images in frequency domain by
using the coefficients derived from the discrete wavelet transform. The coefficients
are used to separate the text/picture components by using the fuzzy classification
method. Then, the coefficients of picture components are encoded by the coding
method of zerotree, and Modified Run-Length Huffman Code (MRLHC) encodes the
coefficients of text components.
2.2 The characteristics of coefficients in wavelet transform
The basic theory of the wavelet transform is to represent any arbitrary function f
as a superposition of wavelets. After the first level of two-dimensional discrete
wavelet transform, the image was arranged placing the lowest-frequency band in the
left upper corner, the highest-frequency band in the right down corner, and the
middle-frequency band in the right upper corner and left down corner. The
bands, therefore, making the image decomposed into the second level of wavelet
transform, and then seven frequency bands as Fig.1 are obtained. The coefficients of
seven bands obtained from the original image by wavelet transform are treated as the
textures of different frequency.
Fig.1 Image after 2-level discrete wavelet transformation.
In Fig.1, the LL2 band has the coefficients of the lowest-frequency. LHi, HLi
and HHi (i=1, 2) bands indicate the edge information in the original images. The LL2
band is very similar to the original image but with only the size of 1/16. The cost of
calculation can be reduced by using the LL2 band for picture-text segmentation. For
picture components, the signals in LH1, HL1 and HH1 bands are not sensitive to
human eyes, and they could be directly discarded. However, for text components,
those frequency bands include prominent edge information which should be coded to
preserve the text information.
After the wavelet transform, the coefficients extracted from text components LL2 LH2
HL1 HL2 HH2
LH1
appear more edge information than the coefficients from picture components. That is,
the coefficients of text components show higher frequency characteristics than the
coefficients of picture components. As such, the characteristics of wavelet transform
coefficients are different between text components and picture components. Therefore,
the edge feature is a good parameter for segmenting picture-text components.
The number of colors, also a useful feature, can be used for color-document
image segmentation. Because the coefficients of LL2 band are very similar to the
original image after wavelet transform, the color number can be obtained by counting
the color number of UV-plane from the coefficients of LL2 band. However, it is
difficult to obtain the number of color from the color document images directly. In
this chapter, a new algorithm is proposed to extract the number of colors from the
coefficients of LL2 band.
The fractal dimension indicates the complexity of images. In addition, it is found that the fractal dimension [22] between text components and picture components is quit different. Because the picture components are more complicated than the text components, the picture components have higher fractal dimension than the text components. The fractal dimension in original image and in low-resolution image is similar. Therefore, the coefficients of LL2 band are applied only to obtain the fractal dimension from text components and picture components. In this way, the processing time to compute fractal dimension can be reduced.
2.3 Fuzzy picture-text segmentation algorithm
As mentioned in previous section, the new document image segmentation utilizes
the coefficients from wavelet transform to extract the features of picture components
and text components which can be further separated by extracted features using a
fuzzy algorithm. We use the technique of spreading and region growing to mark all
the foreground blocks including picture-images, text-images and other kinds of
images on LL2 band, and these blocks are then segmented to text components or
picture components (non-text components).
The segmentation method uses color number, the energy of edge projection, and
fractal dimension to segment foreground blocks. The reasons why we use those three
parameters to perform segmentation are listed as fellows:
(1)Color number: Since picture components are more colorful than text components,
color number can distinguish them.
(2)The energy of edge projection: It shows the distribution of edge projection in a
block. In general, the variation of edge projection is regular in text components, and
irregular in picture components.
(3)Fractal dimension (FD): It shows the complexity of images. In most cases, the
pixels in text components distribute more uniformly and the fractal dimension is
The three parameters, color number, the energy of edge projection and fractal
dimension, are used in the same time to reduce misjudgment. For example, if the
reliability of the three parameters are 9/10, 19/20 and 4/5, the decision error of
picture-text segmentation would diminish to 1/1000 (1/10×1/20×1/5) when we consider the three parameters in the same time appropriately. The Fuzzy Rule
calculation [23] is very suitable to analyze this kind of variables. Therefore, we
propose a fuzzy picture-text segmentation algorithm to separate text components and
picture components from color document images.
Fig.2 The flowchart of fuzzy picture-text segmentation algorithm. W avelet coefficient of layer 2 Sub-band of LL2 Sub-band of LH2, HL2,HH2 Spreading Region growing The position of foreground Fractal Dimension Calculation Color Number Calculation LEPVR Calculation Fuzzifiier Inference Engine Defuzzifier Fuzzy Rule Table The position of picture and text
The flowchart of the algorithm is shown in Fig.2. Details of the algorithm are
explained in the following subsections.
A. Spreading and region growing for blocks extraction
The coefficients of LL2 band are used to perform block extraction. The
proposed block extraction method is to divide the foreground of document images
into text components and picture components. Before the process, we need to convert
the coefficients of LL2 band into bi-level data, and use the thresholding method to
decide the location of foreground and background. However, the pixel numbers of
background are more than foreground's. In order to make the boundary of foreground
more obvious, the algorithm uses a threshold value from the mean value. The
threshold value is (Mean-Variance). We can realize the influence of bias in Fig.3.
Fig.3 The influence of threshold.
Original Gray-Scale Image
Seperate Foreground and Background by Mean
Seperate Foreground and Background by
The pixels of foreground and noise will be all extracted by a thresholding
method in the same time. Therefore, we use the Constrained Run Length Algorithm
(CRLA) to remove noise pixels. The algorithm was proposed by Wahl et al. [6] to
preserve the pixel when it comes from the valid continuous pixels. For example, there
is a binary string, 11001000001000011, with a constraint C=4 to the run length of 0s,
if the number of consecutive 0s is less than or equal to C, these 0s must be replaced
with 1s; otherwise, they are reserved. As a result, the above binary string is converted
into the sequence, 11111000001111111. Some noises are eliminated by the method.
The CRLA is performed in horizontal and vertical directions, and the bi-level
images, "Mv" and "Mh", are obtained, respectively. Then, we apply the "OR" operator
on Mv and Mh pixel by pixel, and get a bi-level spreading image, Mhv, which merges
the neighboring pixels in both direction.
Therefore, the methods of thresholding, CRLA and logic operation are called
the spreading process. After the spreading process, the bi-level spreading image Mhv
is processed by the region growing method to gather the foreground pixels into
rectangle blocks. The steps of region growing method are described below:
Step 1. Collect the foreground pixels of image Mhv row by row.
Step 2. Compare the foreground pixels collected from Step 1 with the current
blocks, the foreground pixels and blocks are merged into the same block.
If there is no overlap, make a new block for the foreground pixels.
Step 3. After region growing, every block will be checked. If the block is
neither growing bigger nor being a new one, stop the block's growing
and regard it as an isolated block.
Step 4. Check if there is any overlap between blocks or not. Merging the
overlapping blocks into the same block.
Step 5. If Mhv comes to the last row, then go to Step 6; if not, return to Step 1.
Step 6. Change all existing blocks into isolated blocks. If there is any overlap
between blocks, merge the overlapping blocks into the same block.
Step 7. Delete those smaller noise blocks.
Step 8. The end.
After the processes of spreading and region growing, we got all foreground
blocks of the image Mhv. An example is shown in Fig.4.
We can calculate the local edge projection variance ratio, the color number, and
(a) Original document image.(200 dpi, image size=768×256)
(b) The binary image of sub-band LL2.(image size=384×128)
(c) The binary image of sub-band LL2 after CRLA and region growing. (image size=384×128)
Fig.4 Example of CRLA and region growing.
Those calculating methods are described as follows.
B. The calculation of local edge projection variance ratio
It is assumed that texts are written in horizontal or vertical direction. When the
edge information is projected toward the vertical direction of text strings, the
projection histogram would variation regularly. In addition, the projection magnitudes
information is not projected on the vertical direction of text strings, the variation of
the projection histogram will be irregularly. This property can be used to decide the
direction of text strings. The horizontal or vertical edge projection is used to decide
the direction of text strings.
Furthermore, since the variation of edge projection is different between text
components and picture components, it can be applied to distinguish text components
or picture components from foreground blocks. After discrete wavelet transform, the
edge projection in high frequency bands (LH, HL, and HH) is more obvious than the
one in low frequency band (LL). Therefore, the edge projection is calculated from the
binary image which combines the binary images of high frequency bands (LH, HL,
and HH) using logical OR operator. Fig.5 shows the vertical and horizontal edge
projection of text-image in high frequency band.
Fig.5 The edge projections of text components in high frequency band. H orizontal P ro jection histogram V ertical P rojection histo gram
The variation of edge projection is regular in text components, and irregular in
picture components. The edge projection variance ratio is defined by
Edge projection variance ration (EPVR)= ×
∑
−i 2 ) ) i ( ( 1 Mean P Mean (1-1)
in which P(i) is the magnitude of ith projection and Mean is the average of the projection histogram.
The edge projection variance ratio shows the variation in projection histogram.
By considering those two histograms shown in Fig.6, the left one is the projection
histogram of text component and the right one is the projection histogram of picture
component. We find these two projection histograms share the same EPVR. However,
only the left diagram reveals the property of text.
(a)The projection of text component (b)The projection of picture component
Fig.6 Two kinds of projection histogram.
So we modify the equation (1-1) below:
Local edge projection variance ratio (LEPVR)= ×
∑
−i 2 ) (i) ) i ( ( 1 LMean P Mean (1-2) mean Projection histogram mean Projection histogram
, where P(i) is the magnitude of ith projection, Mean is the average of projection, and , (k) 1 = (i) 1 -/2 + i /2 -i
∑
× N N P NLMean N is the width of the sliding window.
LEPVR uses the local mean to compute the local standard deviation used to
substitute the global one. Therefore, the LEPVR of text components is larger than that
of picture components.
C. The calculation of color number
In general, the RGB-plane of a color document image is transformed to the
YUV-plane before further processing. Because all color information can be collected
in the UV-plane, the color number will be calculated in the UV-plane of LL2 band.
Because the wavelet transform 9/7 filter is adopted in this work, the dynamic range of
UV-coefficients, shown in Table 1, would be amplified 4 times after the wavelet
transform.
Table 1. The dynamic range of UV-plane coefficient
Original dynamic
range
First level Second level
U -plane ±112 ±448 ±1792
V-plane ±158 ±632 ±2528
In Table 1, the coefficients in second-level wavelet transform could be enlarged
to 16 times at maximum, but it would not achieve the maximum value in most cases.
Therefore, minimizing 8 times is more reasonable in current situation.
The extraction of color number from foreground blocks is performed as
follows:
Step 1. Calculating the histogram of UV-plane.
Step 2. Set LB as the threshold value, calculate the effective color range
(ColorRange) whose pixel number is larger than LB.
, , , 3 100 10 ⎪ ⎩ ⎪ ⎨ ⎧ = TotalPixel LB Otherwise TotalPixel If TotalPixel If 1000 400 1000 < ≤ ≤ (1-3)
Step 3. Define the effective mean value (MeanPixel) of pixels as:
ColorRange TotalPixel MeanPixel=
(1-4) Step 4. Set 2 MeanPixel
as the threshold value. Calculate the number of colors
whose peak values of histogram are larger than the threshold value.
This number of colors is called color number in UV-plane.
We can calculate the color numbers of A and B in UV-plane. We define the value
of A×B to be the color number of the foreground block.
D. The calculation of fractal dimension
The fractal dimension indicates the complexity of images. The more complex
image is, the larger the fractal dimensions. However, images are two-dimensional, so
There are many ways to calculate the fractal dimension (FD). Here, we use the
Two Dimension Box Counting Method [25] which is easier and faster to calculate
compared to others. The steps of Two Dimension Box Counting Method are listed
below:
Step 1. Assume all boxes are square. Set the minimum value (Boxmin) and the maximum value (Boxmax) of box, and let Len equal to the width of
Boxmin. To partition the image into blocks, the width of block is the value of Len.
Step 2. From the upper left side of image, search whether there exists any foreground pixel in the box whose width is the value of Len. If yes, plus 1 to the counter (Count(Len)). Apply this method to the whole image from left to right and up to down. After the process, the number of boxes contained the foreground pixel is obtained.
Step 3. If Len ≦ Boxmax, Len is increased by 1, and go to Step 2, else go to Step 4.
Step 4. Draw the logarithm figure of
Len
1
and Count(Len).
Step 5. Use the Least Square Error Method to get the line which is the nearest to the curve of the logarithm figure in step 4. Then define the slope of the curve as the fractal dimension of the image.
Theoretically, fractal dimension would not change in any scale, meaning that
the characteristics of fractal dimension will be the same when enlarge or reduce the
size of image. However, the property will be slightly changed because of the limited
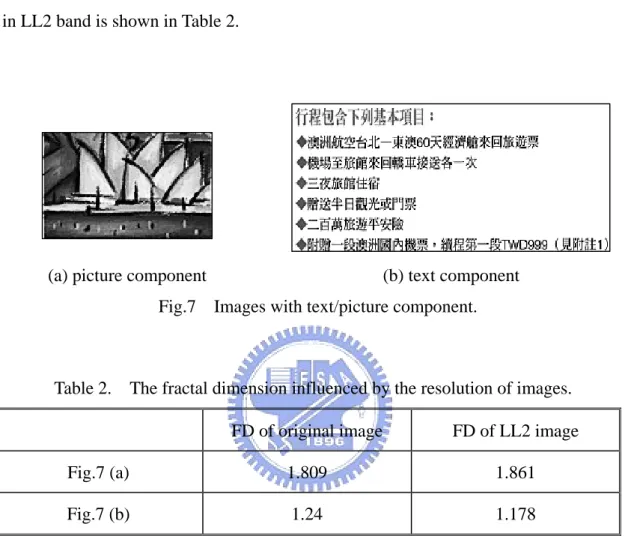
lower down the resolution of image. Fig.7 illustrates the images with text component
and picture component. The FD difference between the original image and the image
in LL2 band is shown in Table 2.
(a) picture component (b) text component
Fig.7 Images with text/picture component.
Table 2. The fractal dimension influenced by the resolution of images. FD of original image FD of LL2 image
Fig.7 (a) 1.809 1.861
Fig.7 (b) 1.24 1.178
There are two information concluded from Table 2.
(1) The FD in original image is very close to the FD in the low-resolution image. The variation range is between ±0.1.
(2) FD in text components is smaller than in picture components.
The information (1) confirms that we can calculate FD in LL2 band to replace FD
in original image. The information (2) shows the difference of FD in picture and text
E. Fuzzy logic decision system
We can use the local edge projection variance ratio, color number, and fractal
dimension to segment the foreground blocks to picture components or text
components. In some cases, the local edge projection variance ratio, color number,
and fractal dimension of text components would show the same characteristics as
those of picture components do. In other words, those parameters have the fuzzy
characteristic. Therefore, we can use the fuzzy theorem to classify the foreground
blocks.
In general, picture components and text components have three characteristics:
(1) If the local-edge projection variance ratio (LEPVR) is large, it is likely to be text
components.
(2) If the color number is large, it is likely to be picture components.
(3) If the FD is large, it is likely to be picture components.
The three characteristics are showed in Fig.8. The fuzzy membership functions
shown in Fig.9 are used for the testing of many images and the recognition of human
Fig.8 The characteristics of three parameters.
Fig.9 The membership functions of three parameters.
(S:small; CS:close to small; CL:close to large; L:large)
By using Hamming distance, and the number of reliability of three parameters,
we set a Fuzzy Rule Table (4×4×4 cubic) as shown in Fig.10. First, filling into 0 (the
most likely be picture components) in one edge of this cubic block, then fill into 18
(the most likely be text components) in the opposite position of 0. From 0 to 18, no
matter which the route is, the Hamming distance is equal to 9. Then, filling number
based on equal Hamming distance, we got an initial fuzzy rule table where the three
parameters maintain the same degree of importance.
S CS CL L 3 5 7 9 LEPVR S CS CL L 1.3 1.5 1.7 1.9 FD S CS CL L 40 70 100 130 Color number LEPVR large small picture text
Color number small large
picture text
FD small
large
(a) (b)
(c) (d) Fig.10 The fuzzy rule table.
In the fuzzy rule table, the large number is more likely to be the text components.
On the contrary, the small number is more likely to be the picture components. Even
though the text components, which contain only a color in the same text component, it
would not include more color number than picture components do. Therefore, we can
emphasize the weighting of “color number is large” for picture components. However,
for gray or single color images, since there is only one color, this information (color
number) is not reliable for text components and picture components. Under this
circumstance, it is needed to rely on LEPVR and FD, so we need to put more
emphasis on the weighting of these two parameters for gray or single color images.
Color Numbers Color Numbers
LEPVR small large small 6 10 16 18 4 8 14 16 4 6 8 10 large 2 3 5 7 FD is small LEPVR small large small 5 10 14 16 3 7 12 14 3 5 7 9 large 1 3 4 6 FD is close to small
Color Numbers Color Numbers
LEPVR small large small 4 8 12 14 2 6 10 12 2 4 6 8 large 0 2 2 4 FD is close to large LEPVR small large small 3 6 10 12 2 5 8 10 1 4 6 8 larg 多 0 1 1 1 FD is large
Through these methods discussed above, we design the fuzzy rule table in Fig.10. The
corresponding function in every rule is shown in Fig.11.
Fig.11 Possible fuzzy quantization by triangular-shaped fuzzy numbers
A number of defuzzification methods leading to distinct results were proposed in
many literatures. Each method is based on some rationale. In this method, the center
of area method [23] is selected to define the defuzzified value. The defuzzified value
is set 100: if the defuzzified value of foreground blocks is smaller than 100, it
belongs to picture components; and if the defuzzified value of foreground blocks is
larger or equal to 100, then it belongs to text components.
2.4 Color document images compression method
After fuzzy picture-text segmentation algorithm is applied, the document images
are classified into text components and picture components. In this section, zerotree C1 1 C0 C2 C17 C18 10 20 C5 60 190 180 Possibilit y 30
coding method is used to compress the coefficients of wavelet transform for picture
components, but the coefficients of text components need to be removed. For
text-components, we have to extract the colors of text from the original document
image. Each color of text components will form a single color plane. The color plane
is compressed by the Modified Huffman code.
However, the run-length of blank pixels between text-lines can be very long, and
may reduce the coding efficiency of Huffman code. To solve this problem, we use
Modified Run-length code to deal with the long run-length, and Modified Huffman
code codes the short run-length. The flowchart of proposed compression algorithm is
shown in Fig.12.
Fig.12 The flowchart of proposed compression algorithm.
The coefficients after wavelet transform of layer 2
Picture and Text Segmentation
Text components
Picture components
separate foreground and background
extract the color of background
quantize the color in
Text-plane
coding each single-color plane by MRHC clear text's coefficients in picture components continue wavelet transform of layer 3,4... coding the coefficients by zerotree
A. Color quantization in text components
For the text components, they are separated into several single-color planes.
Therefore, we have to decide the number of colors in the text components by
calculating the foreground histogram (His[i]) from the UV-plane. The steps are listed
as follow:
Step 1. Let His[i] pass the low-pass filter, and set the result as Fhis[i].
Step 2. Find the maximum values of Fhis[i].
Step 3. Get rid of the maximum value of Fhis[i] which is smaller than
TH_LowBound.
Step 4. Set a threshold of duration (TH_UV), and calculate the local-maximum
between ±TH_UV.
In Step 1, the purpose of low-pass filter is to eliminate high frequency noise. In
Step 2, all the peak values in FHis[i] can be found, and the smaller peaks in Step 3 are
deleted. In Step 4, we can obtain the major colors of text components and use the
color information to segment the text component into many single-color planes by
difference colors. The meaning of TH_UV is the minimum difference of colors that
human eyes are able to discern. Here the value of TH_UV is set to 15 and
B. Using Modified Run-Length Huffman Code (MRLHC) to encode text
The text components are segmented into several single-color planes. Those
planes are compressed by Modified Run-Length Huffman Code.
Modified Run-Length Huffman Code is especially designed to code the long
run, so it is expected that the code has the ability to handle extreme long runs. The
algorithm is designed as follows:
Run-Length=1728×Multi-code + 64×Makeup code + Terminate code
'27' 26' ~ '1 only 1728) (2 ~ 1728 1727 ~ 64 63 ~ 0 length -Run 16 code Length Run Modified code Makeup code Terminate code Makeup code Terminate + + ⎪ ⎩ ⎪ ⎨ ⎧ × =
Modified Run Length code = Continue-code + Multi-code + Makeup code +
Terminate code.
The first four bits are Continue-code which indicates the number of bits can be
read in Multi-code. By using this approach, the maximum Run-Length is represented
as long as 1728×216=27×222
. The maximum Run-Length in A3-size paper scanned in
300dpi is approximate by 8×222. Therefore, Using Modified Run Length Code can
represent an A4-size paper just in one code.
C. Compression method of picture components
When the blocks of texts are extracted from the color document image, many gaps are located at the color document image. The boundary of those gaps produces many high-frequency coefficients after wavelet transform. The zerotree coding
algorithm will waste bits to encode those high-frequency coefficients. In order to improve the efficiency of compression, those gaps must be compensated with appropriate coefficients. Because the fuzzy picture-text segmentation algorithm extracts the texts based on the coefficients of wavelet transform, it just need to compensate the coefficients of text components from the coefficients of wavelet transform. Our method is to directly compensate the text components by the average of neighboring data in the LL2 band, and set the coefficients of text components in HLi, LHi, and HHi (i=1,2) bands as zeroes. After compensating the text components in the sub-band coefficients, the wavelet transform is adopted for the coefficients of LL2 band continuously. Then, the zerotree coding algorithm is used to encode the coefficients of wavelet transform.
2.5 Experimental results
The proposed coding algorithm was simulated on Window 2000 (Pentium Ⅲ
700, 128 MB RAM) with programs written in C++ language. In this study, we used
the 24-bit true color image format and 200 dpi in processing. Each pixel in a 24-bit
true color image is characterized by its R, G, and B color values, and 8 bits represent
every value. Fig.13 and Fig.14 show the comparison of the JPEG and the new
compression algorithm. The time of performing fuzzy picture-text segmentation in
Fig.13(c) and Fig.14(c) are both 0.02 sec. Experimental results show that the
compression algorithm based on fuzzy picture-text segmentation has achieved better
2.6 Concluding remarks
Traditional color image-compression standards such as JPEG are inappropriate
for document images. JPEG’s application relies on the assumption that the high
spatial frequency components in images can be essentially removed without much
quality degradation. While this assumption holds for most pictures of natural scenes,
it does not work for document images. The texts require a lossless coding technique to
maximize readability. This chapter has proposed a new compression method with
promising performance on color document images. The method uses different
compression algorithms based on fuzzy picture-text segmentation for sub-images with
different characteristics. The fuzzy picture-text segmentation algorithm is based on
the coefficients of wavelet transform. It is fast to find out the text components and
picture components from the coefficients of wavelet transform. We have also
compared our method with JPEG. The results show that the new compression method
Fig.13(a) The original image(512×1024, scanned by ScanMaker V600 at 200dpi)
Fig.14(a) The original image(1024×512, scanned at 200dpi)
Fig.14(b) JPEG image(CR=83.1)
CHAPTER 3
THE COMPRESSION ALGORITHMS FOR
COMPOUND DOCUMENT IMAGES WITH
LARGE TEXT/BACKGROUND OVERLAP
This chapter presents two algorithms for compressing image documents, with a
high compression ratio of both color and monochromatic compound document images.
The proposed algorithms apply a new segmentation method to separate the text from
the image in a compound document in which the text and background overlap. The
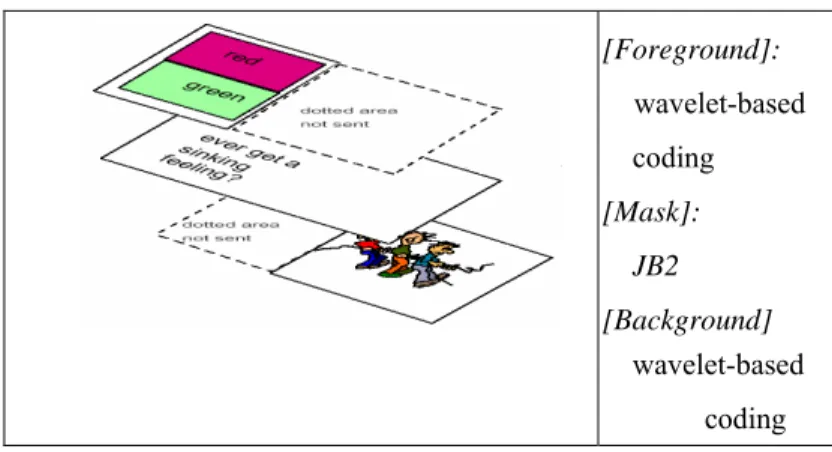
segmentation method classifies document images into three planes: the text plane, the
background plane, and the text’s color plane. Different compression techniques are
used to process the text plane, the background and the text’s color plane. The text
plane is compressed using the pattern matching technique, called JB2. Wavelet
transform and zerotree coding are used to compress the background plane and the
text’s color plane. Assigning bits for different planes yields high-quality compound
document images with both a high compression ratio and well presented text. The
proposed algorithms greatly outperform the famous image compression methods,
JPEG and DjVu, and enable the effective extraction of the text from a complex
3.1 Introduction
A color page of A4 size at 200 dpi is 1660 pixels wide and 2360 pixels high; it
occupies about 12 Mbytes of memory in an uncompressed form. The large amount of
data prolongs transmission time and makes storage expensive. Texts and pictures
cannot be compressed by a single method like JPEG since they have different
characteristics. Digitized images of compound documents typically consist of a
mixture of text, pictures, and graphic elements, which have to be separated for further
processing and efficient representation. Rapid advances in multimedia techniques
have enabled document images, advertisements, checks, brochures and magazines to
overlap text with background images. Separating the text from a compound document
image is an important step in analyzing a document.
Document image segmentation, which separates the text from the
monochromatic background, has been studied for over ten years. Segmenting
compound document images is still an open research field. Traditional image
compression methods, such as JPEG, are not suitable for compound document images
because such images include much text. These image data are high-frequency
components, many of which are lost in JPEG compression. Text and the
high-frequency components thus become blurred. Then, the text cannot be recognized
easily by the human eye or a computer. The text contains most information, separating
research into document images. The traditional compression method cannot meet the
needs of the digital world, because when compound documents are compressed at a
high compression ratio, the image quality of the text part usually becomes
unacceptable.
Many techniques have been developed to segment document images. Some
approaches to processing monochromatic document images have already been
proposed. Queiroz et al. proposed a segmentation algorithm based on
block-thresholding, in which the thresholds were found in a rate-distortion analysis
method [26]. Some other systems based on a prior knowledge of some statistical
properties of the various blocks [11]-[15], or textual analyses [16],[17],[27] have also
been subsequently developed. All these systems focus on processing monochromatic
documents. In contrast, few approaches to analyzing color documents have been
proposed. Suen and Wang [19] utilized geometric features and color information to
classify segmented blocks into lines of text and picture components. Digipaper [28]
and DjVu [20],[21] are two image compression techniques that are particularly geared
towards the compression of a color document image. The basic idea behind Digipaper
and DjVu is to separate the text from the background and to use different techniques
to compress each of those components. The image of the text part in DjVu is encoded
using a bi-level image compression algorithm called JB2, and the background image
These methods powerfully extract text characters from a simple or slowly varying
background. However, they are insufficient when the background includes sharply
varying contours or overlaps with text. Extracting the text when the color of the
overlapped background is close that of the text is especially difficult. Finding a text
segmentation method of complex compound documents remains a great challenge and
the research field is still young.
This chapter proposes a new segmentation algorithm for separating text from a
complex compound document in 24-bit true-color or 8-bit monochrome. Two
compression algorithms that yield a high compression ratio are also proposed. The
technique separates text from background image after segmenting the text. Therefore,
it has many applications, such as to color facsimiles and document compression.
Moreover, the segmentation algorithm can be used to find characters in complex
documents with a large text/background overlap.
3.2 Text segmentation algorithm
When a document image is captured from a scanner, it can include several
different components, including text, graphics, pictures, and others. The textual parts
must be separated from a compound document image, whether effective compression
or optical character recognition (OCR) is intended.
This section introduces a new extraction algorithm that can separate text from a
(a) Test image A size=1024×1536 (b) Test image B size=1024×1536 (c) Test image C size=1024×1536 (d) Test image D size=1024×1536
(e) Test image E size=1344×1792
(f) Test image F size=1024×1536 Fig.15 The original full images (200 dpi)
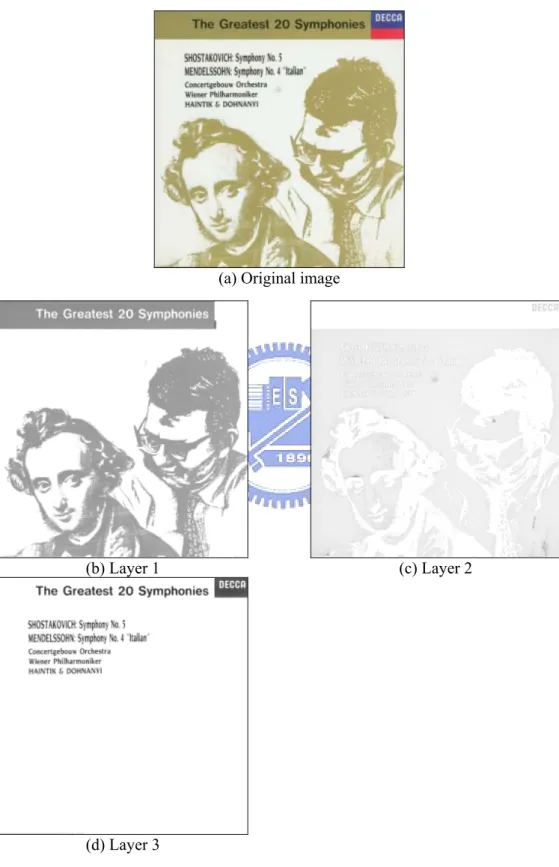
(a) Original Y-plane image
(b) Bright plane
(c) Medium plane
(d) Dark plane
The features and texture of a complex compound document can be very
complicated. In a pilot test, when a color document image was converted into a
monochromatic image, the gray value of the image of text differed slightly from the
gray value of the background image. However, the image of text cannot easily be
directly separated from the background image because the difference between the
gray values is too small. Therefore, two phases are used to accomplish the desired
purpose. In the first phase, which involves color transformation and clustering
analysis, the monochromatic document image is partitioned into three planes, the dark
plane, the medium plane, and the bright plane, as depicted in Fig.16. The color of the
text is almost all the same, so the variance of the text’s grayscale is small. Therefore,
all the text can be grouped in the same plane.
When the text is black, the text and some of the background with a gray value
close to that of the text is put in the dark plane. In contrast, the text is put into another
plane if it is not black. Thus, the text and some noise are coarsely separated from the
background. In the second phase, an adaptive threshold is determined to refine the
text by adaptive binarization and block extraction. The two phases in which the
algorithm extracts the text from the background are shown below.
A. Color Transformation
The color transformation technique is used to transfer a color document image to
complicated background image.
B. Clustering analysis
In general, after a color document image is converted into a monochromatic one,
the textures of the original color image are still present in the converted grayscale
image. The difference between the text’s gray value and that of the overlapping
background image is small. Thus, a clustering algorithm is used to split the grayscale
images. Clustering analysis roughly separates text from a background image. First, it
extracts as many as possible of the different textures of an image. The text is
embedded in one of the planes.
The clustering algorithm is described below.
Step 1. Partition the M×N grayscale image A
( )
i, j into p sub-block images xn( )
i,j . Each sub-block xn( )
i,j is of K×L, where n=1,2,…p.Step 2. Calculate the mean of gray value, mn, and the standard derivation,σ n, of each
K× L sub-block image. For the nth sub-block image xn
( )
i,j , the mean and standard derivation are computed asmn= L K j i x j i n × ∑ , (, ) ; (3-1) σ n= L K m j i x j i n n × ∑ − , 2 ] ) , ( [ . (3-2)
' 1 n C and Cn'2, by ' 1 n C =mn + 50. ×σn and ' 2 n C =mn − 50. ×σn. (3-3)
Step 4. Calculate the absolute difference of each pixel of xn
( )
i, j to Cn'1 and ' 2 n C using ' 1 , ij D = xn( )
i,j −Cn'1 and ' 2 , ij D = xn( )
i, j −Cn'2 . (3-4)Then, xn
( )
i,j partition into two clusters ηk(
k=1,2)
according to η1:{
( )
'}
2 , ' 1 , | , ij ij n i j D D x ≤ , and η2:{
( )
'}
2 , ' 1 , | , ij ij n i j D D x > (3-5)Step 5. Calculate the mean mnk and standard derivation σnk of the two clusters
(
k=1,2)
k
η using Equations (3-1) and (3-2), respectively.
If σn1 >σn2, then center Cn3 =mn −0.5×σn, and compute the two new centers
1 n
C and Cn2 using Cn1=mn1+0.5×σn1, and
2 n
C =mn1−0.5×σn1. (3-6)
Else, (if σn1<σn2, then center Cn3 =mn +0.5×σn, and compute the two new centers
1 n
C and Cn2 using Cn1=mn2 +0.5×σn2, and
2 n
C =mn2 −0.5×σn2. (3-7)
is partitioned into three clusters ψk (k=1,2,3) according to, : 1 ψ
{
xn( )
i, j |Dij,1<Dij,2 and Dij,1<Dij,3}
; : 2 ψ{
xn( )
i, j |Dij,2 <Dij,1 and Dij,2 <Dij,3}
; : 3 ψ{
xn( )
i,j |Dij,3 <Dij,1 and Dij,3<Dij,2}
; (3-8) where, Dij,1= xn( )
i,j −Cn1 , Dij,2= xn( )
i,j −Cn2 , and Dij,3= xn( )
i,j −Cn3 . (3-9) Repeat Steps 2 to 6 until all of the sub-block images xn( )
i,j (n=1,2,…p) have been processed.The optimal partition of the images depends on the intensity distribution of
background images and the lengths, sizes and layouts of the text strings. However,
analyzing those parameters is very complex. Therefore, images are partitioned into
equal sub-blocks for simplicity. This study used K=256 and L=128, and a value of p
that depended on the image size. The constants were determined empirically to ensure
good performance in general cases.
C. Adaptive binarization
After the first phase, the gray values of each plane become simpler than those of
the original document image. Then, the text is extracted from the background image
two classes, global and local. The global thresholding algorithm uses a single
threshold, while a local thresholding algorithm computes a separate threshold for each
local region. This work utilizes a local thresholding algorithm. Set the threshold value
THn of the dark and bright planes of the sub-block images xn
( )
i, j (n=1,2,…p) to,THn= m_fn ⎟⎟ ⎠ ⎞ ⎜⎜ ⎝ ⎛ ± n n n - m_f m_b m_f ×σ _fn (3-10)
, where m_fn is the mean value calculated from the pixels in one of the planes, xn
( )
i,j ;m_bn is the mean value calculated from the pixels in the other xn
( )
i,j plane , and σ _fn is the standard deviation calculated from the pixels in the same plane xn( )
i, j asm_fn.
Restated, m_fn is determined by the foreground pixels of the plane that is being
processed, while m_bn relates to the background pixels of the other two planes. From
Eq. (3-10), the value of THn can be adapted to the gray value of sub-block xn
( )
i,j . The foreground pixels in the dark plane are darker than the background pixels. Theadaptive thresholding value can be calculated as, THn= m_fn
-n n n -m_f m_b m_f ×σ _fn.
The threshold value THn is biased to the left of the mean value m_fn. The foreground
pixels in the bright plane are brighter than the background pixels. The adaptive
thresholding value can be calculated as, THn= m_fn +
n n n -m_f m_b m_f ×σ _fn. The threshold value THn is biased to the right of the mean value m_fn. Figure 17 gives an
example of the algorithm.
(a) Original sub-block image (b) Dark plane of the sub-block
(c) Histogram of image (b)
(d) Bi-level image after adaptive thresholding
Fig.17 An example of text extraction algorithm image(size=256×128)
Figure 17(a) is the sub-block image xn
( )
i,j , Figure 17(b) is the dark plane of the sub-block, and Fig. 17(c) shows the histogram of the sub-block image xn( )
i,j . The threshold value THn has a bias to the left of the mean value m_fn to clarify the text.Figure 17(d) shows the bi-level image.
D. Spreading and region growing for block extraction
The pixels of foreground and noise are obtained simultaneously using the
thresholding method. Accordingly, the isolated pixels are deleted and the Constrained
Run Length Algorithm (CRLA) [7] is applied to remove noise pixels.
binary images Mh
( )
i,j and Mv( )
i,j (1<i<M, 1<j<N), respectively. Then, the "AND"operator is applied to Mh
( )
i,j and Mv( )
i, j pixel by pixel, and a binary image,Mhv
( )
i,j , which merges the neighboring pixels in both directions, is obtained.The CRLA and the logic operation together constitute the spreading process,
after which, the binary spreading image Mhv
( )
i,j is processed using the regiongrowing method to arrange the foreground pixels into rectangular blocks. The region
growing method is described in the Chapter 2.
The processes of spreading and region growing yield the positions of the
foreground blocks.
E. Distinguishing text from foreground blocks
The blocks that contain foreground pixels are extracted following the spreading
and growing processes. The blocks that contain text strings must now be identified. In
this study, three parameters, transition pixel ratio, foreground pixel ratio, and block
size, are used to identify these blocks.
The transition pixel ratio is defined as,
T = block of Area block in pixels transition of number Total (3-11)
The transition pixel occurs at the boundary of foreground pixels. For example,