國立交通大學
國立交通大學
國立交通大學
國立交通大學
管理科學系碩士班
管理科學系碩士班
管理科學系碩士班
管理科學系碩士班
碩士論文
碩士論文
碩士論文
碩士論文
解釋類型與補救速度對不同性別
顧客滿意度與再購意願之影響
The Interaction between Types of Explanation and
Recovery Speed: An Analysis of Gender
Differences
研 究 生:何艾芸
指導教授:張家齊 博士
解釋類型與補救速度對不同性別顧客滿意度與再購意願之影響
The Interaction between Types of Explanation and Recovery Speed:
An Analysis of Gender Differences
研 究 生 :何艾芸 Student: Ai-Yun Ho
指導教授:張家齊 教授 Advisor: Dr. Chia-Chi Chang
國 立 交 通 大 學
管 理 科 學 系 碩 士 班
碩 士 論 文
A Thesis
Submitted to Department of Management Science
College of Management Science
National Chiao Tung University
in partial Fulfillment of the Requirements
for the Degree of
Master
in
Management Science
June 2008
Hsinchu, Taiwan, Republic of China
解釋類型與補救速度對不同性別顧客滿意度與再購意願之影響
學生: 何艾芸 指導教授: 張家齊
國立交通大學管理科學系 碩士班
摘要
追求高顧客滿意度以及高再購意願是許多公司的重要目標,但難以完全防止的服務 失誤,卻可能阻礙該目標的達成。因此,如何在服務失誤發生後,維持顧客滿意度以及 再購意願的水準,成為行銷領域很重要的探討議題。本文的主要目的是希望在補救速度 不同的情況下,針對不同性別的顧客,給予最適當的解釋類型以提高顧客滿意度及再購 意願。 本研究主要有以下的發現: 第一,針對顧客滿意度,解釋類型以及補救速度之間有顯著的交互作用。意即服務 失誤發生後,立即的補救搭配強調補救結果的解釋所能達成的顧客滿意度,與延遲的補 救搭配強調補救過程的解釋所能達成的顧客滿意度,兩者間沒有顯著差異。第二,本研 究中關於再購意願的假設都沒有成立,結果顯示補救速度會影響再購意願,但解釋的類 型則不會影響再購意願,缺乏補償可能是導致再購意願平均偏低的原因。第三,補救速 度、解釋類型以及顧客性別三個變數間,不存在顯著地交互作用,但當解釋強調補救結 果時,男性顧客會較滿意;解釋強調補救的過程時,女性的顧客則會較為滿意。 關鍵 關鍵 關鍵 關鍵字字字字::::服務補救服務補救服務補救服務補救、、、、解釋類型解釋類型、解釋類型解釋類型、、、補救速度補救速度補救速度補救速度、、、、性別性別性別性別The Interaction between Types of Explanation and Recovery Speed:
An Analysis of Gender Differences
Student: Ho, Ai-Yun Advisor: Dr. Chang, Chia-Chi
Department of Management Science
National Chiao Tung University
ABSTRACT
Pursuing high customer satisfaction and repurchase intention is the major goal for many companies. Unavoidable service failure could be a barrier to achieve the goal. Thus, how to maintain customer satisfaction and repurchase intention in a high level after service failures is became an important issue in marketing field. The main purpose of this study was to increase customer satisfaction and repurchase intention in response to different recovery speeds by using adequate types of explanations across gender differences. The results of the study indicate several findings:
First, there were significant interaction between types of explanations and recovery speeds on customer satisfaction. Customer satisfaction was not differing significantly whether an immediate recovery combined with outcome-oriented is provided or a delayed recovery combined with process-oriented is provided. Second, hypotheses about the repurchase intention were not supported by this study. Results showed that repurchase intention was affected by the recovery speed, but not by types of explanation. Third, there were no three-way interactions between recovery speeds, types of explanations and genders. However, if type of explanation focused on outcome, then male customers were more satisfied; whereas, if it focused on process, female customers were more satisfied.
誌謝
「逝者如斯夫,不捨晝夜。」研究所兩年時光,匆匆地就過了,如果說我有留下些 什麼,應該就是這本論文了。我最感謝的人,就是親愛的指導教授—張家齊老師,每個 星期花五個小時以上的時間跟我們 meeting,就連出國開會使用視訊,在她耐心的指導 下,我才能完成這本論文。也很感謝口試委員給我的許多意見與指教,讓我的論文能更 盡完善。 爸爸、媽媽,感謝你們讓我無憂無慮地度過快樂的碩士生涯,在我心情煩躁時給予 我支持,讓我輕鬆的在家完成論文;爺爺、奶奶、外公、外婆,雖然沒有說出口,但是 你們是我心中永遠的支柱,很高興可以跟你們說:「我畢業了!」哥哥,和你聊天鬥嘴的 時,是我最放鬆、最開心的時候,撰寫論文的無趣感覺,因為你的笑聲而減少了;My dear cousin, Elain, I have to tell you that I really appreciate your help to modify my thesis so many time.親愛的張門同志—培真、慧妤、雅君、柏源,感謝你們陪我一起奮鬥這麼久。認真 的阿培,和你住在一個屋簷下的那些日子,是我碩士生涯最快樂的時光,唸書、寫報告、 煮飯、打鬧…和你在一起,真的很開心,常讓別人覺得我們是認識多年的好友;可愛的 慧妤,出了社會,我一定得好好學習你那「阿信」般的好脾氣,雖然我常嗆你,但是妳 知道的,我很愛妳☺;井井有條的雅君,你總是如此的 organized,希望你的寶貝物品 能一直潔白如新,妳可以每天都能睡滿八小時;最後,我歡笑的泉源--邱 Q,你真是一 位少見的新好男人,總是任勞任怨的幫我們四個女生做很多事,既有內涵個性又有好, 認識你,讓我每天都過很開心。你們的友誼,是我在交大得到最珍貴的寶物。 椿豪,與你相識於台大,一起度過精采的大學生涯;碩士兩年,新竹與台北的距離 也沒有拆散我們,當我為了問卷忙翻天;擔心分析結果不好而沮喪;害怕電腦中毒資料 全毀…,這些時間,你都溫柔地陪在我身旁,聽我抱怨,協助我度過低潮。 謝謝你,貓咪最愛的狗子。 何艾芸 謹誌 交通大學管理科學所 九十七年六月
TABLE OF CONTENTS PAGE 摘要 摘要摘要 摘要...i ABSTRACT ... ii 誌謝 誌謝誌謝 誌謝... iii
TABLE OF CONTENTS ...iv
TABLE INDEX...vi
FIGURE INDEX ...vi
CHAPTER 1 INTRODUCTION ...1 1.1 Background...1 1.2 Research motivation ...3 1.3 Research purposes ...5 1.4 Research questions ...6 1.5 Research structure...7
CHAPTER 2 LITERATURE REVIEW AND RESEARCH HYPOTHESES...9
2.1 Recovery speed...9 2.2 Types of explanation...10 2.3 Customer satisfaction ...13 2.4 Repurchase intention ...14 2.5 Gender ...16 2.6 Research framework ...19
CHAPTER 3 RESEARCH METHODOLOGY...20
3.1 Conceptual research framework ...20
3.2 Designing scenario ...21 3.3 Sampling plan ...22 3.4 Measurements...23 3.4.1 Recovery speed...23 3.4.2 Types of explanation ...23 3.4.3 Customer satisfaction ...24 3.4.4 Repurchase intention...24 3.5 Data collection...25 3.7 Pretest ...26
CHAPTER 4 RESEARCH ANALYSIS AND RESULTS...27
4.1 Manipulation check ...27
4.2 Background of participants...29
4.3 Reliability of the results...31
4.4 Analysis of Results ...31
4.4.3 Genders differences ...36
CHAPTER 5 DISCUSSION AND FUTURE RESEARCH ...39
5.1 Discussion...39
5.1.1 Recovery speed, types of explanations and customer satisfaction ...39
5.1.2 Recovery speed, types of explanations and repurchase intention ...40
5.1.3 Adequate explanations ...41 5.1.4 Genders...41 5.2 Implications ...42 5.3 Limitations...43 5.4 Future research ...45 REFERENCE ...47 APPENDIX I...50 APPENDIX II ...54 APPENDIX III ...58
TABLE INDEX
Table 1. Reliability Statistics of Customer Satisfaction ...26
Table 2. Reliability Statistics of Repurchase Intention...26
Table 3. Reliability Statistics of Recovery Speed...27
Table 4. Manipulation Check of Recovery Speed ...28
Table 5. Reliability Statistics of Types of Explanation...28
Table 6. Manipulation Check of Types of Explanation (Outcome)...28
Table 7. Manipulation Check of Types of Explanation (Process) ... 29
Table 8. Demographics of Participants...29
Table 9. Reliability Analysis of Customer Satisfaction and Repurchase Intention ...31
Table 10. Overall MANOVA: Customer Satisfaction and Repurchase Intention...32
Table 11. Tests of Recovery Speed and Types of Explanation ...33
Table 12. Tests of Recovery Speed and Types of Explanation...33
Table 13. Multiple Comparisons of Scenario ...34
Table 14. Tests of Recovery Speed, Types of Explanation and Gender ...36
Table 15. Tests of Recovery Speed, Types of Explanation and Gender (Summarized) ...37
Table 16. Multiple Comparisons of Gender and Recovery Speed ...38
Table 17. Results of all hypotheses (summarized) ...39
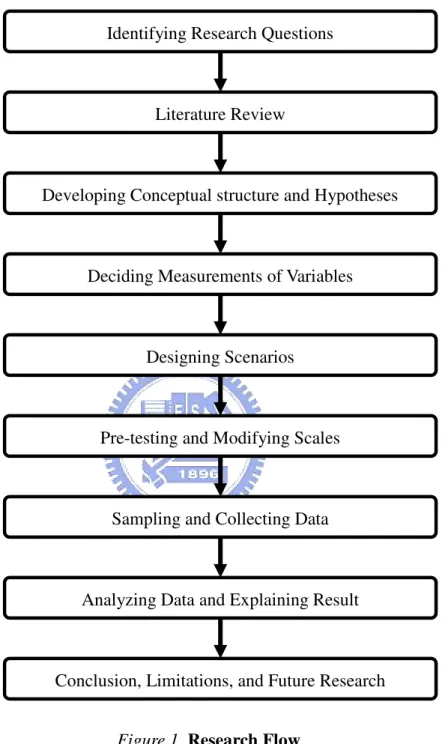
FIGURE INDEX Figure 1. Research Flow...8
Figure 2. Research Framework...19
Figure 3. Conceptual Research Frameworks ...20
CHAPTER 1 INTRODUCTION 1.1 Background
Recently, not only service companies but also commodities companies have paid more attention to service quality and customer satisfaction (Anderson, Fornell, & Lehmann, 1994; Rust & Zahorik, 1993). Every manager understands that the key to attracting new customers and keeping the old customers was to provide high quality services and products (Halstead, Morash, & Ozment, 1996). It is important for companies to run a business successfully by keeping the old customers and establishing strong relationships with them (Tax & Brown, 1998). Managers have many different tasks, such as designing the standard operation procedures and training employees to improve customer satisfaction and maintain it. For this reason, managers have tried to avoid any single service failure. Service failures might result in negative influence, such as customer dissatisfaction (Parasuraman, Zeithaml, & Berry, 1985), which would cause switching to other companies, and negative word-of-mouth (Richins, 1983). However, there are too many uncontrollable factors in a service encounter, so that it seems difficult or even impossible to totally eliminate service failures in the real world(DeWitt & Brady, 2003; Hart, Heskett, & Sasser Jr, 1990).
As prior studies have mentioned, managers find it difficult to eliminate service failures, but they might devise ways to decrease the number of unsatisfied customers. One of those ways is to provide satisfying service recoveries to customers after service failures. The effect of
service recovery would directly influence customer satisfaction (Blodgett, Wakefield, & Barnes, 1995; Gilly & Gelb, 1982). If after service failures, firms followed adequate service recovery policies and applied those policies well, then dissatisfied customers may return to a state of satisfaction (Michel, 2001; Sparks & McColl-Kennedy, 2001). Managers should be careful when providing service recovery to customers. Effective service recoveries might increase customer satisfaction and their repurchase intention (Cronin Jr & Taylor, 1992). On the other hand, poor service recoveries might produce the “double deviation” effect, exacerbating customer dissatisfaction (Bitner, Booms, & Tetreault, 1990) because customers were more emotionally involved and observant of recovery service than the first-time service. Compared to receiving a failed service, customers are left more dissatisfied when getting an inappropriate recovery (Bitner et al., 1990).
Many studies have indicated that customer satisfaction is an important mediator for repurchase intention (DeWitt & Brady, 2003; Wirtz & Mattila, 2004), which is the main reason why customer satisfaction is so important to firms. Effective service recovery after service failures is an opportunity to convert the dissatisfied customers into satisfied ones after service failures. However, it has proved difficult to provide service recoveries to match the customer expectation and then successfully increase the customer satisfaction (Hart et al., 1990). As a result, developing effective service recovery strategies has become a focus for many researchers and managers (Stauss & Friege, 1999).
1.2 Research motivation
Many variables may influence the service recovery satisfaction, customer satisfaction after the service recovery. The justice theory is a basic, but influential theory for explaining the customer satisfaction (Oliver & Swan, 1989). Some prior studies which combined justice theory and service recovery, found that speed of response was an important variable, and was used to measure the procedural justice, one of three dimensions of justice, which has a significantly positive relationship to customer satisfaction. In other words, compared to a delayed response, an immediate response may increase customer satisfaction to higher level (Smith, Bolton, & Wagner, 1999; Wirtz & Mattila, 2004). Every firm trains its employees to be good at providing fast and adequate recovery. However, just as managers cannot always eliminate service failures, the speed of response may sometimes lag. Once there is a delayed response, customer satisfaction may decrease and consequently induce other negative influences. To improve the speed of response, managers have used many methods, such as training, empowering staff and establishing guidelines and standards for service recovery (Tax & Brown, 1998). However, not enough research has paid attention to what are adequate solutions to counter a delayed response.
Other studies indicate that adequate explanations may increase the outcome justice, and consequently increase recovery satisfaction. This means the types of explanation is an element that can effect whether the explanation is adequate or not (Dunning, Pecotich, & O'Cass,
2004). It can also be expected that there may be distinct, adequate explanations offered in immediate recovery speed and in delayed recovery speed. Irrespective of whether customers receive immediate service recoveries or delayed service recoveries, if distinct recoveries were accompanied by adequate types of explanations, customer satisfaction and repurchase intention would be increased.
Besides the types of explanation, gender may also affect the efficiency of explanations related to the relationship between recovery speed and customer satisfaction and repurchase intention, depending on the types of explanation. Customers of different genders place different emphasis on particular elements of the service recovery process. McColl-Kennedy, Daus and Sparks (2003) found that both male and female customers would be happier when service providers displayed their concerns to them and gave them the opportunity to convey what they wanted. However, the same study also showed that the differences between male and female customers regarding their perception of how service recovery should be handled were sometime significant. Female customers preferred their opinions being heard during the period of service recovery. On the contrary, male customers did not view being heard to be so important, and paid more attention to the outcome of the recovery. The most important thing for men was what they would get from the recovery (McColl-Kennedy et al., 2003). This study predicts that the explanation focus on recovery outcome will be more effective on male customers; whereas the explanation focus on recovery process will be more effective on
female customers. The study also sets out to examine whether the effects of recovery speed on customer satisfaction and repurchase intention will be different depending on types of explanations offered to different genders.
1.3 Research purposes
The main purpose of this study was to increase customer satisfaction and repurchase intention in response to different recovery speeds by using adequate types of explanations. The second purpose of this study was to examine delayed recovery, because it usually results in lower customer satisfaction and lower repurchase intention than immediate recovery does. A further purpose of this research was to examine whether gender was a moderator, which affected the efficiency of types of explanations. What is the optimal combination of explanation and speed of recovery for male and female customers in order to increase customer satisfaction and repurchase intention?
It was suggest that in order to increase customer satisfaction and repurchase intention, immediate recovery should be combined with an explanation that focused on the recovery outcome and that delayed recovery should be combined with an explanation that focused on the recovery process. The efficiency of the two pairs could be affected by the gender of customers. Thus, for male customers, who considered the outcome of recovery more important than the process of recovery, the explanation focus on outcome would be more
effective, whereas for female customers, who considered the process of recovery more important, the explanation focus on the process would be more effective.
1.4 Research questions
Prior studies indicated that if the customer satisfaction and repurchase intention after service failures are influenced by recovery speed. Generally speaking, if other variables are the same, then the faster the recovery speed, the higher the customer satisfaction and repurchase intention. This study then sets out to examine two major questions. The first question is whether the types of explanation will affect this effect, suggesting that an immediate recovery combined with an explanation focus on the recovery outcome, and a delayed recovery combined with an explanation focus on the recovery process, will achieve the highest level of customer satisfaction and repurchase intention. The second question is whether the influence of the types of explanations will be affected by the gender of customers. It can be expected that gender could moderate the effectiveness of the types of explanations to distinct recovery speed.
1.5 Research structure
This research report comprises five chapters, which are outlined below.
Chapter one introduces the research background, research motivation, research purpose, research questions and research structure.
Chapter two reviews the existing literature relevant to this research and forms various hypotheses. It covers customer satisfaction; repurchase intention, recovery speed, types of explanation and gender. In this research, recovery speed is an independent variable and customer satisfaction and repurchase intention are dependent variables. The types of explanation will serve as a moderator of recovery speed, customer satisfaction and repurchase intention, and ender will serve as a moderator of the moderator, the types of explanation.
Chapter three illustrates the experiment design, data collection, sample selection, measurement, manipulation check, and pre-test.
Chapter four tests the hypotheses and shows the statistical results of the research. The data analysis methods include Reliability Analysis, MANOVA, Independent-Sample T Test, and ANOVA. According to using statistical analysis, some findings in this study could be explained.
Chapter five discusses the results and implications of the study, describes its limitations, and provides suggestions for further research.
Figure 1. Research Flow
Identifying Research Questions
Literature Review
Developing Conceptual structure and Hypotheses
Deciding Measurements of Variables
Designing Scenarios
Pre-testing and Modifying Scales
Sampling and Collecting Data
Analyzing Data and Explaining Result
CHAPTER 2 LITERATURE REVIEW AND RESEARCH HYPOTHESES 2.1 Recovery speed
In sociological filed, social exchange researchers have identified three dimensions of perceived justice that influence how people evaluate exchanges. First, distributive justice involves resource allocation and the perceived outcome of exchange. Second, procedural justice involves the policies or methods of making decisions and resolving conflicts, and third, interactional justice involves the manner in which information is exchanged and outcomes are communicated (Bies & Shapiro, 1987).
On the basis of the results of the studies involving customers’ perceptions of fairness, marketing researchers concluded that customers also evaluate service encounters on the following three dimensions: outcome, the benefits that customers receive as a result of the encounter; procedure, the policies and methods of the service providers that guide the encounter; and interaction, the quality of the interpersonal treatment and communication during the encounter (Clemmer & Schneider, 1996).
In some advanced research on how to make efficient service recovery take place, and using the justice approach as a theoretical framework, Tax, Brown and Chandrashekaran (1998) found a positive relationship between the three dimensions of justice and satisfaction with complaint handing. Furthermore, satisfaction was positively related to a customer’s trust and commitment. These authors concluded that all three dimensions of distributive, procedural
and interactional justice were important in achieving a higher level of customer satisfaction. Smith et al. (1999) focused their research on the effects of perceived justice on customer satisfaction with service failure and recovery encounters. They identified that after controlling the effects of disconfirmation that arise from the service encounter as a constant, customer satisfaction was influenced by customers’ perceptions of all three dimensions of justice. Specifically, they identified that compensation had a positive effect on customers’ perceptions of distributive justice; a speedy recovery had a positive effect on customers’ perceptions of procedural justice and an apology had a positive effect on customers’ perceptions of interactional justice.
Following many earlier studies (Dunning et al., 2004; Smith et al., 1999; Sparks & McColl-Kennedy, 2001; Wirtz & Mattila, 2004), it may be suggested that recovery speed is a useful independent variable when researchers predict customer satisfaction and repurchase intention.
2.2 Types of explanation
Explanation is an important element of a successful service recovery. After service failure, if service providers or managers can provide an adequate explanation, then a consumer’s sense of injustice and emotional reaction may be reduced. Furthermore, this might increase customer satisfaction (Conlon & Murray, 1996; Smith et al., 1999). Conlon & Murray (1996)
used the types of explanation as an independent variable. These authors collected many letters of explanation from companies and then categorized these explanations into six types. They examined each type of explanation in order to determine which type was most useful in increasing complainant satisfaction and repurchase intention. They concluded that giving customers explanations, which represent justification and apologies, could result in greater satisfaction and repurchase intention.
Dunning et al (2004, p. 5) mentioned that “a primary purpose of an explanation is to restore the balance in the customer–salesperson relationship.” Once the customer’s sense of injustice was replaced by a feeling of fair treatment, this balance was restored. The authors noted that explanation adequacy had a positive relationship with perceived justice of the resolution and indicated that explanation adequacy was influenced by the style and types of explanation, and the timeliness of an organization’s reaction.
What elements are necessary for an adequate explanation? Bies (1987) identified that it had to possess two primary characteristics. The first was appropriate content otherwise known as informational validity. The second characteristic was suitable style, which refers to the degree of interpersonal sensitivity, informational quality, or the nature of delivery communicated to the recipients. This may suggest that explanations would be improved by good content and appropriate styles.
Following this earlier research, it was suspected that types of explanation would influence the relationship between recovery speed and the two independent variables: customer satisfaction and repurchase intention.
The research identified two types of explanation, one with a focus on outcome and the other with a focus on process. Zhao, Hoeffler, & Zauberman (2007) mentioned that people have different preferences at different times, otherwise known as preference inconsistency. The pattern of preference inconsistency over time could be attenuated by regulating the levels of mental representations. They found when the final goals were set in the distant future, and people went through “process simulation” by being encouraging imagining the step-by-step process before they arrived at the goals, they would then pay more attention on the feasibility of the goals and like the benefits of the goals more. On the other hand, if the final goals were to take place in the near future, then people would like the benefits of the final goals more when going through “outcome simulation”, which encourages people to think about the desirable outcome rather than the step-by-step process. Similar to that preference to goals at different temporal distances may be affected by emphasizing the process or the outcome. It was proposed that this kind of influence will exist in the service encounters. After service failure, customers want to get some compensation for their lost. “Outcome simulation” or “process simulation” were stimulated via different types of explanations in order to influence customer satisfaction after service failure in this study. When a recovery was immediate,
explanation focused on outcome which was the same as “outcome simulation”, was more effective than “process simulation” in changing customer preference for the recovery strategy, and further, increasing customer satisfaction and repurchase intention. On the other hand, when recovery was delayed, explanation focused on process which was the same as “process simulation”, was more effective than “outcome simulation”.
2.3 Customer satisfaction
There is no doubt that many marketing researchers have paid attention to the area of customer satisfaction (Fournier & Mick, 1999; Oliver, 1999). However, this complex variable, satisfaction, appears to conceptually overlap with numerous other variables. In order to increase the consistency in academic research in this area, some distinctions have been made between satisfaction and other closely related constructs, such as perceived service quality (Spreng & Mackoy, 1996) and product value and attitudes (Bagozzi, Gopinath, & Nyer, 1999).
Early researchers suggested that satisfaction was a result of a comparison between a consumer’s expectations of the service or product and the actual experience that customers received from providers (Oliver, 1980). This definition is also known as the “disconfirmation of expectations paradigm”. Currently, in reviewing 30 years of literature on satisfaction , Giese and Cote (2000) suggested that the satisfaction construct consisted of three basic
elements, which were response, focus and time. These three elements were then used to analyze interview data to examine whether their findings were consistent with that in the literature. The results indicated that customers tended to view satisfaction as affective construct. Hence the authors concluded that satisfaction was an “affective summary response” towards the product or service consumed.
Rather than treating satisfaction as a simple one-dimensional construct, many researchers argued that satisfaction was a multi-dimensional construct. They indicated that satisfaction incorporated cognitive elements related to beliefs and expectations of service or products, and effective elements that included emotions (Stauss & Neuhaus, 1997). Other investigations, such as that of White and Yu (2005), showed that aspects of satisfied emotions were best conceptualized as a three-dimensional construct that included positive, negative and “bi-directional” emotions.
Considering this literatures, it is obvious that increasing customer satisfaction is an important goal for both marketing academia and industry. Customer satisfaction was thus chosen as one of dependent variables in this research project.
2.4 Repurchase intention
Companies have traditionally been interested in customer satisfaction, but not in repurchase intention. Managers conjectured that customers would continue to purchase products frome
their companies if they were satisfied with the service or product. In other words, they instinctively imagined a high level of satisfaction that represented a high level of repurchase intention. Most studies showed there was a direct relationship between these two factors. Customers with a higher level of satisfaction usually had higher repurchase intention (Newman & Werbel, 1973). However, many recent researchers have mentioned that satisfaction could not entirely represent repurchase intention, because customer satisfaction was not the only element that might affect the level of customers’ repurchase intention (Richins, 1983).
Repurchase intention, as distinguished from satisfaction, had been seen as an important variable in marketing field. Smith and Bolton (1998) showed that in service encounter, customer satisfaction influenced repurchase intention both directly and indirectly. Besides, customers’ repurchase intention was more responsive to recovery efforts than satisfaction, which was more responsive to recovery outcome. In other words, service recovery cannot entirely change customers’ evaluation of their bad service experiences, but customers might be willing to give the company another chance.
By measuring customer satisfaction and repurchase intention, managers can evaluate the efficiency of service recovery (Smith & Bolton, 1998). Accordingly, repurchase intention was chosen as the second dependent variable in this research.
Thus the following hypotheses were developed:
H1a: If the attendants give a recovery immediately after a service failure, then customer satisfaction will be higher if explanations focus on the outcome than on the process.
H1b: If the attendants are given a recovery immediately after a service failure, then repurchase intention will be higher if explanations focus on the outcome than on the process.
H2a: If the attendants give a delayed recovery after a service failure, then customer satisfaction will be higher if explanations focus on the process than on the outcome
H2b: If the attendants give a delayed recovery after a service failure, then repurchase intention will be higher if explanations focus on the process than on the outcome.
H3: The customer satisfaction after a service failure will not differ significantly whether an immediate recovery combined with outcome-oriented is provided or a delayed recovery combined with process-oriented is provided.
2.5 Gender
In this complex world, we must realize that customers are not homogeneous in their evaluation of the effectiveness of service recovery (Smith et al., 1999) if we want to increase customer satisfaction and repurchase intention after service failures. For convenience, researchers usually segmented customers according to some demographic data, such as age,
education, or monthly income. Gender is one of the most important dimensions of such segmentation. Initially, gender has usually been discussed in the fields of psychology or sociological. Certain differences between male and female have been consistently demonstrated. The relevant theories such as social role theory, which accounts for much of the observed differences between the two genders, has been implicated to the marketing field (Saad & Gill, 2000). Gender has been used as a category to segment customers generally
within consumer behavior and marketing for a long time (Meyers-Levy & Sternthal, 1991). Iacobucci & Ostrom (1993) indicated that male and female customers were inclined to react
somewhat differently to their informational environment, which meant they paid their attention to different aspects of a service encounter. In the short term, male customers tended to focus more on core aspects of the service, while female customers tended to focus more on the relational aspects. Gender is clearly an important variable that might affect customers in evaluating their satisfaction. Recently, McColl-Kennedy et al. (2003) showed that the gender of customers and the gender of service providers would influence the recovery efficiency. If the gender of customers had been well-matched with the gender of service providers, then customers would show higher customer satisfaction and higher future intentions. It may suggest that the same service recovery provided to male and female customers might result in different levels of customer satisfaction and repurchase intention because the genders of customers are distinct.
According to some psychologists, the socialization process might be the reason why there are gender differences. They argued that men and women developed different processes to deal with information according the rules of society (Archer, 1996). In marketing field, researchers used certain terms to explain these differences. They might use “task oriented” to describe men because men paid more attention to the outcome in service encounter. By contrast, marketing researchers use “socially oriented” to describe women because women paid more attention to the process in service encounter (Iacobucci & Ostrom, 1993). It was thus expected that male customers appreciated the outcome of service recovery; and female customers appreciated the process of the service recovery. In this study, we suspect that the gender of customers might be an interesting variable which influences the utility of two types of explanations with two levels of recovery speed, and the following hypotheses were consequently developed:
H4a: If the types of explanation emphasizes the outcome under immediate recovery circumstances, then there are stronger effects on male customers than on female customers whereas, if the types of explanation emphasizes on the process under delayed recovery circumstances, then there are stronger effects on female customers than on male customers. H4b: If the types of explanation focus on outcome, then male customers will be more satisfied whereas, if the types of explanation focus on process, then female customers will be more satisfied.
2.6 Research framework
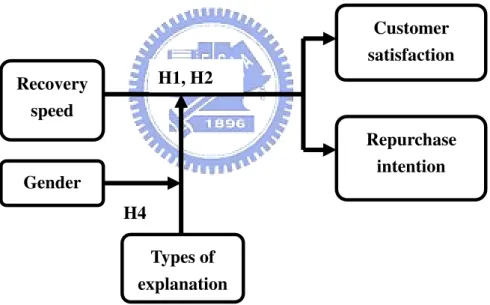
The major purpose of this research was to identify whether the impact of recovery speed on customer satisfaction and repurchase intention could be distinguished according to different types of explanation. This study also set out to analyze whether customer gender would affect the influence of different types of explanation. The main research framework of this study is depicted in Figure 2 below.
* Hypothesis 3 could not be pointed at this figure.
Figure 2. Research Framework
Recovery speed Customer satisfaction Repurchase intention Types of explanation Gender H1, H2 H4
CHAPTER 3 RESEARCH METHODOLOGY 3.1 Conceptual research framework
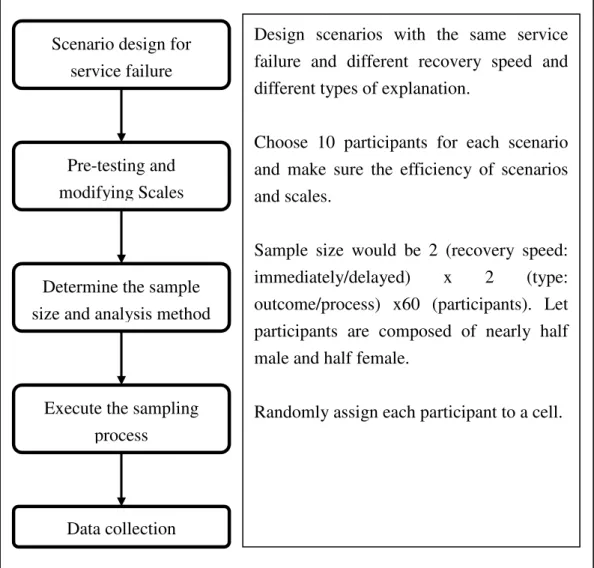
Figure 3. Conceptual Research Frameworks
Scenario design for service failure
Pre-testing and modifying Scales
Determine the sample size and analysis method
Execute the sampling process
Data collection
Design scenarios with the same service failure and different recovery speed and different types of explanation.
Choose 10 participants for each scenario and make sure the efficiency of scenarios and scales.
Sample size would be 2 (recovery speed: immediately/delayed) x 2 (type: outcome/process) x60 (participants). Let participants are composed of nearly half male and half female.
3.2 Designing scenario
A described scenario was used in this study for several reasons. First of all, Smith et al. (1999) showed that this scenario method could avoid the problems of intentionally imposing service failures on customers and minimizing memory-bias. This kind of bias was frequent encountered in self-reports of service failures in survey designs. By minimizing memory-bias, researchers could prevent participants from overstating their service failure experience. Second, as Smith & Bolton (1998) indicated that scenarios could be more effectively manipulated than in real-life settings. The scenario method could create greater variability in customer responses to service recovery than observation in a natural environment could provide. Besides, observing people in actual situation would be both costly and very time consuming. Third, the scenario method reduced problems such as individual differences in responses and personal circumstances to fit into the research context. In other words, the scenario method enhanced internal validity by being able to control extraneous variables and manipulated them (Bateson & Hui, 1992). For all these advantages, many researchers choose the scenario method to avoid- or at least reduce- all of the potential limitations and problems. The scenario method is most successful when the designed scenario is highly congruent with participants’ experience, so that participants can easily imagine the experimental scenarios (Dabholkar, 1996). Therefore, we ensured that the scenarios were realistic and participants were familiar with the situations described in the scenarios. Although the scenario method is
not without deficiencies, we believed its advantages make it well-suited for this research. 3.3 Sampling plan
A 2 × 2 × 2 between-subject factorial design was used to test our predictions: the influence of recovery speed and toward customer satisfaction, and repurchase intention, with distinct types of explanation and different genders. There were two levels of recovery speed (immediately and delayed), two types of explanation (the focus on the outcome in the service recovery and the focus on the process in the service recovery) and the two genders. There were four kinds of scenarios in this study because the gender of participants was not manipulated. Sixty participants were asked to participate in one scenario independently, which meant the sample numbers would be 240 (60 × 4 = 240).
Participants were exposed to a written scenario describing a service failure in a computer repair station. The scenarios are attached asAppendix I. Participants were told that it was a study about consumer behavior and were given a questionnaire. The questionnaire contained three major parts. The first part described the scenario. Participants were asked to read the scenario carefully and image themselves in it. The second part listed some questions about (CS) customer satisfaction, (RI) repurchase intention, (RS) recovery speed and (ToE) types of explanation. The third part contained demographic information. The questionnaire is attached as Appendix III
3.4 Measurements 3.4.1 Recovery speed
There were two levels of recovery speed in this study, immediate recovery and delayed recovery, with recovery speed being defined as, “how much time did the attendant in the repair station spend on fixing the computer?” An immediate recovery took 15 minutes and a delayed recovery took 3 days. As used by Wirtz & Mattila (2004), two 7-points items with high reliability (r = 0.81) were used in this study. In order to fit the scenario, some words were modified in this study. The two items were, “The attendance was quick in doing some recovery,” and “The length of time taken to give recovery was longer than necessary.” Seven-points represented “extremely agree” and one point represents “extremely disagree.”
3.4.2 Types of explanation
There were two kinds of explanations in this study, which focused on outcome or on the process. That for the outcome was, “After the component is changed and repaired, it will never have the problem about detecting no wireless network. And it will be more comfortable
and convenient to send and receive mails and to surf the internet. We are sorry to cause the inconvenience and beg your pardon.” On the other hand, the response which focused on process was, “After checking out the in-store data, we found that the component which has to be replaced was out of production. We do not have the component in this station because it
was sold out. We have already back ordered the component from other repair station. However, it will take longer for repairing your notebook. We are sorry to cause the inconvenience and beg your pardon.” The 7-points Likert scale was chosen, and participates were asked “Do you think the explanation is focus on the process/outcome?” Seven-point represents “strongly agree” and one-point represents “strongly disagree.”
3.4.3 Customer satisfaction
The 7-points Likert scale was chosen here as well, the seven being, “strongly agree” and one point being, “strongly disagree.” Following prior research and modifying the words to fit this study, customer satisfaction after the service recovery was measured using a three-item scale. Three items are “The service provided by the repair station is satisfied”, “Deciding to come to this repair station was not a good decision” and “I am satisfied with the service provided by the repair station.”
3.4.4 Repurchase intention
In Blodgett, Hill, & Tax (1997), customers’ repurchase intention was measured with three items. The resulting scales were highly reliable; Cronbach’s alpha for it was 0.91.Just like the measurement of customer satisfaction, some descriptions of the items were modified for more fit the scenario in repurchase intention. Three items were “The likelihood that I would consume at this repaired station in the future is high”; “If this situation had happened to me I
would never consume at this repaired station again.” and “If this had happened to me I would still consume at this repaired station in the future.”
3.5 Data collection
The data was gathered from 40 participants in the pilot study and 240 participants in the main study. Data were collected via two major channels. In first the questionnaires were handed out to students in the classes at National Chiao Tung University (NCTU) and National Taiwan University (NTU) through. The second was using the Internet to distribute and collect questionnaires online. Four questionnaires with different scenarios were mixed and were given randomly to subjects. All participants were told about the purpose of this study, and were asked to complete the questionnaires carefully. Afterwards all participants were thanked with a small gift.
3.6 Manipulation check
One manipulation check was conducted to test if the recovery speed of the repair station was immediate or delayed. Another manipulation check was conducted to test whether the explanations given by the attendant were focused on the outcome or on the process. The scale items were mentioned in 3.4.1 and 3.4.2 above. The results of the manipulations are reported in chapter four.
3.7 Pretest
A pilot study was conducted to test the reliability of the questionnaire. This is a common method used to discover problems or misunderstandings in the design of the experiment, which can then be modified before the main study. After three failures and subsequent modifications, the fourth trial of the pilot study was successful.
The pretest was made by giving 40 participants the experimental questionnaires, and telling them the research was concerned with consumer behavior. There were 21 male and 19 female participants. Twenty-two of the 40 participants were students.
The reliability of the customer satisfaction scales was 0.759 (Table 1) and the reliability of the repurchase intention scale was 0.906 (Table 2). Both were higher than 0.7, and hence there was a significant difference between immediate and delayed of recovery speed group (p<0.00). The difference between the groups where explanation focused on outcome or on process was also significant, too (p<0.00).
Table 1. Reliability Statistics of Customer Satisfaction Cronbach's Alpha N of Items
.759 3
Table 2. Reliability Statistics of Repurchase Intention Cronbach's Alpha N of Items
CHAPTER 4 RESEARCH ANALYSIS AND RESULTS
This chapter covers the analysis and the results of the study and gives the background of the respondents, the manipulation check, and the reliability of the results. The scenarios used in the study were pretty realistic. The reality score was 5.94 on the 7-points Liker scale. Since participants thought the situations described in the scenarios could happen in real life, the following tests and discussions were meaningful. Some data analysis techniques such as MANOVA, Contrast T Test and Independent-Sample T Test were employed to test the hypotheses and using the tool of SPSS 12.0. SPSS is a wild used statistical tool in marketing filed.
4.1 Manipulation check
The reliability of the recovery speed was 0.758 (Table 3). There were 120 participants in the immediate recovery group and 120 participants in the delayed recovery group. An Independent-Sample T Test was conducted to investigate the difference of recovery speed between the two groups. The results are shown in Table 4. There was significant difference between immediate group and delayed group (p<0.01), and thus the manipulation check of recovery speed was successful.
Table 3. Reliability Statistics of Recovery Speed Cronbach's Alpha N of Items
Table 4. Manipulation Check of Recovery Speed Recovery Speed N Mean Std. Deviation T Sig. (2-tailed) Immediate 120 5.3875 .96463 Delay 120 3.9917 1.3642 9.151 .000
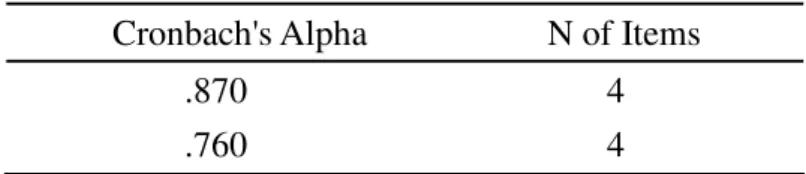
The reliabilities of the explanation were 0.87 and 0.76 (Table 5). As manipulation of
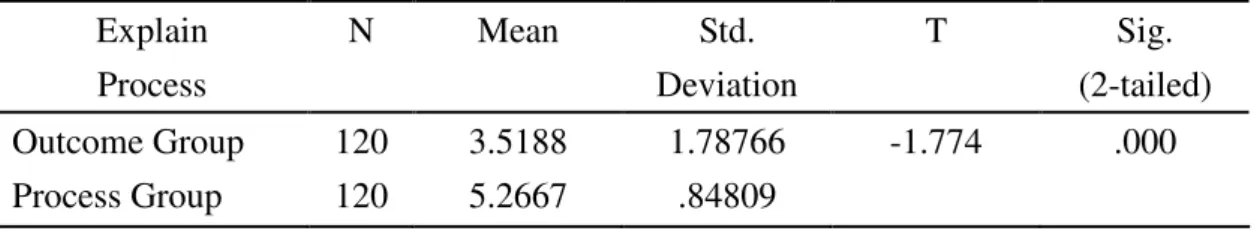
recovery speed, there were two groups with different explanations. The explanations were either focus on the outcome of service recovery or on the process of service recovery. There were 120 participants in each group. Eight items were used to ask participants whether the explanations were focused on the outcome or on process. Half of eight items were aimed at the outcome, and others were aimed at the process. Table 6 and Table 7 show the results and there was significant difference between outcome group and process group (p<0.01). Thus all of the manipulations were successful.
Table 5. Reliability Statistics of Types of Explanation Cronbach's Alpha N of Items
.870 4 .760 4
Table 6. Manipulation Check of Types of Explanation (Outcome) Explain Process N Mean Std. Deviation T Sig. (2-tailed) Outcome Group Process Group 120 120 4.8375 3.2146 1.18315 1.07115 11.139 .000
Table 7. Manipulation Check of Types of Explanation (Process) Explain Process N Mean Std. Deviation T Sig. (2-tailed) Outcome Group Process Group 120 120 3.5188 5.2667 1.78766 .84809 -1.774 .000 4.2 Background of participants
From the total samples of 240 participants, 60% were students, 53.3% were female,
35% were under 20 years old and 51.3% were 21-35 years old. 85% of 240 participants had a college degree, and 44.2% had an income below NT10,000. The demographics of participants were showed as below (Table 8):
128 53.3 112 46.7 240 100.0 Female Male Total Gender Number of participants Percentage Category Age Under 20 84 35 21-25 73 30.4 26-35 50 20.9 36-45 15 6.3 Over46 18 7.4 Total 240 100 Education Degree Senior high 1 0.4 College 204 85 Graduate upward 35 14.6 Total 240 100 Occupation Student 144 60 Others 96 40 Total 240 100 Income Less than 10,000 106 44.2 10,000-29,999 64 26.7 30,000-49,999 44 18.3 50,000-79,999 14 5.9 More than 80,000 12 5 Total 240 100 Experience of taking Notebook to repair No Yes Total 157 65.4 83 34.6 240 100
4.3 Reliability of the results
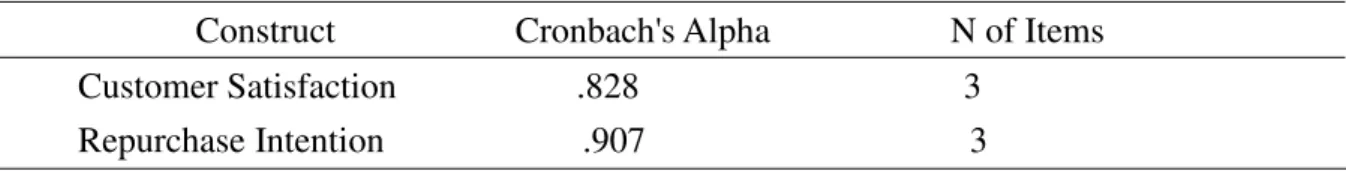
Two constructs, customer satisfaction and repurchase intention were examined here. The reliability of the data was tested with Cronbach’s alpha. In general, if Cronbach’s alpha is above 0.7, the study was accepted as reliable. Table 9 demonstrates the value of two constructs. The results of the reliability test indicate the survey were reliable.
Table 9. Reliability Analysis of Customer Satisfaction and Repurchase Intention Construct Cronbach's Alpha N of Items
Customer Satisfaction .828 3 Repurchase Intention .907 3
4.4 Analysis of Results
After assuring the manipulation, reliability of the analyzed data, MANOVA and ANOVA were carried out on the date.
4.4.1 The effects on customer satisfaction and repurchase intention
MANOVA was used to examine whether customer satisfaction and repurchase intention were different with distinct combinations of recovery speed and types of explanation. Hypotheses 1a and 2a suggested that customer satisfaction would be affected by distinct combinations of recovery speed and types of explanation, and Hypotheses 1b and 2b suggested that repurchase intention would be affected by distinct combinations of recovery speed and types of explanation.
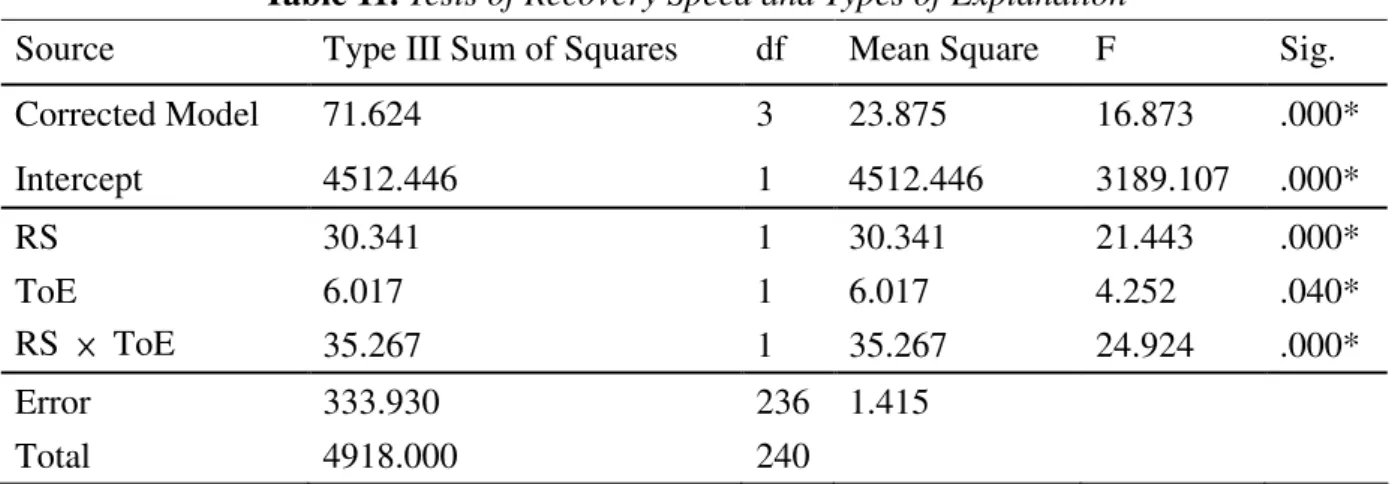
Table 10 shows that the interactions between two independent variables, recovery speed and types of explanation, was significant. Customer satisfaction and repurchase intention Table 11 and Table 12 show that recovery speed (RS) significantly affected customer satisfaction and repurchase intention (p<0.01). However, while the types of explanation (ToE) significantly affected customer satisfaction (p<0.05), it did not significantly affect repurchase intention (p>0.05). That was why two variables combined only had significantly interaction on customer satisfaction (p<0.01), not on repurchase intention. Table 11 and Table 12 show that hypotheses 1b and 2b were not supported. Two unsupported hypotheses were not examined any further.
Table 10. Overall MANOVA: Customer Satisfaction and Repurchase Intention
Effect Value F Hypothesis df Error df Sig.
Intercept .066 1675.664(a) 2.000 235.000 .000 RS ToE RS * ToE .895 .976 .875 13.845(a) 2.839(a) 16.744(a) 2.000 2.000 2.000 235.000 235.000 235.000 .000 .060 .000
Note: Recovery Speed (RS) Types of Explanation (ToE)
Table 11. Tests of Recovery Speed and Types of Explanation
Source Type III Sum of Squares df Mean Square F Sig.
Corrected Model 71.624 3 23.875 16.873 .000* Intercept 4512.446 1 4512.446 3189.107 .000* RS 30.341 1 30.341 21.443 .000* ToE 6.017 1 6.017 4.252 .040* RS × ToE 35.267 1 35.267 24.924 .000* Error 333.930 236 1.415 Total 4918.000 240
Dependent Variable: Customer Satisfaction
Note: Recovery Speed (RS) Types of Explanation (ToE
Table 12. Tests of Recovery Speed and Types of Explanation
Source Type III Sum of Squares df Mean Square F Sig.
Corrected Model 48.427 3 16.142 8.017 .000* Intercept 4114.056 1 4114.056 2043.248 .000* RS 47.112 1 47.112 23.398 .000* ToE .204 1 .204 .101 .750 RS × ToE 1.112 1 1.112 .552 .458 Error 475.183 236 2.013 Total 4637.667 240
Dependent Variable: Repurchase Intention
Note: Recovery Speed (RS) Types of Explanation (ToE)
Table 12 shows that recovery speed and types of explanation had significant interaction on customer satisfaction. One-way ANOVA with four levels was used to examine the interaction
service failure; customer satisfaction was higher if explanations focus on the outcome (scenario A) than on the process (scenario B), supporting Hypothesis 1a (p<0.05). It also confirms that when the attendants delayed recovery after a service failure, customer satisfaction was higher if explanations focused on the process (scenario D) rather than on the outcome (scenario C). Hypothesis 2a was thus also supported. Figure 4 clearly shows the interaction between the four kinds of combinations clear.
Table 13. Multiple Comparisons of Scenario Dependent Variable: Customer Satisfaction (LSD)
(I) Scenario (J) Scenario Mean Difference (I-J) Std. Error Sig.
A B .4500* .21718 .039 C 1.4778* .21718 .000 D .3944 .21718 .071 B A -.4500* .21718 .039 C 1.0278* .21718 .000 D -.0556 .21718 .798 C A -1.4778* .21718 .000 B -1.027* .21718 .000 D -1.0833* .21718 .000 D A -.3944 .21718 .071 B .0556 .21718 .798 C 1.0833* .21718 .000
Note: A (Immediate + Outcome); B (Immediate + Process) C (Delayed + Outcome) ; D (Delayed + Process) * The mean difference is significant at the .05 level.
Figure 4. The interaction between recovery speed and types of explanation
4.4.2 Appropriate explanations in different situations
The results presented in section 4.4.1 above shows if the attendants give a delayed recovery after a service failure, customer satisfaction was higher if explanations focused on the process rather than on the outcome. That meant giving the explanations focus on the process when recovery speed is delayed could improve customer satisfaction significantly. But by what extend can customer satisfaction be improved? Would it possible to reach the level for the situation where immediate recovery and explanations focus on outcome? Table 13 shows that customer satisfaction after a service failure will not differ significantly whether an immediate recovery combined with outcome-oriented is provided or a delayed recovery combined with
Outcome Process Types of Explanation 3.0 3.5 De Im C us tom er S at is fa ct ion 4.0 4.5 5.0 3.3 4.6 18 4.4 4.917 4.467 3.239 4.522
4.4.3 Genders differences
Hypothesis 4a was suggested that there were three-way interactions between participant
gender and the other two independent variables, recovery speed and types of explanations. Table 14 shows that there was no significant three-way interactions between recovery speed, types of explanation and genders (p>0.1), and hypothesis 4a was thus not supported. The results are summarized in Table 15.
Table 14. Tests of Recovery Speed, Types of Explanation and Gender
Source Type III Sum of Squares Df Mean Square F Sig.
Corrected Model 106.743(a) 7 15.249 11.839 0.000 Intercept RS ToE Gender2 4390.746 28.407 3.990 .189 1 1 1 1 4390.746 28.407 3.990 .189 3409.01 22.055 3.098 .147 .000 .000 .080 .702 RS × ToE RS × Gender ToE × Gender RS × ToE × Gender 35.709 .773 34.211 .015 1 1 1 1 35.709 .773 34.211 .015 27.725 .600 26.562 .012 .000* .439 .000 .913 Error Total 298.811 4918.000 232 240 1.288
Dependent Variable: Customer Satisfaction
Note: Recovery Speed (RS) Types of Explanation (ToE)
R Squared = .263 (Adjusted R Squared = .241) * P-value < 0.05
Table 15. Tests of Recovery Speed, Types of Explanation and Gender (Summarized)
Source Dependent Variable DF Mean
Square F Sig. 1 .773 .6 .439 1 34.211 26.526 .000 RS × Genders ToE × Genders RS × ToE ×Genders Customer satisfaction 1 .015 .012 .913
Note: Recovery Speed (RS) Types of Explanation (ToE)
Table 15 also shows that the interaction between the gender of the participants and types of explanations was significant (p<0.01). One-way ANOVA with four levels was used to examine hypothesis 4b. Result in Table 16 supported hypothesis 4b. When the type of explanation focused on outcome, then male (OM) participants were significantly more satisfied than female (OF) (p<0.05). When the type of explanation focused on process, female (PF) participants were more satisfied than male (PM) (p<0.05)
Table 16. Multiple Comparisons of Gender and Recovery Speed Dependent Variable: Customer Satisfaction (LSD)
(I) Gender (J) Gender Mean Difference (I-J) Std. Error Sig.
OF .7276* .22684 .002 PM .5094* .23571 .032 OM PF -.3051 .21832 .164 OM -.7276* .22684 .002 PM -.2182 .23752 .359 OF PF -1.0327* .22028 .000 OM -.5094* .23571 .032 OF .2182 .23752 .359 PM PF -.8144* .22940 .000 OM .3051 .21832 .164 OF 1.0327* .22028 .000 PF PM .8144* .22940 .000
Note: OM (Outcome + Male); OF (Outcome + Female) PM (Process + Male) ; PF (Process + Female) * The mean difference is significant at the .05 level.
CHAPTER 5 DISCUSSION AND FUTURE RESEARCH 5.1 Discussion
Table 17 summarizes the results of hypotheses. H1a, H2a, H3 and H4b were supported, and others were not supported. Details about each result of hypothesis were discussed as follows.
Table 17. Results of all hypotheses (summarized) H1a: Supported H1b: Not supported H2a: Supported H2b: Not supported
H3: Supported
H4a: Not supported H4b: Supported
5.1.1 Recovery speed, types of explanations and customer satisfaction
The results of the study indicate that when attendants provided recovery immediately after a service failure, customer satisfaction was higher if explanations focused on the outcome rather than on the process. On the other hand, if recovery was delayed rather than immediate, and if combined with explanations that focused on the process, higher customer satisfaction resulted. Customers liked to receive an explanation focused on the outcome of the recovery when the recovery was immediate. Focus on the outcome could make customers think more about the benefits they get from the recovery and it would make them more satisfied. However, when the recovery was delayed, customers wanted to receive an explanation focused on the process of the recovery. Customers needed an adequate explanation for why
recovery had gone wrong? A careful explanation of the process would make customers accept the delay more easily and consequently be more satisfied.
5.1.2 Recovery speed, types of explanations and repurchase intention
Two of the hypotheses about the repurchase intention were not supported by this study. Results showed that repurchase intention was affected by the recovery speed. The faster the recovery speeds, the higher the repurchase intention. But, types of explanation did not affect the repurchase intention. There was no significant interaction between recovery speed and types of explanation.
One of reasons why the repurchase intention unlike customer satisfaction, was not affected by the two independent variables was absence of compensation after service failure in any of the scenarios in this study. Other research has shown that compensation level was an important variable which might significantly effect repurchase intention of customers after service failures. Without compensation customers might avoid going the same repair station again, even though they accepted the explanations from the attendants and were satisfied with the end result at the time.
5.1.3 Adequate explanations
In general, compared to a delayed recovery, an immediate recovery usually resulted in higher customer satisfaction. But results from this study indicated that customer satisfaction was not differ significantly whether an immediate recovery combined with outcome-oriented is provided or a delayed recovery combined with process-oriented is provided. Immediate recoveries combined with explanations focused on outcome resulted in the highest customer satisfaction level. But, delayed recoveries combined with explanations focus on the process could result in a high level of customer satisfaction approaching the highest level.
5.1.4 Genders
Hypothesis 4a was not supported. Results showed there were no three-way interactions between recovery speeds, types of explanations and genders. When the types of explanation emphasized the outcome under immediate recovery circumstances, there were no significant effects on either male or female customers. Similarly, if the types of explanation emphasized the process under delayed recovery circumstances, there were no significant effects on customers of either gender. Both genders felt satisfied when the explanations were adequate to the recovery speed, and felt dissatisfied when the explanations were inadequate. There was no interaction between recovery speed and gender.
focused on outcome, then male customers were more satisfied; whereas, if it focused on process, female customers were more satisfied. This was in accorded with the prediction that male customers attach importance to the final products, while and female customers pay more attention to the process; women want to figure out how does the process of recovery run. When service failures happened, men usually looked at final results as more important than the process of handling that failure. If final results were pretty good, they would felt satisfied. Women, on the contrary, they usually wanted to know details about the handling process and then referred to final results and processes to decide satisfaction level.
5.2 Implications
This study indicated that service failure recoveries should be done as fast as possible after service failure. Immediate recovery speed usually resulted in higher customer satisfaction. Especially the immediate recoveries associated with explanations focused on outcome. In real life, a company’s reaction is sometime delayed, and then provides delayed recovery to customers. In this situation, attendants should give explanations focused on the process, carefully describing how the failure was settled and why the recovery was delayed. Companies thus have an opportunity to improve customer satisfaction to a higher level. Companies should give adequate explanations in order to improve the customer satisfaction under different situations. When recovery is immediate, a company should give an
explanation describing how excellent the final result is whereas, if recovery is delayed, a company should give an explanation describing how all the specifics are handled throughout the process.
The gender of customers is the other point that companies should keep an eye on. Male customers make the most of the final product in a service recovery. Companies should do their best to encourage male customers to believe that the final result is good enough. On the other hand, female customers attach great importance to process in service recovery, and prefer to be given details of the process. Companies should try to make female customers agree that all parts of the process are necessary and acceptable.
If companies could choose adequate explanations for different customers in different situations, customer satisfaction would be improved as much as companies’ wish. Companies could improve customer satisfaction after service failure by giving the right explanations to right customers at right time.
5.3 Limitations
The results of this study give researchers and managers some ideas about service recovery strategies, but still with certain limitations. First, 60 percent of the participants were students of NCTU and NTU. Their perception of crowding might not be the same as other consumers by different occupation. Sixty-five percent of participants were under 25 years old. Younger
customers have distinct experience and preference which differ from those of older customers. To make the research more general, the method of data collection could cover different age groups and occupation groups.
Second, to maximize the internal validity of this kind of research, designed scenarios rather than an actual experience of service failure were used in this study. Some participants might not experience analogous situations. Designed situations in scenarios could not cover all situations in real world, and the external validity might consequently be reduced. Results in this study could not be completely spread to other situation with different service failure, compensation level, and explanations. Furthermore, the scenarios were described in writing and not showed on video. Participants could not see the behaviors, manners and tones of attendants in the repair station. Such limitations might also influence the results.
Third, men and women would pay more attention on different types of explanation. However, each gender had other unique attributes might confound with measurement of customer satisfaction in this study. For example, different genders might own different amount of computer knowledge. Generally, male customers were expected to have more computer knowledge than female. Amount of computer knowledge might affect their customer satisfaction. Participants who own lots of computer knowledge could judge whether the explanations from attendants were reasonable or not, but participants who own little computer knowledge could not. Different genders have different levels of customer