針對WLAN與UMTS的新穎異質切換控制演算法
56
0
0
全文
(2) 針對 WLAN 與 UMTS 的新穎異質切換控制演算法 A Novel Vertical Handover Control Algorithm for WLAN and UMTS 研究生: 周建銘 指導教授: 黃經堯. Student: Chie Ming Chou Advisors: Ching Yao Huang 國 立 交 通 大 學 電 子 工 程 學 系 碩 士 論 文. A Thesis Submitted to Department of Electronics Engineering & Institute of Electronics College of Electrical Engineering and Computer Science National Chiao Tung University in partial Fulfillment of the Requirements for the Degree of Master of Science in Electronics Engineering. June 2005. HsinChu, Taiwan, Republic of China. 中華民國九十四年六月.
(3) 針對 WLAN 與 UMTS 的新穎異質切換控制演算法 研究生: 周建銘. 指導教授: 黃經堯 博士 國立交通大學 電子工程學系 電子研究所碩士班. 摘要 隨者各式無線通訊系統蓬勃的發展,如何運用一個有效率且流暢的切 換來整合各式各樣的通訊系統是一個被期望能達到高速傳輸、高流通性以 及高服務品質的方法。本論文主要針對無線區域網路(WLAN)以及廣域移動 通訊系統(UMTS)這兩系統提出一個新穎的異質切換演算法,在這個演算法 中,包含了(1)以傳輸速率為基準的對應函數來解決沒有共同指標來提供切 換判斷的窘境,(2)以服務品質(QoS)為依據的動態調整切換邊界來滿足各 式服務的需求,(3)以效能為主的觸發計時機制來避免乒乓效應的發生。為 了驗證這套控制方法,一個可提供分析的數學模組也在此論文提出並用來 分析切換控制下的各種系統表現,最後,數值分析的結果證明了這個新穎 的異質切換控制法確實能夠利用不同的系統特性去做切換的動作來達到不 同的服務需求,使得整合系統表現更佳。. 1.
(4) A Novel Vertical Handover Control Algorithm for WLAN and UMTS Student:. Chie Ming Chou. Advisor: Dr. ChingYao Huang. Department of Electronic Engineering & Institute of Electronics National Chiao Tung University. Abstract How to design an effective and smooth vertical handover algorithm is a trend for the integrated system to achieve the high-speed transmission, high mobility, and satisfied QoS. In this thesis, a novel vertical handover control algorithm, consisting of a throughput-based mapping function, QoS-based dynamic handover thresholds, and performance-based trigger timers, are proposed to resolve uncommon pilot problems, QoS requirements, and ping-pong effects, respectively. An analytic model based on a finite state machine is developed to evaluate the proposed algorithm in terms of the handover frequency and achievable throughput. A numerical analysis is also provided to further quantify the performance impacts. The analytic results show that the proposed algorithm could improve the transmission throughput for non-real-time services and can substantially reduce the packet loss rate for the real-time services by reducing the vertical handover frequency.. 2.
(5) 誌謝. 碩士班兩年的時光匆匆,似乎又到了離別的時刻。在這兩年短短的時間裡,除了有 修課的壓力外更要學習如何發現、了解、解決問題的能力以致有這篇論文的產生,感謝 老天在這兩年內,讓我如此幸運有你們陪伴者我,使我能夠順遂跟愉快的度過這人生中 最精華的時光。 首先,我要感謝黃經堯老師,在這兩年裡,隨者每個禮拜實驗室的研討會以及日常 的修課及討論,讓我學習到許多無線通訊相關的知識及背景,為我日後論文的完成紮下 深厚的根基。在我催生論文之時,老師也能像燈塔一樣,許多關鍵性的問題都能在跟老 師一次又一次的討論之後而得到了答案。最後感謝老師能在百忙之中抽空,給予我在研 究上以及寫作上的指導,我才能順利完成這篇論文。 另外要感謝的,就是在實驗室的日子裡,一起共同努力的學長及伙伴們,慧源、文 嶽、明原、振坤、宜霖、振哲、裕隆、彥翔、正達、雲懷、勇嵐、宜鍵、大瑜、鴻輝、 盟翔、昌叡、宗奇、域晨。除了在研究及學業上,有你們可以與我ㄧ起討論、聆聽我的 問題並提供我寶貴的意見,也因為有你們的陪伴,使我在研究的生活能夠多采多姿,這 份心中的感動,一定是我畢生難忘的回憶。 最後,我要感謝我的家人,爸爸、媽媽、妹妹。因為你們在背後的默默支持,使我 能夠無憂無慮的放手去完成我的學業,這一路走來,總是可以感受到來自於你們的關心 及祝福,不斷的支持並鼓勵我,讓我的心中充滿著被關懷的溫暖並使我能夠順順利利的 走過這兩年。 在此,謹以我的畢業論文獻給大家,希望你們能夠分享我的成果和喜悅,謝謝你們。. 周建銘. 謹誌. 2005 年 6 月,Wintech lab,交大,新竹,台灣. 3.
(6) Contents. Chapter 1 Introduction………………………………………………………………………....1 1.1 Overview of the Characteristics of Wireless Communication Systems……………....1 1.2 Motivation………………………………………………………………………….…2 1.3 Overview of UMTS…………………………………………………………………..4 1.4 Overview of WLAN………………………………………………………………….6 1.5 Thesis Organization…………………………………………………………………..9 Chapter 2 Architecture of an Integrated UMTS and WLAN System……………………...…10 2.1 Integrated Architecture……………………………………………………………....10 2.2 Overview of Vertical Handover……………………………………………………...11 2.3 Extra Features for the Vertical Handover………………….………………...............14 2.3.1 Compressed mode……………………………………………………………15 2.3.2 Scanning……………………………………………………………………...16 2.4 Prior works in Vertical Handover…………………………………………................16 Chapter 3 Dynamic Vertical Handover Control Algorithm…………………………………...18 3.1 Challenges…………………………………………………………………...............18 3.1.1 No Common Pilot between Networks…………………………… ................18 3.1.2 QoS requirements…………………………………………………………….18 3.1.3 Ping-Pong Effect………………………………………………………….….19 3.2 Throughput-Based Mapping Function……………………………………................19. 1.
(7) 3.2.1 Mapping Function from User Perspective…………………………………...20 3.2.2 The General Mapping Function from System Perspective…………………..21 3.3 QoS-Based Dynamic Handover Threshold……………………………………….…25 3.4 Performance-Based Trigger Timer…………………………………………………..28 3.4.1 Downlink Handover………………………………………………………….29 3.4.2 Uplink Handover……………………………………………………………..29 3.5 Summary of Proposed Vertical Handover Control Algorithm…………................…30 Chapter 4 Mathematical Model and Numerical Analysis………………………………….…33 4.1 Mathematical Model………………………………………………………………...33 4.2 Numerical Results and Analysis……………………………………………….……38 4.2.1 Non-real-time Services………………………………………………………39 4.2.2 Real-time Services………………………………………………………...…41 Chapter 5 Conclusions………………………………………………………………………..43 5.1 Contributions………………………………………………………………………...43 5.2 Future Works………………………………………………………………………...43 Reference……………………………………………………………………………………..45. 2.
(8) List of Figures Figure 1-1 Mobility vs Throughput for communication systems……………………….……..2 Figure 1-2 WLAN coupled at different levels (take UMTS as cellular systems)……….……..3 Figure 1-3 Simplified UMTS Network Reference Model………………….………………….6 Figure 1-4 MAC control in WLAN system……………………………………………………8. Figure 2-1 Integrated Architecture……………………………………………………………11 Figure 2-2 Important studies involved in the handover mechanism……………………….....12 Figure 2-3 Two-way handover in heterogeneous networks…………………………………..14 Figure 2-4 Extra feature of vertical handover………………………………………………...15. Figure 3-1 Throughput vs SNR in WLAN (including link adaptation)………………………21 Figure 3-2 The expression of successful transmission and collision time……………………23 Figure 3-3 The mapping flow………………………………………………………………...25 Figure 3-4 The packet loss for real-time services in handover……………………………….28 Figure 3-5 Trigger time functionality for downlink handover………………………………..30 Figure 3-6 The procedure of proposed vertical handover algorithm…………………………32. Figure 4-1 UMTS and WLAN location………………………………………………………34 Figure 4-2 Handover probability motion……………………………………………………..35 Figure 4-3 Finite state machines for handover process……………………………………….36 Figure 4-4 Throughput statistics for non-real-time services………………………………….40 Figure 4-5 Average state probabilities for different conditions……………………………….40 Figure 4-6 Performance comparisons for non-real-time services…………………………….41 Figure 4-7 Frame loss statistics (error-free channel) for real-time services………………….42 Figure 4-8 Performance comparisons for real time services………………………………….42. 3.
(9) List of Tables. Table 1-1 IEEE 802.11 family………………………………………………………………….7. Table 4-1 Parameters Used for Numerical Analysis………………………………………….38. 4.
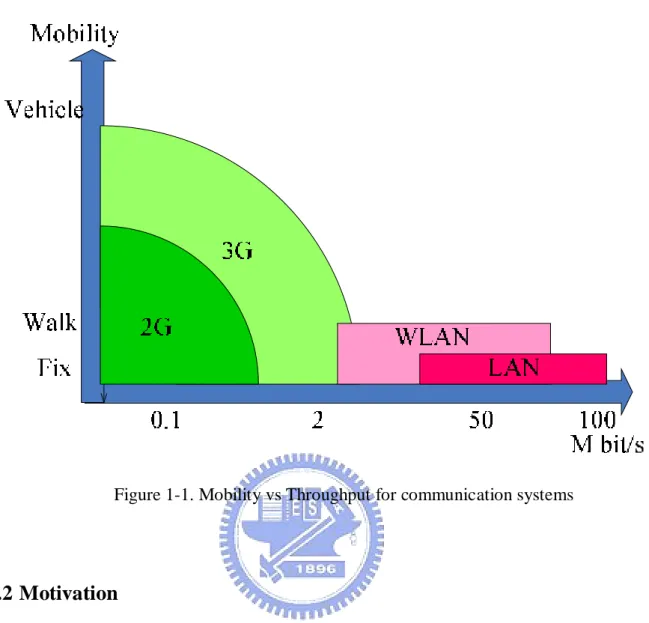
(10) Chapter 1. Introduction In this chapter, the motivation of the integrated systems is first given by observing the different characteristics of wireless communication systems. The designed method and related metrics for the integrated objectives are addressed, and the organization of this thesis is provided.. 1.1 Overview of the Characteristics of Wireless Communication Systems Different wireless technologies could be developed for different design goals and coverage. With different serving coverage and moving speeds, the achievable transmission rates and error performance will be different. Therefore, as shown in Figure1-1, there exists a trade-off between the mobility and the transmission rate in different wireless communication systems. As shown, the second generation (2G) and third generation (3G) cellular systems cover high mobility but with low transmission rates (up to 384kbps outdoor and 2.3 Mbps indoor). On the opposite, wireless local area network (WLAN) supports high transmission rates (up to 54Mbps) but covers only low mobility users. Besides, cellular systems have wider coverage as compared to WLAN systems. So, in an integrated cellular and WLAN system, to optimize the use of resources while managing the quality of service (QoS), it is essential to have a control that can effectively utilize both systems.. 1.
(11) Figure 1-1. Mobility vs Throughput for communication systems. 1.2 Motivation In Beyond Third Generation (B3G) communication systems, besides of anywhere, anytime, and any services, high transmission rate are also parts of the new vision for B3G. Third Generation Partnership Project (3GPP) has recently taken the initiative to develop a dual inter-working as a candidate to achieve this goal. As shown in Figure 1-1, it could be achieved by the integrated cellular and WLAN technologies. By switching between the two networks, users can have a wide-area-connectivity in cellular systems and high transmission rate in WLAN systems. Hence the motivation of this thesis is how to make a smooth and effective migration within the integrated system. The. European. Telecommunications. Standards. 2. Institute. (ETSI). suggests. two.
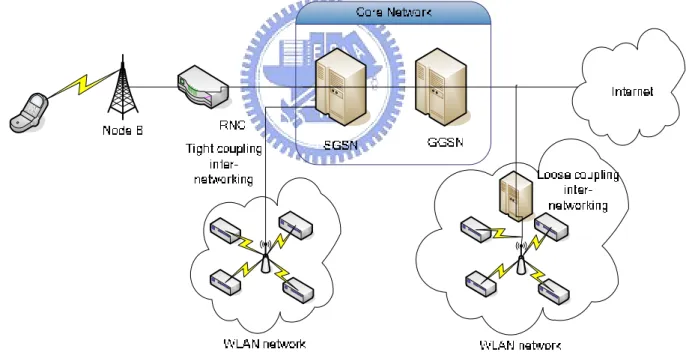
(12) inter-networking solutions: a loose coupling inter-networking and a tight coupling inter-networking [2]. In the loose coupling inter-networking, the WLAN network would be an access network that is complementary to the cellular data network. The WLAN network will not be connected directly to the core GPRS/UMTS (General Packet Radio Services/Universal Mobile Telecommunications System) network. Under this architecture, strict authentication, authorization, and accounting (AAA) within IP-layer are important to support the mobility. For the tight coupling inter-networking, the term ‘tight’ refers to the alignment of access interfaces between cellular and WLAN systems. In this architecture, all the WLAN traffic connects to the GPRS/UMTS core network as shown in Figure 1-2.. Figure 1-2 WLAN coupled at different levels (take UMTS as cellular systems). In this thesis, the tight coupling connection is considered as the solution for the integrated system of UMTS and WLAN. To make the integration effectively and smoothly, a vertical handover control between two networks is critical to ensure the quality of the. 3.
(13) connection. Before discussing the vertical handover and QoS controls, UMTS and WLAN systems will be introduced first.. 1.3 Overview of UMTS "Universal Mobile Telecommunications System" [5-7] (UMTS) stands for the third generation wireless cellular system to support both voice and data services. The UMTS was been promoted by European Telecommunication Standards Institute (ETSI) and is an extension of Group Special Mobile (GSM). Based on wideband code division multiple access (W-CDMA) techniques, the characteristics of UMTS are: l. Using Quadrature Phase-Shift-Keying (QPSK) modulation, multi-user detection, and etc to support high-speed data transmission (384 kbps with wide area coverage and up to 2.3 Mbps for indoor coverage).. l. Using variable spreading factor and multicode to support multiple parallel variable-rate services on each connection flexibly.. l. Enhanced radio resource control (RRC) improves the initial capacity and coverage. l. Easy implementation of dual-mode UMTS/GSM terminals as well as handover between UMTS and GSM is done by clear networking interface and architecture. Within the architecture of the radio interface protocols, UMTS is a three-layer system.. Layer one is responsible for transporting encoded and spreading chips over the air, besides; it offers a mapping between the physical layer and transport layer. Layer two contains two controls: one is the medium access control (MAC) which maps the logical channels to the. 4.
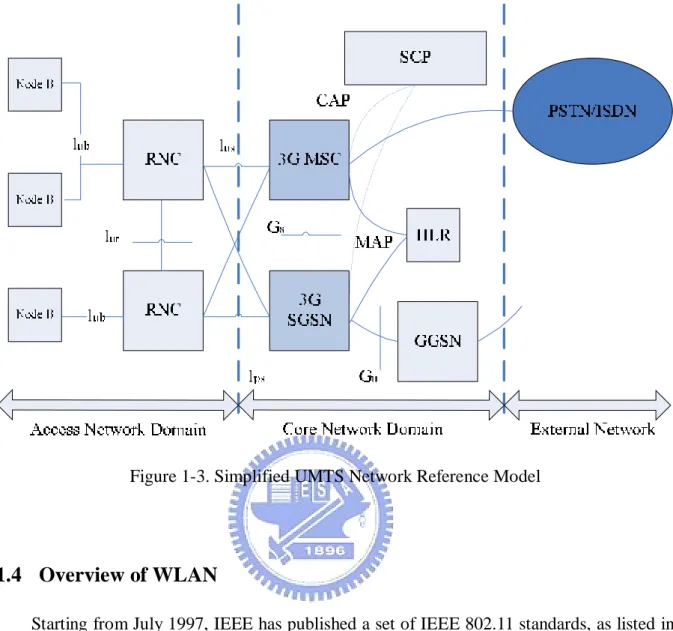
(14) transport channels; the other is the radio link control (RLC) which provides segmentation, reassembling, ciphering, and reliability over the radio link. Finally, Layer three controls the radio resources and requested Quality of Services (QoS). Due to the tight coupling connection will be the solution for the integrated system, the architecture of the radio protocol in UMTS will also be applied to the integrated system. As shown in Figure 1-3, UMTS network can be divided into the access network, core network, and external networks each with several network units and interfaces [8]. In access network, Radio Network Controller (RNC) and its associated Node-B are responsible for the resource managements which include the power control, handover, and RF measurements. The core network supports various network features and telecommunication services between access network and external network. Furthermore, the core network could be divided into two entities which individually provide circuited-switch (CS) network and packet-switch (PS) network. The CS domain contains the 3G mobile switching center (3G-MSC) and related service control point (SCP) to support an intelligent network system. The PS domain comprises the functional entities: 3G serving GPRS support node (3G-SGSN), and gateway GPRS support node (GGSN) to support packet data network. Finally, the home location register (HLR) is a database to support subscriber profile and mobile-IP services. For interfaces, it could be seen that each entity has respective interface to connect with related entities. Such as lub is the RNC to Node-B interface, lur is the RNC to RNC interface, lus is the interface for circuit-switched data, lps is the interface for packet-switched data and Gs, Gn, CAP (CAMEL application part), MAP (mobile application part) are the mapping interfaces in the core network.. 5.
(15) Figure 1-3. Simplified UMTS Network Reference Model. 1.4 Overview of WLAN Starting from July 1997, IEEE has published a set of IEEE 802.11 standards, as listed in Table 1-1, for Wireless Local Area Networks [9-12]. In general, the standardization of WLAN is divided by three layers: Physical (PHY), Medium Access Control (MAC) and Logical Link Protocol. In physical layer, Orthogonal Frequency Division Multiplexing (OFDM) which is a robust multi-carrier modulation is used. OFDM works by splitting the radio signal into multiple smaller sub-signals that are then transmitted simultaneously at different frequencies to the receiver. Thus, OFDM reduces the amount of crosstalk in signal transmissions and enhance the throughput performance. For WLAN, the standard provides two modes of operation in MAC layer: Distributed. 6.
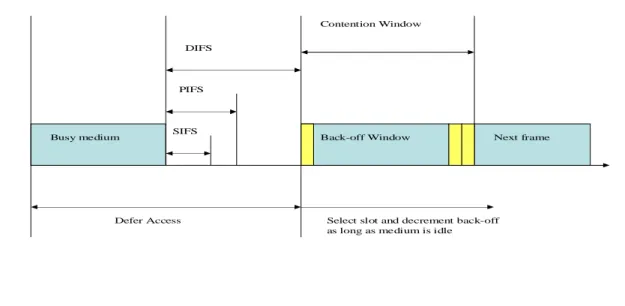
(16) Coordination Function (DCF) and Point Coordination Function (PCF). DCF is a contention mode which is based on Carrier Sense Multiple Access with Collision Avoidance (CSMA/CA). A random backoff contention window, as shown in Figure 1-4, is designed to resolve the collision and the ownership of the medium. When a backoff window reaches to zero, the associated station will get the medium. At the same time other stations will hold their window size and wait for the next idle period. Basically, under this mode, the QoS is not guaranteed, thus only non-real-time services (flows) are suitable in the contention mode. On the other hand, PCF is a contention-free mode; here a point coordinator that resides in Access Point (AP) is responsible for polling or scheduling based on the delay requirements. However, due to the unpredictable beacon delay, PCF has limitations in QoS support and this mode is also not widely implemented. Table 1-1 IEEE 802.11 family Name. Work. IEEE 802.11a. PHY Standard : 5GHz. IEEE 802.11b. PHY Standard : 2.4GHz. IEEE 802.11c. Bridging. IEEE 802.11d. MAC Standard : international roaming. IEEE 802.11e. MAC Standard : QoS support. IEEE 802.11f. Inter-Access Point Protocol. IEEE 802.11g. PHY Standard: 2.4GHz. IEEE 802.11h. Supplementary MAC Standard: TPC and DFS. IEEE 802.11i. Supplementary MAC Standard: Alternative WEP. IEEE 802.11j. Japan 5GHz band extension. IEEE 802.11k. Radio Resource Measurement. IEEE 802.11n. Higher throughput improvement. 7.
(17) Contention Window DIFS. PIFS. Busy medium. SIFS. Back-off Window. Defer Access. Next frame. Select slot and decrement back-off as long as medium is idle. Figure 1-4. MAC control in WLAN system. Furthermore, according to IEEE 802.11 MAC, different interframe spaces (IFS) are defined to provide priority levels. A Short interframe space (SIFS) is the minimum time-gap between any two frames. A DCF interframe space (DIFS) is the relevant IFS when applied to DCF stations. Thus a frame sequence by any DCF station must begin at least a DIFS interval after any other frame sequence. Similarly, a PCF interframe space (PIFS) is the least spacing for stations implementing the PCF. Clearly, it would be desirable to have SIFS<PIFS<DIFS to ensure the PCF has higher priority than DCF. Finally, an optional scheme called RTS/CTS (Request to Send/Clear to send) is used to solve the hidden terminal problem in WLAN networks.. 8.
(18) 1.5 Thesis Organization The organization of this thesis is described as follows: Chapter 2 introduces the architecture of an integrated UMTS and WLAN system. Under this architecture, a general concept of vertical handover is given. The extra features needed for the handover including the measurement, scanning, and etc are stated. Some prior works on the vertical handover studies are also introduced in this chapter. In chapter 3, to effectively resolve the vertical handover problem, a novel vertical handover algorithm which contains the throughput-based mapping function, QoS-based dynamic handover threshold, and performance-based trigger timer is proposed. Chapter 4 provides an analytical model which will be used to evaluate the handover performance. Simulation results and discussions are also provided in this chapter. In Chapter 5, conclusions and future works are discussed.. 9.
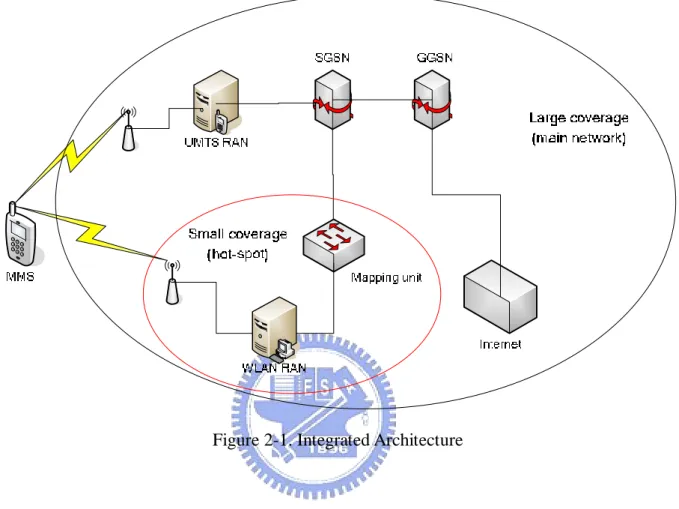
(19) Chapter 2. Architecture of an integrated UMTS and WLAN systems This chapter introduces the architecture of an integrated system. Under this architecture, besides of conventional radio resource controls, the vertical handovers: (1) from UMTS-to-WLAN handover and (2) from WLAN-to-UMTS handover are new and essential for the integrated systems.. 2.1 Integrated Architecture As compared to WLAN, UMTS supports high-mobility users and can cover large coverage areas. On the other hand, WLAN achieves higher throughput for stationary users but its coverage is small. Therefore, in the integrated system, UMTS should be designed as the core network to cover all areas, while the WLAN will be deployed based on the hot-spot scenario [13]. In this case, WLAN can be treated as one of the radio access networks (RAN) to UMTS network, and it will be connected to the Internet cloud by the Gateway GPRS Support Node (GGSN) of UMTS. The only change for WLAN is that it must have a mapping unit to hide WLAN identity and to make Serving GPRS support Node (SGSN) transport. 10.
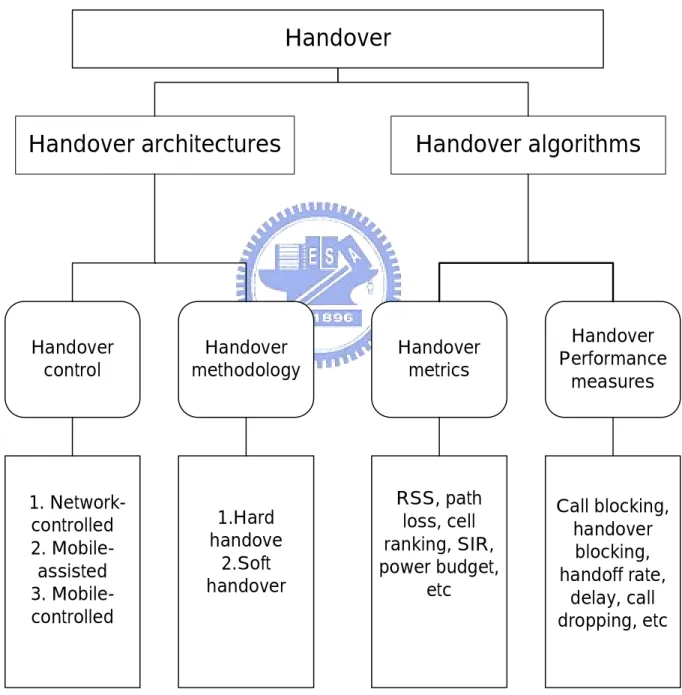
(20) signals available to WLAN. Finally, the mobile station will be a multi-mode station (MMS) which supports both UMTS and WLAN access within the architecture as shown in Figure 2-1.. Figure 2-1. Integrated Architecture. 2.2 Overview of Vertical Handover Handover is a fundamental feature in any wireless networks. When a mobile terminal moves away from a base station, the signal level will decrease and there is a need to switch to other base stations. The handover control is the procedure to handle the base station migration for the mobile. There are a lot of studies related to handover [14] and can be divided into two categories: handover architecture and handover algorithms (see Figure 2-2). Architecture includes the methodologies, controls, and software/hardware elements involving in the re-routing of a connection. In handover methodologies, hard handover is limited by only one. 11.
(21) connected BS and the handover procedure is “break-before-make”. Due to the technology of CDMA, soft handover is proposed to allow multiple BS connections and the handover procedure becomes “make-before-break”. The soft handover will take the benefit of the diversity technique and will enhance the transmission performance.. Handover. Handover architectures. Handover algorithms. Handover control. Handover methodology. Handover metrics. 1. Networkcontrolled 2. Mobileassisted 3. Mobilecontrolled. 1.Hard handove 2.Soft handover. RSS, path loss, cell ranking, SIR, power budget, etc. Handover Performance measures. Call blocking, handover blocking, handoff rate, delay, call dropping, etc. Figure 2-2. Important studies involved in the handover mechanism. 12.
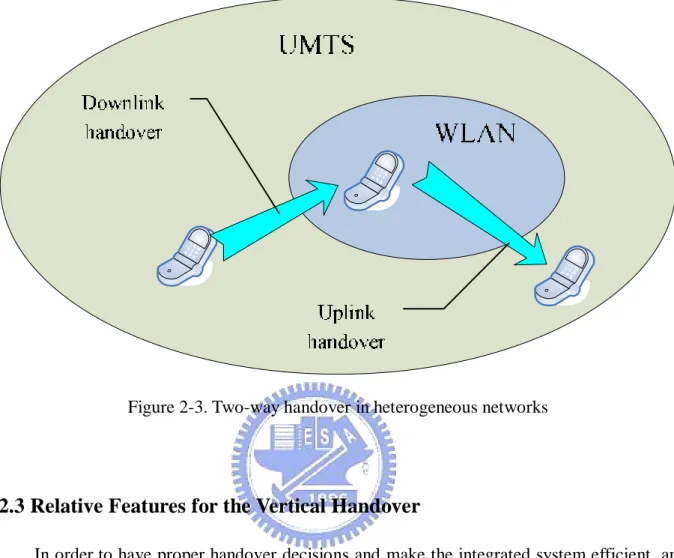
(22) For handover controls, the trigger decision in network-controlled handover is decided by base station (BS) only, on the contrary, a mobile station (MS) dominates the decision in mobile-controlled handover. However, the common solution in handover control is mobile-assisted handover. This is because to make a precise decision, both the BS and MS should be responsible for the handover decision. Issues related to the handover algorithms are the triggering metrics used by the algorithm. The common metrics include the received signal strength (RSS), signal-to-noise ratio (SIR), power budget, and etc. Different measurements will affect the handover decision and cause different handover performance. The handover performance usually includes the handover frequency, handover blocking rate, and handover delay. Different services might have different requirements in handover performance, so a service-based handover control algorithm is important in handover designs. The conventional handover used to switch between homogeneous networks is called the horizontal handover. In the heterogeneous networks, the handover for switching from one system to another system is called the vertical handover. Due to different systems have different characteristics; the vertical handover could be asymmetrical. In our scenario, as shown in Figure 2-3, the handover from UMTS to WLAN systems is called the downlink handover and the handover from WLAN to UMTS systems is called the uplink handover. The objectives of the downlink and uplink vertical handovers are different. The downlink handover is focusing on improving transmission rates while the uplink handover is focusing on the connectivity of the call. Besides of the above, like the conventional handover problem, the vertical handover also needs to prevent the traditional ping-pong effect between two. 13.
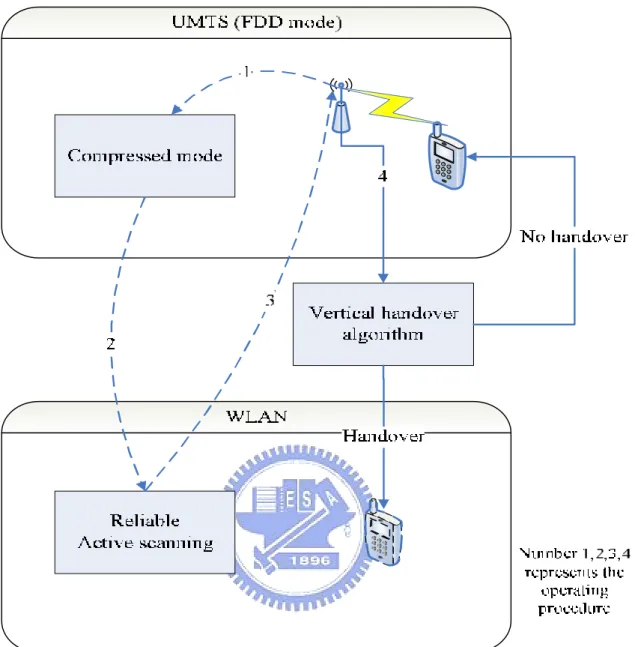
(23) networks.. Figure 2-3. Two-way handover in heterogeneous networks. 2.3 Relative Features for the Vertical Handover In order to have proper handover decisions and make the integrated system efficient, an accurate reference measurement is required for designing a proper vertical handover control. However, when UMTS operates in a frequency division duplex (FDD) mode, the transmission is continuous and there is no available gap time for measuring WLAN systems to get the sufficient information. Besides, even if the measurement of WLAN systems is possible, how to obtain the reliable information in time is also a challenge. Therefore as depicted in Figure 2-4, a compressed mode in UMTS system and a reliable active scanning (RAS) scheme in WLAN system provide the first level RF measurements for the vertical handover trigger.. 14.
(24) Figure 2-4 Extra feature of vertical handover 2.3.1 Compressed mode The compressed mode [15, 16] is employed to create a transmission gap in FDD mode for measuring the RF from other systems. By compressing the data stream during a few slots, a gap is created for measuring without having the disconnection of the UMTS call. The policies of the compressed mode and related power controls have been defined in UMTS specification [17-20]. During the compressed frame, more power is required to guarantee the quality of increasing transmission rate. Therefore, there exists a trade-off between handover. 15.
(25) performance (sufficient information) and power consumptions. Several investigations are proposed [21-23]. In this vertical handover design, reducing the spread factor is used to simplify the operating environment and to provide a measured period for WLAN system. 2.3.2 Scanning After getting the idle period in UMTS system, how to use this period to scan and to get sufficient information in WLAN systems is a challenge. According to the IEEE 802.11 standard, the scanning can be accomplished by using either a passive or active mode [24]. In the passive scanning mode, the mobile station (MS) moves to each channel on the channel list and waits for the beacon signal. In this mode, it could save the battery power but will take longer time to finish the measurements. In the active mode, a MS actively broadcasts additional probing request frames on the channel and expects to receive the response from the access point (AP), as a result, the active scanning mode is a fast way to collect the information and to reduce the time delay for handover. However, the efficiency of active scanning strongly depends on the whether the AP can successfully receive the request or not. A reliable active scanning (RAS) [25] which has a response detection and retransmission scheme is proposed. Therefore, the RAS scheme will be assumed in this vertical handover designs.. 2.4 Prior Works in Vertical Handover Several aspects of vertical handover algorithms have been investigated. First, Stemm and Katz [26] introduced the vertical handover between different networks. A combination of mobility management and a virtual connectivity manager was used to maintain the connection. 16.
(26) in the integrated system [27]. A policy-based handover algorithm was proposed by considering the tradeoff between network performance and individual requirements [28]. Another handover control mechanism which adopts the concept of a dwell timer was implemented to ensure the stability of the handover and the improvement of the mean throughput [29]. From network layers, based on Mobile IP [30], new protocols like Session Initiation Protocol (SIP) and Stream Control Transmission Protocol (SCTP) have been proposed to improve the delay and throughput performance between any heterogeneous wireless networks [31]. In this thesis, to address different service needs for both real-time and non-real-time services, a novel vertical handover control algorithm based on effective signal-to-noise (SNR) values and quality of service (QoS) requirements will be proposed.. 17.
(27) Chapter 3. Dynamic Vertical Handover Control Algorithm. In the heterogeneous network, there are three design challenges: (1) no common pilot between networks (2) various QoS requirements and (3) ping-pong effects. To effectively support the vertical handover, three corresponding control elements are designed in the proposed vertical handover control algorithm: throughput-based mapping function, QoS-based dynamic handover threshold, and performance-based trigger timer. In this chapter, all challenges will be discussed in detail and the corresponding solutions will be proposed and analyzed.. 3.1 Challenges 3.1.1 No common pilot between networks In UMTS, a pilot channel is used as an indication for triggering a handover and power control [32]. More advanced handover controls based on aggregate pilot Ec/Io, average pilot Ec/Io, and etc for handover decisions are investigated [33-35]. However, in the integrated system, the handover trigger in the WLAN will be different than the trigger in the UMTS. As compared to the pilot channel in UMTS, a beacon signal is used in the WLAN. The signal-to-noise ratio (SNR) has different indication of the achievable transmission rate and the coverage. Therefore, the decision of the vertical handover trigger becomes difficult. 3.1.2 QoS requirements. 18.
(28) Quality of Services (QoS) has become an important requirement in wireless systems. The ultimate goal of QoS is to support “sufficient quality” for all services. Different services might have different definitions of “sufficient quality”. For example, in the non-real-time services, the QoS could depend on the transmission rate. On the other hand, in the real-time services, the QoS means the delay bound and a smooth video playout. In the wireless system, due to the time varying channel and competing resources, it could be more challenge to maintain QoS among users. Due to different system characteristics, the effort of maintaining the QoS in various systems becomes even harder when the integrated wireless system is considered. 3.1.3 Ping-pong effect In a conventional handover, the ping-pong effect happens when the connection channel is not stable. In the unstable channel, any trigger of handover does not guarantee the improvement of the connection quality. In the integrated system, the ping-pong effect also exists in the vertical handover. This is due to the extended delay in handing over between two different systems as compared to two base stations within the same system. Therefore how to avoid the occurrence of ping-pong effect is also an important challenge in the integrated systems.. 3.2 Throughput-Based Mapping Function In the UMTS-WLAN integrated system, there is no common pilot to be used as an indication for the vertical handover trigger. Thus, a common reference should be defined to. 19.
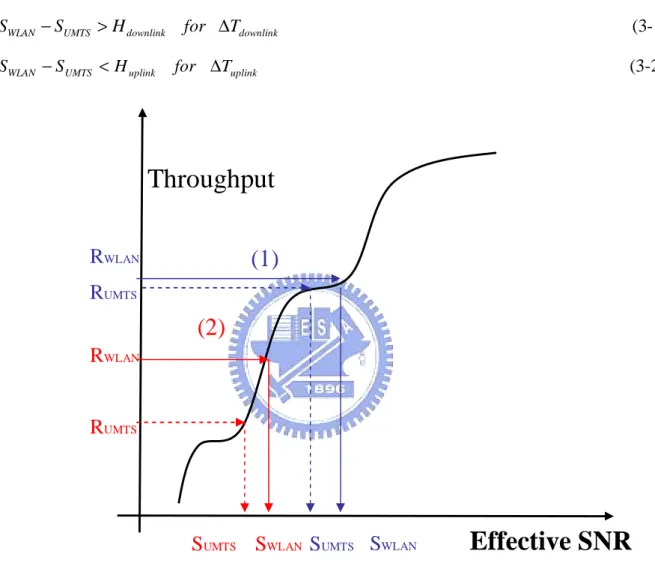
(29) differentiate the achievable performance. The performance in WLAN system could be observed from two perspectives: one is from user perspective and the other is from system perspective. In this section, the throughput-based mapping function from user perspective is first proposed, and then the general form of the mapping function is discussed by observing the performance from the system perspective. 3.2.1 Mapping function from user perspective In different networks, the same signal-to-noise ratio (SNR) might have different throughput performances. Therefore a direct comparison of the SNR values will cause a misinterpretation of the resulting performance. To resolve the problem, an effective SNR, based on the same throughput reference, could be used. For example, as shown in Figure 3-1, based on a WLAN performance curve, a mapping between the achievable rates from UMTS and WLAN, RUMTS and RWLAN, and the corresponding effective SNR values, SUMTS and SWLAN can be identified. In short, the original SNR is first used to estimate the achievable throughput which depends on the RF condition only. Through the mapping module, the corresponding effective SNR, SWLAN and SUMTS, are calculated based on a WLAN throughput performance curve. A dynamic vertical handover control algorithm can then be derived based on the effective SNR. Basically, the vertical handover is triggered when the differences between the SWLAN and SUMTS values exceed or drop below a dynamic threshold, H, for a period of time. As stated in Eq. (3-1), the downlink handover from UMTS to WLAN is triggered when the effective SNR from WLAN is greater than that of the UMTS by H for ∆Tdownlink seconds. From Eq. (3-2), for the WLAN to UMTS handover, the uplink handover is triggered when the. 20.
(30) effective SNR from the UMTS is greater than that from the WLAN by H for ∆Tuplink seconds, where the threshold H and the trigger timer ∆Tdownlink / uplink could be a function of QoS requirements and would be addressed in later section.. SWLAN − SUMTS > H downlink SWLAN − S UMTS < H uplink. for ∆Tdownlink. (3-1). for ∆Tuplink. (3-2). Throughput RWLAN. (1). RUMTS. (2) RWLAN. RUMTS. SUMTS SWLAN SUMTS SWLAN. Effective SNR. Figure 3-1. Throughput vs SNR in WLAN (including link adaptation). 3.2.2 The General form of the mapping function from system perspective The throughput performance used in the section 3.2.1 is estimated by the individual measurements of signal strength (RF only). However the actual throughput differs a lot, especially in WLAN system. This is because the medium in WLAN is shared by many users;. 21.
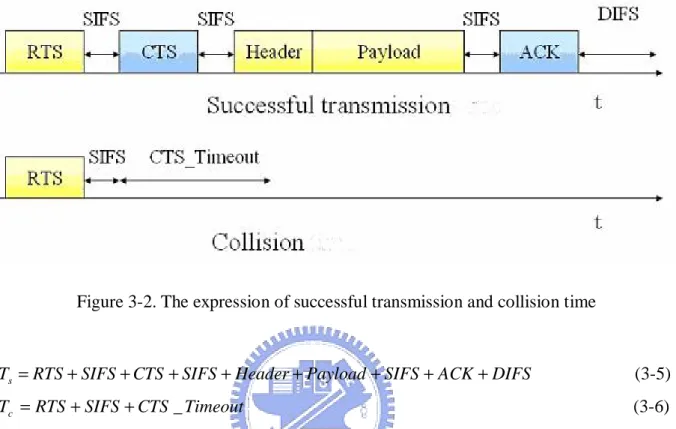
(31) collision and simultaneous backoff stages will occupy the medium and reduce the effective throughput. Furthermore, the throughput in WLAN will be saturated when the loading is high. Thus, call admission control in WLAN is crucial to maintain the throughput and other QoS performances. In this section, the effect throughput, RE, calculating from the system perspective is used as the general form of the mapping function. In calculating effective throughput from the system perspective, it takes the transmission ratio and call admission control into considerations, the relationship between R and RE is:. RE = Pt × Pa × R. (3-3). Here Pt is the transmission probability which stands for the ratio of the actual transmission time and the total beacon frame. Pa is the allowable incoming probability which depends on the call admission control to a new incoming user. R is the estimated throughput from RF measurements only. In one beacon frame, it could be divided into the idle period, collision period (wait the back-off windows for all admitted flows), and transmission period (only one user uses the medium). Therefore the transmission probability Pt can be calculated in Eq (3-4). Pt =. Ps × Ts E[ I ] + Ps × Ts + Pc × Tc. (3-4). Where Ps is the successful transmission probability with associated successful transmission time Ts, Pc is the collision probability with collision time Tc and E[I] is the average idle period.. 22.
(32) The expressions of Ts and Tc in Eq. (3-5) and (3-6) are according to the Figure 3-2 diagram which applied the DCF scheme and RTS/CTS mechanism.. Figure 3-2. The expression of successful transmission and collision time. Ts = RTS + SIFS + CTS + SIFS + Header + Payload + SIFS + ACK + DIFS. (3-5). Tc = RTS + SIFS + CTS _ Timeout. (3-6). The remained work is to get the probabilities for all periods. Here a three dimension Markov-chain model [36-38] based on the number of users, the back-off window stages and process time is used to calculate the probabilities. Finally, substituting all parameters into Eq (3-4), the transmission ratio probability Pt can be calculated. For the allowable incoming probability, Pa, it depends on the call admission control (CAC) in WLAN system. The main objective of CAC is to prevent channel overload and protect existing users. Therefore the allowable incoming probability, Pa, would be a conditional probability which depends on the new collision rate and the limits set for all existing users. If the new incoming user will cause the average collision rate exceed a. 23.
(33) threshold, then CAC will block the incoming flow. To trace the new collision rate, a counter in Eq. (3-7) which uses the weighted average is simplified to calculate the collision rate during every period.. C R , new average = (1 − α ) × C R ,inco min g + α × C R , previous average. where CR,new. average. (3-7). is the average collision rate after admitting the new incoming user,. CR,incoming is the collision rate for the incoming user, CR,previous average is the average collision rate before admitting the new incoming user and α is the weighted factor which is designed by users’ experience (usually be 0.8). With this counter, the allowable incoming probability Pa could be expressed as:. n +1. Pa = ∏ P{C R, new average ≤ η i | C R ,inco min g }. (3-8). i −1. Here assumes there are n independent users in WLAN systems and η i is the limiting collision rate for each user i. This conditional probability shows when the incoming user won’t cause the average collision rates set for all users, the new incoming user will be admitted to WLAN systems. After getting the probabilities Pa and Pt, the effective throughput for WLAN system could be calculated ( RE = Pt × Pa × R ). It can be expected that the effective SNR of WLAN would be smaller than using the effective throughput as a basis. As a result, with CAC implemented in WLAN, the user will be harder to handover to WLAN system. The total. 24.
(34) mapping flow is shown in Figure 3-3.. Figure 3-3. The mapping flow. 3.3 QoS-Based Dynamic Handover Threshold To reflect the benefit of the vertical handover in various aspects, besides the effective SNR values, the algorithm needs to consider dynamic thresholds and the associated timers to achieve the QoS requirements. In the proposed vertical handover algorithm, the dynamic threshold, H, will depend on service types of either non-real time services or real-time. 25.
(35) services. For non-real-time services, the transmission packets come at a burst and are not sensitive to the delay. In this case, the user transmission rate becomes the first priority for the vertical handover. On the other hand, for real-time services, the services have a stringent requirement in the delay bound. Besides, for WLAN-to-UMTS uplink handover, since WLAN has a smaller coverage, the connectivity becomes essential in the uplink handover. To achieve above design goals, the dynamic threshold is proposed as:. H = α − m× (. RE WLAN RE UMTS. )dB + n × βi + k × (. ∆ + ∆Tuplink ∆. )dB. (3-9). where α and β i are weighted factors to decide the significance of the associated measurements. RE. WLAN. and RE. UMTS. are the supported data rates from WLAN and UMTS. respectively. ∆ is the handover latency (the process delay for a vertical handover). The m, n, and k are values of 0 or 1 which will be decided based on following conditions:. 1, for non − real time services m= 0, otherwise ∆− Di > Bi 1, for real−time services and Ti n = 0, otherwise . (3-10). 1, for uplink handover k= 0, otherwise where D i is the packet delay bound for application i, Ti is the packet inter-arrival time for application i, and B i is the maximum allowable burst errors (lost packets) within a time of interest.. 26.
(36) Under this design, for non-real-time services, the throughput ratio provides additional weight on the threshold, H, calculations. This is because the effective SNR in some cases can’t accurately represent the absolutely throughput difference between UMTS and WLAN. See Figure 3-1, the difference of the effective SNR between UMTS and WLAN represented in blue lines (1) is the same as the red lines (2), but the difference of throughput in red lines is much larger than blue lines’. The reason is that WLAN throughput may reach the saturation point no matter how larger SNR is. So the weighted factor for non-real time services is needed. The dynamic threshold decreases when the throughput ratio of WLAN and UMTS becomes larger. This will make the UMTS-to-WLAN handover easier. Thus, a mobile with non-real-time services can achieve higher throughput. For real-time services, besides the over-air-error, the packet loss happens when the delay bound expires, the excessive handover delay, ∆ − Di , will also cause the loss packets in the real-time services. With the allowable number of lost packets Bi for application i, the number of lost packets due to the vertical handover, (∆ − Di ) Ti (see Figure 3-4) should be less than Bi. If the resulting error performance exceeds Bi, the effect of the degradation will be considered in the dynamic threshold, H. To emphasize the connection quality, the weighted factor, β i , as expressed in Eq (3-9) is increased proportionally to the increase of the packet loss.. ∆ − Di Ti βi ∝ Bi . dB. (3-11). 27.
(37) Figure 3-4. The packet loss for real-time services in handover. Finally, a timer hysteresis, ∆Tuplink , is considered to avoid the ping-pong effect in the conventional handover control. However since the coverage in WLAN is small, any excessive delay might result in the discontinuity of the connection. To resolve this potential problem, the dynamic threshold, H, will include (∆ + ∆Tuplink ) ∆ for an earlier uplink handover trigger if the time hysteresis ∆Tuplink is larger. It can be seen that when the time hysteresis is larger, the dynamic handover threshold, H, would be larger. The result forces the early trigger for WLAN-to-UMTS handover, as show in Eq. (3-2).. 3.4 Performance-Based Trigger Timer In conventional handover algorithm, the objective of the trigger timer is to resolve the ping-pong effect [39, 40]. To calculate a proper trigger timer, a performance-based trigger timer, which the length of the trigger timer depends on whether the resulting performance can be improved after the handover, is calculated.. 28.
(38) 3.4.1 Downlink handover To determine the vertical handover trigger timer, as shown in Figure 3-5, the following equation is used:. ∆ + 2 ∆T. ∫ RE. WLAN (t ) dt >. ∆ + ∆T. 2 ∆ + 2 ∆T. ∫R. E UMTS. (3-12). (t )dt. ∆T. From Eq. (3-12), the handover from UMTS to WLAN is worthwhile only when the user can transmit more data in WLAN than that in the UMTS after the handover process is finished. To calculate the downlink handover timer, ∆Tdownlink , it is assumed that the RE WLAN and RE UMTS are stable during this handover period. In this case, the timer ∆Tdownlink is calculated from Eq. (3-13):. ∆Tdownlink ≥. RE WLAN 2∆ , r= r −1 RE UMTS. (3-13). 3.4.2 Uplink handover The same argument can apply to the uplink handover timer calculation. The uplink handover is worthwhile when Eq. (3-14) is satisfied:. ∆+2 ∆T. ∫ RE UMTS(t)dt >. ∆+∆T. 2∆+2∆T. ∫R. E WLAN. (t )dt. (3-14). ∆T. The uplink handover timer, ∆Tuplink , is calculated by Eq. (3-15).. 29.
(39) ∆Tuplink ≥. RE WLAN 2∆ , r= 1 RE UMTS 1− r. (3-15). The handover timers are not fixed and will be updated based on the value r from time to time.. Throughput. handover No handover Ping pong effect. RWLAN. (compare throughput performance). RUMTS 0 ∆T. ∆. ∆T. ∆. Time. Figure 3-5. Trigger time functionality for downlink handover. 3.5 Summary of Proposed Vertical Handover Control Algorithm The proposed vertical handover control algorithm is composed by throughput-based mapping function, QoS-based dynamic handover threshold, and performance-based trigger timer. The procedures of the vertical handover control algorithm depicted in Figure 3-6: 1.. Measures the signal strength and calculates the effective throughput from system perspective.. 30.
(40) 2.. Uses the mapping function to get the effective SNR.. 3.. Applies different services with different QoS requirements to set the dynamic handover threshold and trigger timer for downlink and uplink handover.. 4.. Finally, trigger equations in Eq (3-1), (3-2) is used to make decision about the handover.. 31.
(41) Measurement SNR. Estimation (user perspective) R. Calculation (system perspective) services. RE. Trigger timer setting. Mapping. Threshold setting. ∆Tuplink, ∆Tdownlink. SW, SU. H. Sw - Su > H for ∆Tdownlink Sw–Su < H for ∆Tuplink. Yes, Handover. No, stay Figure 3-6. The procedure of proposed vertical handover algorithm. 32.
(42) Chapter 4. Mathematical Model and Numerical Analysis. In this chapter, a mathematical model is created to analyze the handover performance. Simulation results and the analysis for the proposed vertical handover algorithm are also given. 4.1 Mathematical Model In this section, the performance of the handover frequency and average throughput is analyzed and the impacts from the path loss and shadow fading are considered. The fast fading will be ignored due to the averaging of the measurements. As calculated in Eq. (4-1) and (4-2), the signals (in dB) received at MS from UMTS and WLAN, are U (k) and W (k), respectively.. U (k) = K1 − K2 log(dk ) + u(dk ). (4-1). W (k ) = K 3 − K 4 log(w(d k )) + v (w(d k )). (4-2). As shown in Figure 4-1, dk is the distance when the MS is d meters from UMTS at kth sample time and the function w (dk) calculates the distance from WLAN when the mobile is d meters. 33.
(43) from UMTS. K1, K2, K3, and K4 are parameters for the path loss. The shadow fading, u (dk) and v (dk) are assumed to be independent and identically distributed stationary Gaussian random processes with zero mean and variance, σ 2 .. Figure 4-1. UMTS and WLAN location. The received signal will be averaged by applying an exponential filter, implemented as a low-pass filter:. U (k ) = F (k ) ∗U (k ) =. 1 ∞ − x exp U (k − x)dx Tav Tav ∫0. (4-3). W (k ) = F(k ) *W (k ) =. 1 ∞ − x exp W (k − x)dx Tav ∫0 Tav . (4-4). where F (k ) =. 1 × exp( − k ) is the exponential filter, and Tav is the average interval. Tav Tav. After analyzing the signal-strength mode, as shown in Figure 4-2, a two-state Markov. 34.
(44) model with associated probabilities will be used for representing the behavior of the vertical handover. As derived in Eq. (4-5), the state probabilities of UMTS, (PUMTS), WLAN, (PWLAN) and handover probability, (Pho(k)), can be calculated based on both the transition probabilities of UMTS to WLAN, (Pw|u), and WLAN to UMTS, (Pu|w).. PUMTS (k) = PUMTS (k −1) × (1− Pw|u (k )) + PWLAN (k −1) × Pu|w (k) PWLAN (k) = PWLAN (k −1) × (1− Pu|w (k )) + PUMTS (k −1) × Pw|u (k ). (4-5). Pho (k ) = PUMTS (k −1) × Pw|u (k) + PWLAN (k −1) × Pu|w (k). Figure 4-2. Handover probability motion. Assuming that MS first connects to UMTS where PUMTS (0) =1, PWLAN (0) =0, it can be seen that Eq. (4-5) can be solved if the probability Pw|u(k) and Pu|w(k) are known. To solve the transition probability, a vertical handover process is depicted in Figure 4-3. From Figure 4-3, in UMTS-to-WLAN downlink handover, the transition will occur at the Kth interval if S WLAN ( K downlink ) − S UMTS ( K downlink ) > H ( K downlink ) for ∆Tdownlink intervals. Here, if each mapping sample is independent, Pw|u(dk) can be written as:. 35.
(45) Pw|u (k ) =. K. ∏ P{S. WLAN. (i) − SUMTS (i) > H (i) | PUMTS (i − 1)}. (4-6). i = K downlink. K downlink = K − ∆Tdownlink + 1. (4-7). SWLAN-SUMTS > H Count=Count+1. Trigger timer SWLAN-SUMTS > H. Count==∆Tdownlink. SWLAN-SUMTS < H Count=0. UMTS. SWLAN-SUMTS > H Count=0. WLAN. SWLAN-SUMTS < H. Count ==∆Tuplink. Trigger timer SWLAN-SUMTS < H Count=Count+1. Figure 4-3. Finite state machines for handover process. Eq. (4-6) can be also rewritten as. Pw|u (k ) =. K. ∏ P{S. WLAN. (i) − SUMTS (i) >H (i)}. (4-8). i = K downlink. 36.
(46) which assumes that the current state and the received strength between the UMTS and WLAN are independent. Similarly, for WLAN-to-UMTS uplink handover, the probability Pw|u(dk) can also be written as:. Pu|w (k ) =. K. ∏ P(S. WLAN. (i) − SUMTS (i) <H (i)). (4-9). i = K uplinl. K uplink = K − ∆Tuplink + 1. (4-10). For the shadowing fading, the probabilities. P( SWLAN (i) − SUMTS (i) > H (i )). and. P( SWLAN (i) − SUMTS (i) < H (i)) can be calculated by using the Q function:. H (i ) − mean( X (i)) ) var( X (i )) H (i ) − mean( X (i)) P( X (i ) ≥ H (i )) = Q( var( X (i )) X (i) = S WLAN (i ) − S UMTS (i ). P( X (i ) ≤ H (i )) = 1 − Q(. (4-11). where mean(X (i)) is the mean value of X (i) and var(X (i)) is the variance of X(i). By substituting Eq. (4-11) into (4-8) and (4-9), we can then calculate Pw|u(k) and Pu|w(k). Finally, from Eq. (4-5), Pho(k), Pu(k), and Pw(k) can be derived. When the vertical handover probability Pho(k) and the state probabilities Pu(k) and Pw(k) are calculated, the vertical handover frequency, H user can be calculated as follows:. 37. f. , and average throughput, R , for a single.
(47) T. Hf =. ∑P. ho. i =0. (i ). T. R=. ∑{P i =0. (4-12). T. UMTS. (i) ⋅ RUMTS (i) + PWLAN (i) ⋅ RWLAN (i)} (4-13). T. where T is the simulation time. In next section, we will give the simulation results based on this model and give discussions.. 4.2 Numerical Results and Analysis With the defined scenario, the performance derived in Eq. (4-5) can then be used to verify the proposed vertical handover control algorithm. Without losing the generality, a hot-spot scenario is assumed where there is only one UMTS base station and one WLAN access point. As shown in Figure 4-1, the trajectory of mobile will across the WLAN coverage. The system and traffic parameters are listed in Table 4-1: Table 4-1. Parameters Used for Numerical Analysis Parameter. Value. UMTS radius. 500 meter. WLAN radius. 50 meter. Separation between UMTS and WLAN. 250 meter. K1,K3 (path loss parameter). 0dB. K2,K4 (path loss parameter). 30dB. 38.
(48) σ 2 (shadowing variance). 6 dB. Tav (average distance for filter). 30 ms. ∆ (handover latency). 500 ms. Sample time. 50 ms. Video traffic delay bound (DB). 50 ms. Video frame per second (1/PI). 25 fps. Allowable frame loss rate (B). 5%. α (parameter in H). 5 dB. In this simulation, both non-real-time services and real-time services are considered. A baseline vertical handover algorithm (based on the signal-strength trigger only) is used as the reference to quantify the proposed vertical handover control algorithm. 4.2.1 Non-real-time services As discussed, for non-real-time services, achieving higher transmission rates will be the major focus of the proposed vertical handover algorithm. As shown in Figure 4-4, for non-real-time services, the proposed vertical handover control algorithm achieves higher system throughput than the baseline handover control algorithm. As expected from Figure 4-5, the chance of staying in WLAN is higher in the proposed vertical handover control algorithm. Also, as depicted in Figure 4-6, the proposed vertical handover control algorithm can substantially reduce the handover frequency, which has a positive impact on the processing power and the over-the-air signaling.. 39.
(49) 9 proposed baseline (signal-strength). 8. Throughput (Mbps). 7 6 5 4 3 2 1. 0. 10. 20. 30. 40. 50 Time (s ). 60. 70. 80. 90. Figure 4-4. Throughput statistics for non-real-time services. Figure 4-5. Average state probabilities for different conditions. 40. 100.
(50) 5. 0.25 1: proposed 2: baseline. 4.8. 1: proposed 2: baseline. 4.6. 0.2. Handover frequency. Throughput (Mbps). 4.4 4.2 4 3.8. 0.15. 0.1. 3.6 3.4. 0.05. 3.2 3. 0. 1 2 Average throughput comparisons. 1 2 handover frequency comparisons. Figure 4-6. Performance comparisons for non-real-time services 4.2.2 Real-time services For real-time services, the QoS in terms of the limited number of lost packets within a delay budget is the major concern in the proposed vertical handover control algorithm. As depicted in Figures 4-7 and 4-8, with comparable throughput performance, the number of packet loss rate is reduced significantly. with the proposed vertical handover control. algorithm. The improvement of the packet loss is mainly due to the reduction of the vertical handover frequency. In this case, the proposed algorithm keeps the mobile in the UMTS about 60% of the time when the user initially connected to UMTS, shown in Figure 4-5.. 41.
(51) 16 proposed baseline (signal-strength). 14. Frame loss rate(%). 12 10 8 6 4 2 0. 0. 10. 20. 30. 40. 50 Time (s). 60. 70. 80. 90. 100. Figure 4-7. Frame loss statistics (error-free channel) for real-time services. 4 3.9. 0.25. 1: proposed 2: baseline. 1: proposed 2: baseline. 3.8. 0.2. Handover frequency. Throughput (Mbps). 3.7 3.6 3.5 3.4. 0.15. 0.1. 3.3 3.2. 0.05. 3.1 3. 0. 1 2 Average throughput comparis ons. 1 2 Handover frequency comparisons. Figure 4-8. Performance comparisons for real time services. 42.
(52) Chapter 5. Conclusions 5.1 Contributions The challenges in designing the vertical handover are addressed and corresponding solutions are proposed: (1) Throughput-based mapping function is used to resolve the no-common pilot problem in the integrated system. (2) QoS-based dynamic handover thresholds could dynamically change the handover criteria for real-time and non-real-time services. (3) Performance-based trigger timer will calculate the proper trigger timer to avoid excessive ping-pong effect caused by an unstable channel conditions. An analytic model is provided to analyze the handover performance in the heterogeneous networks. Finally, the results show the proposed algorithm could improve the transmission throughput for non-real-time services and could substantially reduce the packet loss rate for the real-time services by reducing the vertical handover frequency.. 5.2 Future works In designing the mapping function, it just considers the throughput performance as a mapping judgment. However the other issues like power budget, building cost, and etc should be also taken into considerations. So a cost function which is a combination of considered parameters with associated weighted factors is expected to be a new judgment for controlling. 43.
(53) the vertical handover. Besides, in this scenario, one UMTS cell covers one WLAN cell is assumed. In fact, one UMTS cells would cover several WLAN cells due to the smaller coverage of WLAN system. So how to select the WLAN cell as a handover target is an urgent problem. This issue becomes difficult in uplink handover; this is because mobile can switch to original UMTS network or handover to other WLAN cells. Those two conditions might have different handover methods and performances, so how to choose the most suitable decision for satisfying users’ requirements is a future work. Finally, investigating how to apply this vertical handover control mechanism as a general form for other heterogeneous networks like WLAN/WMAN, Ultra-Wideband/UMTS is a good study in the future works.. 44.
(54) Reference [1] D. J. Goodman “Wireless Personal communications Systems” Addison Wesley Longman 1997. [2] “BRAN HIPERLAN 3: Requirement and Architectures for Interworking between HIPERLAN/2 and 3rd Generation Cellular Systems”, ETSI TR 101 957 V1.1.1 [3] G. Corazza, D. Fiancristofaro and F. Santucci, “Characterization of Handover Initialization in Cellular Mobile Radio Networks”, IEEE VTC, 1994 [4] M. Gudumunson, “Analysis of Handover Algorithms”, IEEE VTC, 1991 [5] 3GPP TS 21.103: 3rd Generation mobile system Release 5 specifications [6] 3GPP TS 23.002: Network architecture [7] 3GPP TS 23.107: Quality of Service (QoS) concept and architecture [8] 3GPP TS 25.301: Radio interface protocol architecture [9] IEEE Std. 802.11-1999, Part 11: Wireless LAN Medium Access Control (MAC) and Physical Layer (PHY) specifications, Reference number ISO/IEC 8802-11:1999(E), IEEE Std. 802.11, 1999 edition, 1999. [10] IEEE Std 802.11a-1999, Part 11: Wireless LAN Medium Access Control (MAC) and Physical Layer (PHY) specifications—Amendment 1: High-speed Physical Layer in the 5 GHz band, Reference number ISO/IEC 8802-11:1999/Amd 1:2000(E) [11] IEEE 802.11b-1999: Wireless LAN MAC and PHY specifications: Higher speed Physical Layer (PHY) extension in the 2.4 GHz band [12] IEEE Std 802.11e/D3.0: Wireless Medium Access Control (MAC) and Physical Layer (PHY) specifications: Medium Access Control (MAC) Quality of Service (QoS) Enhancements [13] H. Bing, C. He and L. Jiang “Performance Analysis of Vertical Handover in a UMTS-WLAN Integrated Networks” IEEE International Symposium on Personal, Indoor and Mobile Radio Communication Proceedings 2003 [14] P. Krishnamurthy, A. Hatami and R. Piclma “Handoff in Hybrid Mobile Data Networks” IEEE Personal Communications Apr 2000 [15] 3GPP TR 22.934: Feasibility study on 3GPP system to Wireless Local Area Network (WLAN) interworking [16] M. Gustafsson “Compressed Mode Techniques for Inter-Frequency Measurements in a Wideband DS-CDMA Systems” Proc 8th IEEE PIMRC, Sep 1997. 45.
(55) [17] 3GPP, TR 25.212 V5.5.0: Multiplexing and channel coding (FDD) [18] 3GPP, TR 25.211 V5.4.0: Physical channels and mapping of transport channels onto physical channels (FDD) [19] 3GPP, TR 25.215 V5.4.0: Physical layer - Measurements (FDD) [20] 3GPP TSGR1#5(99) 633: User Management in Compressed Mode [21] United. States. Patent. “Method. US6498933,. for. Transmitting. Data. for. Inter-Frequency/Inter-System Handover in Mobile Telecommunications System”, Dec. 24, 2002 [22] Y. Wang, S. Dan, P. Zhang, H. Wang, “Comparison between the periodic and event-triggered compressed mode”, VTC Spring 2002. IEEE 55th, Volume: 3, 6-9 May 2002 [23] Z. Zhang,” WCDMA compressed mode triggering method for IRAT handover”, WCNC. 2004, IEEE, Volume:2, 21-25 March 2004 [24] IEEE Part 11 “Wireless LAN Medium Access Control (MAC) and Physical Layer (PHY) Specifications” IEEE Standard 802.11 1999 [25] W. Li, Q. Zeng and P. Agrawal “A Reliable Active Scanning Scheme for the IEEE 802.11 MAC Layer Handoff” Radio and Wireless Conference, 2003. RAWCON '03. Proceedings [26] M. Stemm and R. H. Katz “Vertical handoffs in wireless overlay networks” In ACM Mobile Networking (MONET), Special Issu on Mobile Networking in the Internet, 1997 [27] Q. Zhang, C. Guo, Z. Guo, and W. Zhu “Efficient Mobility Management for Vertical Handoff between WWAN and WLAN” IEEE Communications Magazine November 2003 [28] H. J. Wang, R. H. Katz, and J. Giese “Policy-Enabled Handoffs Across Heterogeneous Wireless Networks” WMCSA, 1999 [29] M. Ylianttila, M. Pande, J. Makela, P. Mahonen “Optimization Scheme for Mobile Users Performing Vertical Handoffs between IEEE 802.11 and GPRS/EDGE networks” Global Telecommunications Conference, 2001 [30] D. B. Johnson. “Scalable support for transparent mobile host internetworking” In Wireless Networks, 1996. [31] L. Ma, F. Yu, and C.M. Leung “A new method to support UMTS/WLAN vertical handover using SCTP” IEEE Wireless Communications August 2004. 46.
(56) [32] K. Kim “Handbook of CDMA Systems Design, Engineering, and Optimization” Prentice Hall PTR 1999 [33] S.W. Wang and I. Wang “Effects of Soft Handoff, Frequency Reuse, and Non-ideal Antenna Sectorization on CDMA System Capacity”, Proc IEEE VTC, May 1993 [34] C.Y. Chung, M.Y. Tsai and J. Huang “Adaptive Quality-based Handoff Algorithms for Third Generation Wireless Communication Systems” IEEE VTC Oct 2004 [35] H.H. Juan and C.Y. Chung “Adaptive Quality-based Handover Control Algorithm in UMTS” IEEE WCE Nov 2004 [36] A. Grilo and M. Nunes, “Performance evaluation of IEEE 802.11e,” in Proc. IEEE PIMRC’02, Sept. 2002, pp. 511-517 [37] S.Choi, J.D. Prado, S. Shankar, and S. Mangold. “IEEE 802.11e contention-based channel access (EDCF) performance evaluation,” in Proc. IEEE ICC’03, vol. 2 May 2003, pp 1151-1156 [38] Z. N. Kong, D. H. K. Tsang, and Brahim Bensaou. ”Performance Analysis of IEEE 802.11e Contention-Based Channel Access,” in Selected Areas in Communications, IEEE Journal on, Volume: 22, Issue: 10, Dec. 2004 pp 2095-2106 [39] S.M. Shirvani, V. Tabataba, and A. Falahati “New handoff initiation algorithm (optimum combination of hysteresis & threshold based methods)” IEEE VTC, 2000 [40] N.C. Chen, R.D. Yates “Evaluation of a minimum power handoff algorithm” Personal, Indoor and Mobile Radio Communications, 1995. PIMRC'95. 'Wireless: Merging onto the Information Superhighway, Sixth IEEE International Symposium on Volume 2, 27-29 Sept. 1995 Page(s):814 - 818 vol.2. 47.
(57)
數據
+7
相關文件
Although many excellent resource synchronization protocols have been pro- posed, most of them are either for hard real-time task scheduling with the maxi- mum priority inversion
Note that if the server-side system allows conflicting transaction instances to commit in an order different from their serializability order, then each client-side system must apply
To address the developmental needs of young children (0 to 5 years).. An integrated community-based child and family
To enhance availability of composite services, we propose a discovery-based service com- position framework to better integrate component services in both static and dynamic
In this thesis, we have proposed a new and simple feedforward sampling time offset (STO) estimation scheme for an OFDM-based IEEE 802.11a WLAN that uses an interpolator to recover
The performance guarantees of real-time garbage collectors and the free-page replenishment mechanism are based on a constant α, i.e., a lower-bound on the number of free pages that
Reading: Stankovic, et al., “Implications of Classical Scheduling Results for Real-Time Systems,” IEEE Computer, June 1995, pp.. Copyright: All rights reserved, Prof. Stankovic,
In Section 3, the shift and scale argument from [2] is applied to show how each quantitative Landis theorem follows from the corresponding order-of-vanishing estimate.. A number
