Dependence of QSAR Models on the Selection of Trial Descriptor
Sets: A Demonstration Using Nanotoxicity Endpoints of Decorated
Nanotubes
Chi-Yu Shao,
†Sing-Zuo Chen,
†Bo-Han Su,
‡Yufeng J. Tseng,*
,†,‡Emilio Xavier Esposito,
§,∥and Anton J. Hopfinger
⊥,§†Graduate Institute of Biomedical Electronics and Bioinformatics, National Taiwan University, No.1 Sec.4, Roosevelt Road, Taipei,
Taiwan 106
‡Department of Computer Science and Information Engineering, National Taiwan University, No.1 Sec.4, Roosevelt Road, Taipei,
Taiwan 106
§The Chem21 Group, Inc., 1780 Wilson Drive, Lake Forest, Illinois 60045, United States ∥exeResearch, LLC, 32 University Drive, East Lansing, Michigan 48823, United States
⊥College of Pharmacy, MSC09 5360, 1 University of New Mexico, Albuquerque, New Mexico 7131-0001, United States
ABSTRACT: Little attention has been given to the selection of trial descriptor sets when designing a QSAR analysis even though a great number of descriptor classes, and often a greater number of descriptors within a given class, are now available. This paper reports an effort to explore interrelationships between QSAR models and descriptor sets. Zhou and co-workers (Zhou et al., Nano Lett. 2008, 8 (3), 859−865) designed, synthesized, and tested a combinatorial library of 80 surface modified, that is decorated, multi-walled carbon nanotubes for their composite nanotoxicity using six endpoints all
based on a common 0 to 100 activity scale. Each of the six endpoints for the 29 most nanotoxic decorated nanotubes were incorporated as the training set for this study. The study reported here includes trial descriptor sets for all possible combinations of MOE, VolSurf, and 4D-fingerprints (FP) descriptor classes, as well as including and excluding explicit spatial contributions from the nanotube. Optimized QSAR models were constructed from these multiple trial descriptor sets. It was found that (a) both the form and quality of the best QSAR models for each of the endpoints are distinct and (b) some endpoints are quite dependent upon 4D-FP descriptors of the entire nanotube−decorator complex. However, other endpoints yielded equally good models only using decorator descriptors with and without the decorator-only 4D-FP descriptors. Lastly, and most importantly, the quality, significance, and interpretation of a QSAR model were found to be critically dependent on the trial descriptor sets used within a given QSAR endpoint study.
■
INTRODUCTIONA great deal of effort has gone into developing methods to optimize QSAR models for a given trial descriptor set. However, little attention has seemingly been given to the selection of trial descriptor sets used to perform the QSAR study. To some extent, this situation, at least in the past, was due to relatively limited types and numbers of descriptors. But today a great number of descriptor classes, and often a great number of descriptors within a given class, are available. The goal of the research reported herein is to explore the form, quality, and“complementarity” of QSAR models developed using a variety of trial descriptor sets. For each of the diverse endpoint measures, based upon a common activity scale and for common training set of compounds across the endpoints, a variety of QSAR models optimized under different constraints have been developed and reported.
Indeed, the key to performing this particular trial descriptor set study was infinding a training set of chemical structures that could be divided into well-defined and comparable substructures
but also for which multiple and diverse, yet comparable, endpoint measures have been determined. A library of surface modified nanotubes made by combinatorial library synthesis,1 and screened with respect to relative protein-binding, cytotoxicity, and immune response endpoints1forms an excellent data set to systematically explore the interrelationships between trial descriptor sets and corresponding optimized QSAR models. In addition, this data set provides an opportunity to hypothesize, through the QSAR models, the mechanistic bases for nano-toxicity of decorated nanotubes.1A subsequent paper will focus upon possible mechanisms of nanotoxicity for the decorated nanotubes as gleaned from the QSAR models.
Nanotoxicity studies of carbon nanotubes2−13 and nano-particles12,14−17have been reported, and the need for a better understanding of how nanoparticles (including nanotubes) impact biological behavior is an increasing priority in
Received: November 3, 2012
Published: December 19, 2012
toxicology.4,18−23For example, a cytotoxicity endpoint measure for single-wall and multi-wall nanotubes5has been investigated. Single-wall (SWNTs) and multi-wall nanotubes (with diameters ranging from 10 to 20 nm) (MWNT) and fullerene structures were included in the study. On the basis largely of electron microscope-type observations, the cytotoxicity endpoints were placed in a potency sequence ordering. It was then observed that SWNTs yielded larger cytotoxicity potency than the other two nanoparticles.
Another study focusing upon the nanotoxicity of long and short carbon nanotubes has also been reported.24 The three macroscopic toxicity endpoints used were phagocytosis by macrophages, clearing from tissues, and the effect of carbon nanotube structures on red blood cells. It was found that MWNT with a low aspect ratio (ratio of length to width) can be engulfed by macrophages, yet MWNTs with a high aspect ratio cannot be cleared and thus accumulate in tissues where they promote carcinogenesis.
While studies of all types of nanotoxicity endpoints are important, the work reported here is centered on and only valid for the data set reported by Zhou and co-workers.1Moreover, this paper only addresses the construction and exploration of QSAR models based upon the selection of trial descriptor sets and does not focus upon mechanisms of nanotoxicity action.
■
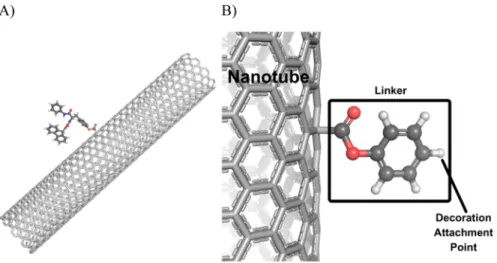
METHODSNanotoxicity Endpoints. Zhou et al.1 designed, synthe-sized, and tested a combinatorial library of 80 surface modified multi-walled carbon nanotubes1 where the surface decorators were made from a combination of eight amines and nine acylators with a common linking group to the nanotube (Figure 1B). These 80 decorator−nanotube complexes (DNC) were
tested for their relative protein binding to four different proteins, namely bovine serum albumin (BSA), carbonic anhydrase (CA), chymotrypsin (CT), and hemoglobin (HB). The reference standard compound for all six nanotoxicity endpoints was the nanotube decorated with only carboxyl groups.
To evaluate the acute cytotoxicity (Cell) of the DNC library in macrophages, Zhou et al. used the WST-1 assay.25Cell viability was measured by determining the mitochondrial dehydro-genases’ activity. The immune response was measured by treating macrophages with DNC for 24 h in a solution of lipopolysaccharide.1The concentration of released nitrite was an indicator for nitrogen oxide (NO) generation26on the basis of the activity of NO synthesis that corresponds to immune response.
A summary of the nanotoxicity screens used in the Zhou et al. study1and adopted in this study are provided in Table 1. Zhou and co-workers also used the cumulative index (arithmetic sum) of the six endpoints for an overall ranking of the “biononcompat-ibility”, or nanotoxicity, of the 80 DNC.
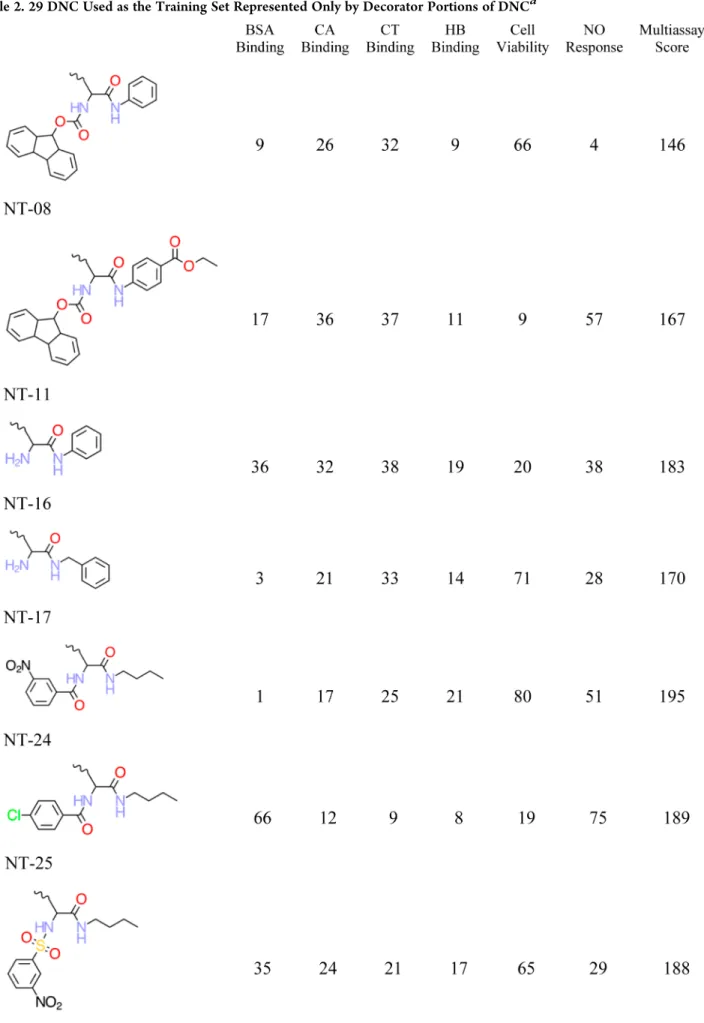
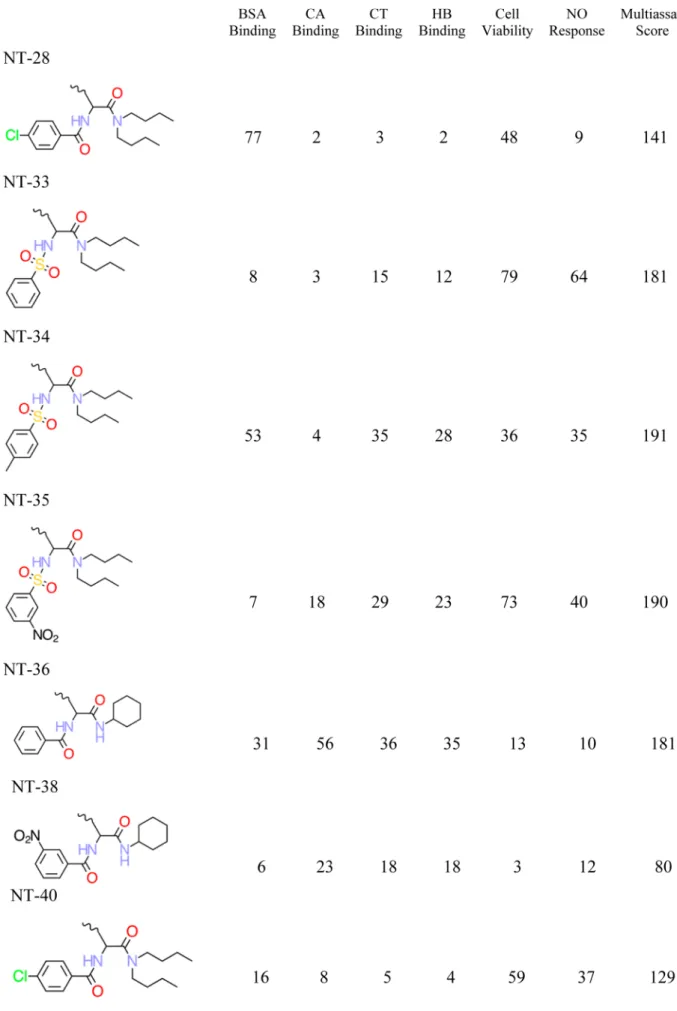
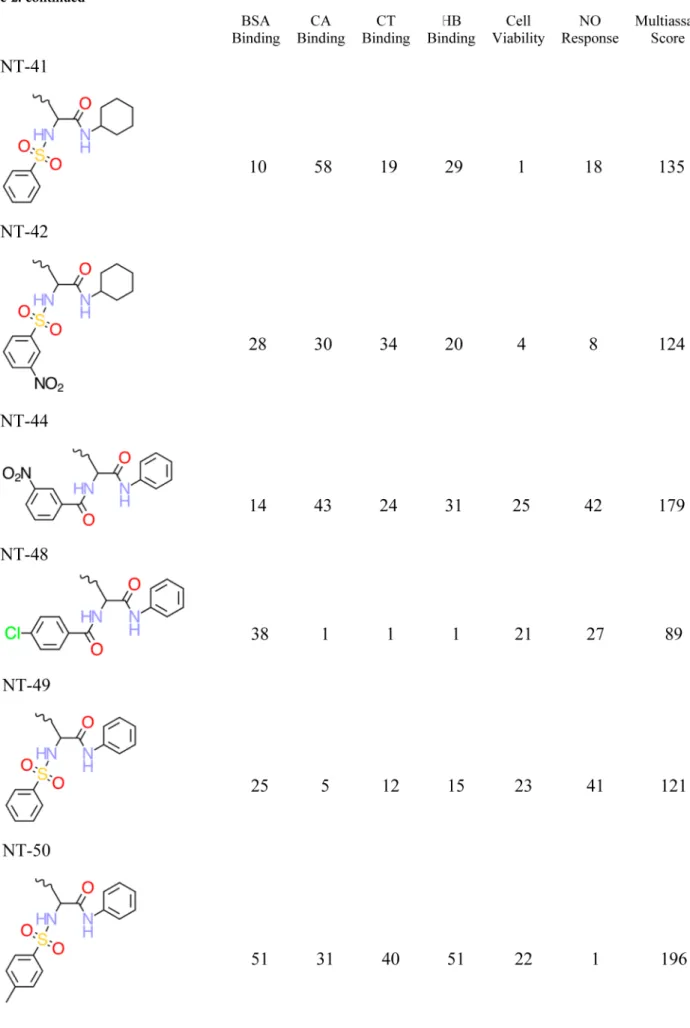
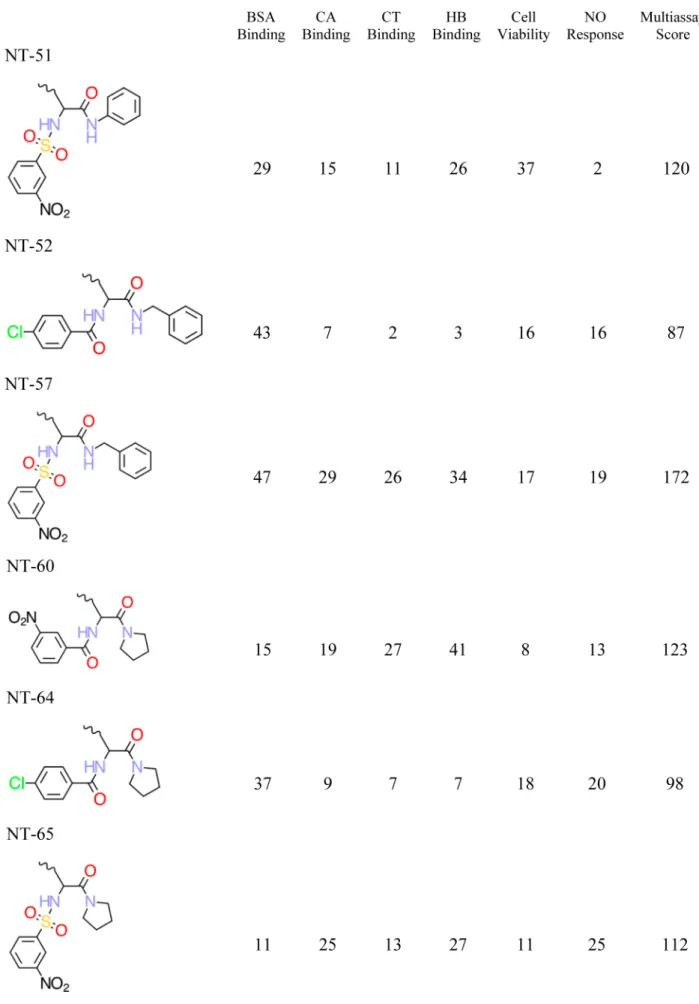
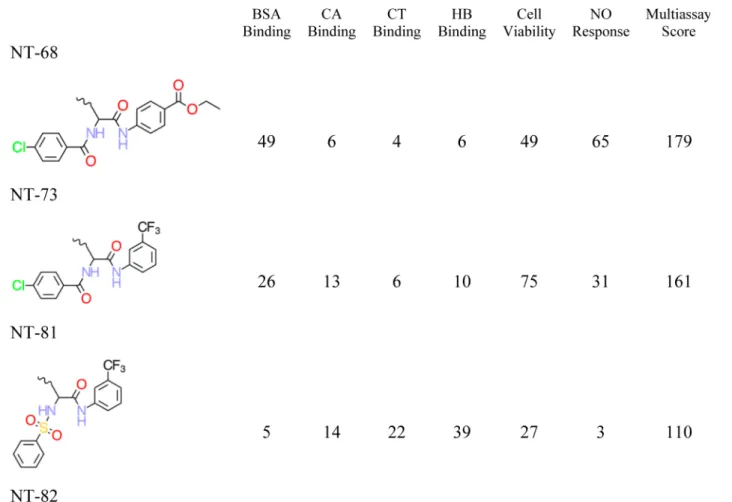
Chemical Structures and QSAR Training Set. Eighty distinct DNC were synthesized and tested, but as described above, only the 29 most nanotoxic DNC based upon the cumulative index over all six endpoint measures were retained and discussed by Zhou and co-workers.1These 29 DNC were used as the training set, and the decorator portions of these DNC are shown in Table 2. The corresponding features of these 29 DNC are summarized in Table 3, while their six nanotoxicity (biological) endpoints are included as part of Table 2.
There are three significant differences between the nanotube structures used in this predictive QSAR modeling study as compared to the reported experimental structures. First, the structures used in this study are SWNT, while Zhou et al.1used
Figure 1.Representation of the decorated nanotube and nanotube-linker assembly. (A) The 13 Å diameter nanotube with the decorator NT-08, as defined in Table 2, bound to the surface of the nanotube. (B) Nanotube-linker assembly and decoration attachment point.
Table 1. Description of Protein Binding and Cellular Endpoints
(A) The binding to four individual proteins, bovine serum albumin (BSA), carbonic anhydrase (CA), chymotrypsin (CT), and hemoglobin (HB), were determined for the DNC library members and compared with the degree of binding of the corresponding DNC reference having a carboxyl group (−COOH) decorator. Relative binding affinity has been expressed on a 0 to 100 scale where 100 corresponds to the reference DNC (100 most“toxic”).
(B) Cell Viability (Cell) was determined on the basis of the activity of the mitochondrial dehydrogenases in the presence and absence of the nanotube−decorator complexes and expressed on a 0 to 100 scale (100 most“toxic”).
(C) The immune response of macrophages to the DNC was determined by measuring the concentration of released nitrite indicative of NO relative to a standard and this ratio expressed on a 0 to 100 scale (100 most“toxic”).
(D) The overall nanotoxicity (biononcompatibility) of a DNC was taken to be the sum of the six endpoints described above and referred to as the multi-assay endpoint. (E) Numerical values of the six endpoints, (A) through (C) above, were reported only for the 29 most“toxic” nanotube−decorator complexes that have been used as the training
undefined MWNT. The number of walls of the nanotube will have little, if any, impact on the conformational behavior of the surface attached decorator groups. Second, the diameter(s) of the carbon nanotubes were not reported by Zhou et al.1Finally, the surface density and distribution of the decorator groups affixed to the carbon nanotube have not been reported by Zhou et al.1The three structural feature differences described above were taken into consideration and accommodated by (a) adopting single-wall carbon nanotubes, (b) using two different diameter single-wall carbon nanotubes of 10 and 13 Å diameter each 65 Å in length, and (c) using a single decorator group linked to the surface of the carbon nanotube midway down its length
(Figure 1). Moreover, the nanotube−decorator complex was geometry optimized using the molecular dynamics simulation (MDS) package GROMACS (version 4.5.2 for Linux) with the ffgmx force field (a derivative of the GROMOS87 force field). Theffgmx force field is advantageous because it is comprised of small molecular functional groups instead of amino acid residues allowing it to accommodate the nanotube and decorator structures. The geometry optimization protocol contained two steps: (1) geometry optimize the nanotube−decorator complex followed by (2) MDS to bring the complex to system equilibrium. The geometry optimization and MDS were Table 2. continued
a. The six nanotoxicity (biological) endpoints and associated multi-assay score are also reported.
Table 3. Description of Nanotube decorators’ Structural Chemistry
(A) Eight amines and nine acylators covering a diverse physicochemical property and feature space were used in the synthesis of the decorator library. The designed nanotube− decorator complex library is composed of 80 distinct decorators (8× 10; eight amines, nine acylators, and one set of decorations with an amine but without acylation). (B) Fmoc−tyrosine (Figure 1B) was used as a common linking group between the nanotube surface carbons and the decorators.
(C) The“density” of decorator substitution on the surface of the nanotube is not known.
(D) Uncharacterized multi-wall carbon nanotubes of unspecified diameter were used as the substrates for linking to the decorators. Table 4. Trial Descriptor Sets Used in QSAR Analysesa
MOE32 1D, 2D, and pseudo-3D physicochemical properties and molecular features
VolSurf33−35 Molecular interactionfield properties, 3D, but each represented as a single non-integer value
4D-FP36 Conformational ensemble averaged distances between pairs of all atom types composing a decorated nanotube complex in their reduced eigenvalue representation (A) 4D-FP for the decorator-only
(B) 4D-FP for the decorator linked to a 10 Å diameter nanotube (C) 4D-FP for the decorator linked to a 13 Å diameter nanotube
aAll combinations of all MOE, VolSurf, and the three types of 4D-FP were considered. The concentration of decorators on the surface of a nanotube
performed using Born solvation estimation as part of the overall forcefield.
Also, the presence of size-related decorator descriptors in the resultant QSAR models was monitored. Size-related decorator descriptors in a QSAR models should at least in part be indicative of the importance of the density of packing of decorator groups on the surface of the carbon nanotube.
Descriptor Sets Used in the QSAR Analyses. 1D, 2D, 3D, and 4D trial descriptor sets were used alone and in combination with one another to develop QSAR models for the six endpoints associated with the 29 compounds of the training set. The sets of trial descriptors employed in these QSAR analyses are defined in Table 4 and describe both the decorators and the nanotube− decorator structures. The combination of the trial descriptor poolsfrom not only the decorator but also from the combined decorator and nanotubeprovide an avenue to probe the intrinsic physicochemical properties, including conformational restrictions of the decorators due to their proximity to the nanotube.
Construction of QSAR Models. The various descriptor sets, alone and in combinations, as described in Table 4, formed the trial descriptor pools for genetic algorithm27 (GA) model optimization. The specific type of GA used in this study is a version of the genetic function approximation (GFA).28 The GFA model optimization is initiated by creating N (300 models) stochastically generated multi-dimensional linear regression (MLR) trial QSAR models. The mutation probability (random change of molecular descriptors within the models)28during the cross-over optimization cycle,28was set to 10%. The smoothing factor, a GFA operations variable,28,29 controls the number of independent variables (molecular descriptors) in the optimized
QSAR models and is varied in order to determine the optimal size (number of descriptors) of the QSAR models.
The diagnostic measures used to analyze the resultant QSAR models generated by the GFA include (i) descriptor usage as a function of the cross-over operation, (ii) linear cross-correlation among descriptors and/or dependent variables (endpoint, nanotoxicity measures), (iii) number of significant and independent QSAR models, and (iv) indices of model significance including most notably the correlation coefficient, R2, and the leave-one-out (LOO) cross-validation coefficient, Q2. Several additional metrics have been proposed over the past few years to evaluate significance and performance of QSAR models.30 The commonly used R2 and Q2 model evaluation metrics have been selected in this study as the primary measures to evaluate and compare the QSAR models. These two metrics are considered classic measures of quality andfit for MLR-based QSAR models and have been employed, validated,31 and debated30since their initial implementations.
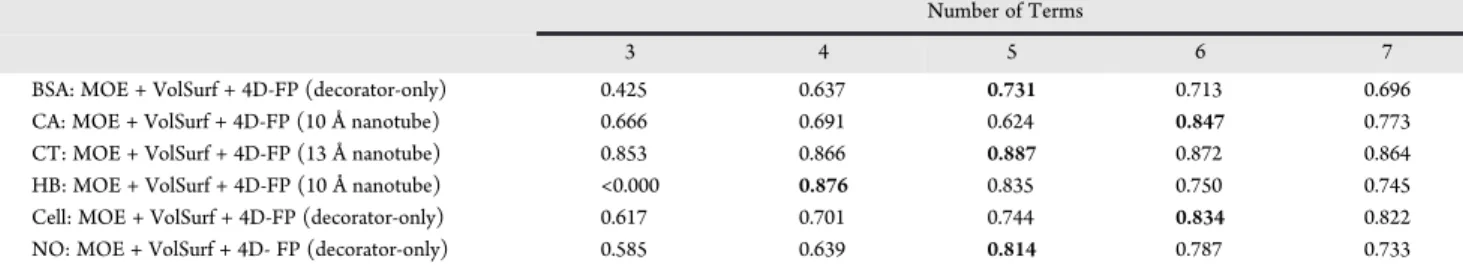
Comparison of QSAR Models. There are a variety of ways to compare and contrast the optimized QSAR models constructed from the various trial descriptor pools reported in Table 4 for the six different nanotoxicity endpoints described in Table 1 and reported in Table 2. However, it is essential to have models of the same sizenumber of molecular descriptor termsin order to make meaningful comparisons. Thus, for each type of comparison made across the QSAR models from the various trial descriptor sets and/or endpoints, the number of descriptors was held constant. The selection of the particular fixed size for models being compared was based upon maximizing Q2as a function of the number of descriptor terms in a model and then using the corresponding model that is smallest in size. Maximizing Q2 as a function of model size Table 5.Q2Values as a Function of the Number of Model Descriptor Terms Using Specific Trial Descriptor Pools.a
Number of Terms
3 4 5 6 7
BSA: MOE + VolSurf + 4D-FP (decorator-only) 0.425 0.637 0.731 0.713 0.696
CA: MOE + VolSurf + 4D-FP (10 Å nanotube) 0.666 0.691 0.624 0.847 0.773
CT: MOE + VolSurf + 4D-FP (13 Å nanotube) 0.853 0.866 0.887 0.872 0.864
HB: MOE + VolSurf + 4D-FP (10 Å nanotube) <0.000 0.876 0.835 0.750 0.745
Cell: MOE + VolSurf + 4D-FP (decorator-only) 0.617 0.701 0.744 0.834 0.822
NO: MOE + VolSurf + 4D- FP (decorator-only) 0.585 0.639 0.814 0.787 0.733
aEach set of models is affected to varying degrees by the 4D-FP contributions. The maximized Q2 value for each trial descriptor pool is indicated by
the bolded values.
Table 6.R2andQ2Values for the Decorator-Only Optimized Five Term QSAR Models for All Combinations of the Descriptor Sets Reported in Table 4 for the Four Protein Binding Endpoints
Descriptor Set Decorator-Only CA Decorator-Only BSA Decorator-Only HB Decorator-Only CT
MOE R2 0.806 0.706 0.860 0.872 Q2 0.700 0.566 0.791 0.844 VolSurf R2 0.681 0.601 0.705 0.733 Q2 0.572 0.452 0.588 0.600 4D-FP R2 0.851 0.721 0.872 0.900 Q2 0.516 0.627 0.772 0.759 MOE + VolSurf R2 0.840 0.760 0.860 0.872 Q2 0.749 0.669 0.791 0.844 MOE + 4D-FP R2 0.844 0.814 0.931 0.918 Q2 0.763 0.726 0.891 0.880 VolSurf + 4D-FP R2 0.893 0.804 0.921 0.869 Q2 0.811 0.660 0.860 0.825 MOE + VolSurf + 4D-FP R2 0.892 0.818 0.931 0.936 Q2 0.832 0.731 0.891 0.906
optimizes thefit between dependent and independent variables without overfitting. The smallest size model for which Q2 is maximized corresponds to a model that has the most “fitting-information” per descriptor term. Table 5 presents optimized QSAR models developed in this study having 3-7 terms using specific trial descriptor pools having different contributions from the 4D-FP descriptor pool (decorator-only versus inclusion of the nanotube). The maximized Q2values are given in bold print. Five-term QSAR models are prevalent among the optimized models.
■
RESULTSR2 and Q2 for Decorator-Only QSAR Models as a
Function of Descriptor Set and Endpoint. The optimized model size for this comparison study was found to be five descriptors based upon the criteria and methodology reported above. Table 6 lists the R2and Q2values for thefive descriptor term (molecular descriptors) QSAR models for all combinations of the decorator-only descriptor sets reported in Table 4 for each of the four protein binding endpoints.
Even a cursory inspection of Table 6 makes it clear that QSAR quality andfit in characterizing protein binding is different for the each of the four proteins, as well as for the different trial descriptor sets. For example, the R2and Q2values, respectively,
for the optimized models for CA binding using only VolSurf descriptors are 0.681 and 0.572, while for the MOE descriptor set the values are 0.806 and 0.700. Moreover, when the MOE,
VolSurf, and 4D-FP descriptor are jointly used as the trial descriptor pool, the R2and Q2values of the resulting best
five-term model are 0.892 and 0.832.
In a similar fashion, one can compare the R2and Q2values for the five-term QSAR models for using only the VolSurf descriptors andfind the R2and Q2to be only 0.601 and 0.452, respectively, for BSA, but 0.733 and 0.600 for CT. However, if the MOE, VolSurf, and 4D-FP descriptors sets are combined as the trial descriptor pool, the R2and Q2values for the resulting optimized model are 0.818 and 0.731 for BSA, respectively, and 0.936 and 0.906 for CT. Clearly, different descriptor sets are making different contributions to fitting the observed protein binding endpoints and perhaps even in a complementary fashion. In line with this thinking, the data in Table 6 also suggests that the larger more comprehensive the trial descriptor set the more significant is the model in terms of both R2and Q2.
Operationally, these results suggest that the descriptor sets being used may capture different portions of the structure− activity relationship (SAR) for each of the binding proteins and/ or the experimental measures of protein−nanotube binding may vary in their levels of comparative reliability. The idea that experimental measures within a family of similar endpoints may differ in reliability/accuracy is something that does not seem to have been considered as an issue in QSAR modeling.
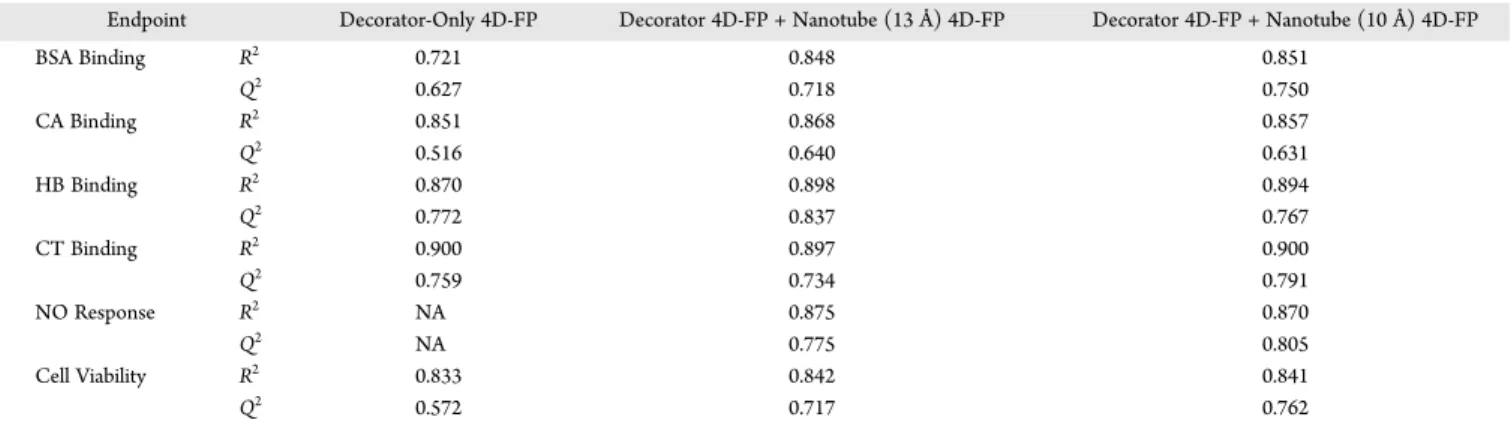
R2andQ2for the QSAR Models as a Function of the 4D-FP Descriptor Set and Endpoint. In Table 7 the optimized five-term QSAR models for each of the six nanotoxicity Table 7.R2andQ2Values for Optimized Five-Term QSAR Models for All Six Nanotoxicity Endpoints Using the Three Types of
4D-FP Trial Descriptor Sets Reported in Table 4
Endpoint Decorator-Only 4D-FP Decorator 4D-FP + Nanotube (13 Å) 4D-FP Decorator 4D-FP + Nanotube (10 Å) 4D-FP
BSA Binding R2 0.721 0.848 0.851 Q2 0.627 0.718 0.750 CA Binding R2 0.851 0.868 0.857 Q2 0.516 0.640 0.631 HB Binding R2 0.870 0.898 0.894 Q2 0.772 0.837 0.767 CT Binding R2 0.900 0.897 0.900 Q2 0.759 0.734 0.791 NO Response R2 NA 0.875 0.870 Q2 NA 0.775 0.805 Cell Viability R2 0.833 0.842 0.841 Q2 0.572 0.717 0.762
Table 8.R2andQ2Values for the Optimized Five-Term QSAR Models for the CA Binding Endpoint Using All Possible Sets of Descriptors and Including and Excluding 4D-FP Contributions from the Nanotubea
Descriptor Set Decorator-Only Decorator + (13 Å) Nanotube Decorator + (10 Å) Nanotube
MOE R2 0.786 NA NA Q2 0.700 NA NA VolSurf R2 0.681 NA NA Q2 0.572 NA NA 4D-FP R2 0.851 0.868 0.857 Q2 0.516 0.640 0.631 MOE + VolSurf R2 0.840 NA NA Q2 0.749 NA NA MOE + 4D-FP R2 0.844 0.867 0.869 Q2 0.763 0.786 0.769 VolSurf + 4D-FP R2 0.893 0.892 0.889 Q2 0.811 0.841 0.794 MOE + VolSurf + 4D-FP R2 0.892 0.872 0.872 Q2 0.832 0.687 0.817
endpoints are reported in terms of their respective R2and Q2 values using the three types of 4D-FP descriptor sets defined in Table 4 as the trial descriptor sets. Basically, Table 7 allows the probing of model quality and significance as a function of including, or excluding, the explicit presence of the nanotube and/or conformation of the decorator. It is seen that for the BSA
and NO endpoints the inclusion of 4D-FP involving the nanotube greatly enhances the corresponding QSAR model. Also, the 10 and 13 Å diameter nanotubes yielded QSAR models of about the same significance (R2 and Q2 and descriptor
composition). However, for the other four endpoints, the explicit consideration of 4D-FP descriptors from either of the two types Table 9.R2andQ2Values for Optimized Five-Term QSAR Models for the BSA Binding Endpoint Using All Possible Sets of
Descriptors and Including and Excluding 4D-FP Contributions from the Nanotubea
Descriptor Set Decorator-Only Decorator + (13 Å) Nanotube Decorator + (10 Å)Nanotube
MOE R2 0.706 NA NA Q2 0.566 NA NA VolSurf R2 0.601 NA NA Q2 0.452 NA NA 4D-FP R2 0.721 0.848 0.820 Q2 0.627 0.718 0.681 MOE + VolSurf R2 0.760 NA NA Q2 0.669 NA NA MOE + 4D-FP R2 0.818 0.867 0.830 Q2 0.731 0.807 0.678 VolSurf +4D-FP R2 0.804 0.903 0.832 Q2 0.660 0.860 0.604 MOE + VolSurf +4D-FP R2 0.818 0.903 0.839 Q2 0.731 0.860 0.724
aNA: not applicable. The nanotubes have near constant sets of MOE and VolSurf descriptors across all 29 DNC.
Table 10. QSAR Descriptor Terms, Influence of the Descriptor on the Predicted Endpoint, and R2andQ2for the Best Model in Each of the Three 4D-FP Classes for the BSA and CA Binding Endpointsa
Endpoint Best QSAR Model Molecular Component(s) R2 Q2 Descriptor Influence Top GFA Descriptor Usage
BSA Binding MOE + 4D-FP Decorator-Only 0.844 0.752 + PN·ARO7 ePN·ARO7: 299
+ PP·PN6 ePP·PN6: 299 − All·HBD3 eAll·NP17: 285 − PP·HBA6 eAll·HBD3: 199 + All·NP17 eAll·HBA6: 63
+ a_acc
VolSurf + 4D-FP Decorator + Nanotube (13 Å) 0.903 0.860 + HS·HS294 eAll·HS34: 300 + All·HS34 eHS·HS294: 299 + All·All62 eAll·HS165: 284 + All·HS450 eAll·All62: 177 + vsurf_D4 eAll·HS450: 137 MOE + VolSurf + 4D-FP Decorator + Nanotube (10 Å) 0.781 0.758 + All·NP596 eNP·NP821: 299 − NP·NP821 eHS·HS724: 255 + All·HS418 eNP·NP596: 231
+ eNP·ARO291: 124
PEOE_VSAplus2 eHS·HS517: 70 CA Binding MOE + VolSurf + 4D-FP Decorator-Only 0.892 0.832 − All·NP19 eAll·All26: 298 − vsurf_DW13 vsurf_DW13: 225
− All·All26 GCUT_SMR_2:152 + GCUT_SMR_2 eNP·NP20: 78
+ Q_VSA_FPOL eNP·PP10: 76 VolSurf + 4D-FP Decorator + Nanotube (13 Å) 0.892 0.841 − eHS·HS193 eNP·HS335: 293
− eNP·HS335 eHS·HS808: 279 + eAll·All1170 eAll·All1170: 276 − eHS·HS808 eNP·NP278: 95 − eNP·NP553 eHS·HS218: 62 MOE + 4D-FP Decorator + Nanotube (10 Å) 0.903 0.851 + eAll·All946 SMR_VSA7: 292
− SMR_VSA7 eHS·HS864: 241 + eHS·HS864 eAll·All946: 210 + eAll·HS131 eAll·HS103: 203 + eAll·HS28 eNP·HS267: 189 + eHS·HS635
aAlso given are the most often used descriptors in the cross-over operation during GFA model construction. Bolded descriptors within these two
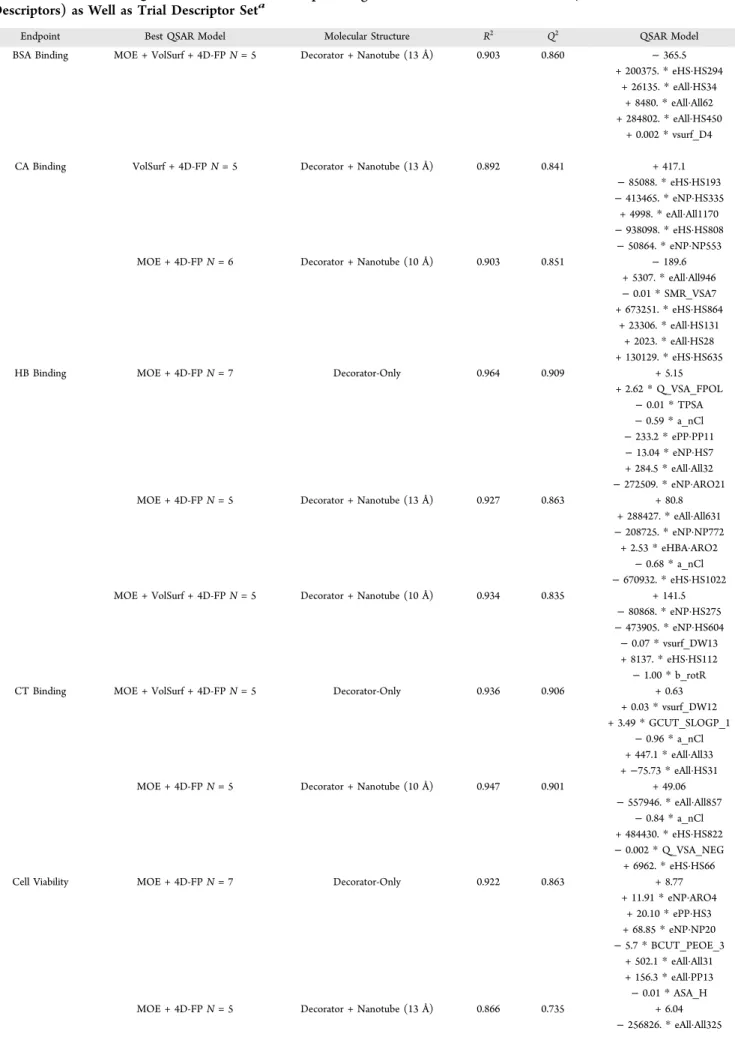
Table 11. Best Overall QSAR Models in Terms of Optimizing the Model as a Function of Size (Number of Molecular Descriptors) as Well as Trial Descriptor Seta
Endpoint Best QSAR Model Molecular Structure R2 Q2 QSAR Model
BSA Binding MOE + VolSurf + 4D-FP N = 5 Decorator + Nanotube (13 Å) 0.903 0.860 − 365.5 + 200375.* eHS·HS294
+ 26135.* eAll·HS34 + 8480.* eAll·All62 + 284802.* eAll·HS450
+ 0.002* vsurf_D4 CA Binding VolSurf + 4D-FP N = 5 Decorator + Nanotube (13 Å) 0.892 0.841 + 417.1
− 85088. * eHS·HS193 − 413465. * eNP·HS335
+ 4998.* eAll·All1170 − 938098. * eHS·HS808
− 50864. * eNP·NP553 MOE + 4D-FP N = 6 Decorator + Nanotube (10 Å) 0.903 0.851 − 189.6
+ 5307.* eAll·All946 − 0.01 * SMR_VSA7 + 673251.* eHS·HS864 + 23306.* eAll·HS131 + 2023.* eAll·HS28 + 130129.* eHS·HS635
HB Binding MOE + 4D-FP N = 7 Decorator-Only 0.964 0.909 + 5.15
+ 2.62* Q_VSA_FPOL − 0.01 * TPSA − 0.59 * a_nCl − 233.2 * ePP·PP11 − 13.04 * eNP·HS7 + 284.5* eAll·All32 − 272509. * eNP·ARO21 MOE + 4D-FP N = 5 Decorator + Nanotube (13 Å) 0.927 0.863 + 80.8
+ 288427.* eAll·All631 − 208725. * eNP·NP772
+ 2.53* eHBA·ARO2 − 0.68 * a_nCl − 670932. * eHS·HS1022 MOE + VolSurf + 4D-FP N = 5 Decorator + Nanotube (10 Å) 0.934 0.835 + 141.5
− 80868. * eNP·HS275 − 473905. * eNP·HS604
− 0.07 * vsurf_DW13 + 8137.* eHS·HS112
− 1.00 * b_rotR
CT Binding MOE + VolSurf + 4D-FP N = 5 Decorator-Only 0.936 0.906 + 0.63
+ 0.03* vsurf_DW12 + 3.49* GCUT_SLOGP_1
− 0.96 * a_nCl + 447.1* eAll·All33 +−75.73 * eAll·HS31 MOE + 4D-FP N = 5 Decorator + Nanotube (10 Å) 0.947 0.901 + 49.06
− 557946. * eAll·All857 − 0.84 * a_nCl + 484430.* eHS·HS822 − 0.002 * Q_VSA_NEG + 6962.* eHS·HS66
Cell Viability MOE + 4D-FP N = 7 Decorator-Only 0.922 0.863 + 8.77
+ 11.91* eNP·ARO4 + 20.10* ePP·HS3 + 68.85* eNP·NP20 − 5.7 * BCUT_PEOE_3 + 502.1* eAll·All31 + 156.3* eAll·PP13 − 0.01 * ASA_H MOE + 4D-FP N = 5 Decorator + Nanotube (13 Å) 0.866 0.735 + 6.04
of nanotubes contributes little to improve the resultant QSAR models when compared to the decorator-only model. It would not have been possible to determine the role of the nanotube on each of the six endpoints without the availability of the 4D-FP descriptors. Theflexibility and capability to include or exclude the 4D-FPs based on only the decorator or the nanotube− decorator unit allows for the exploration of the nanotube contribution to the endpoint of interest.
CA Binding QSAR Models as a Function of the Descriptor Set Employed. The complete set of optimized QSAR models, which arefive-term models, for CA binding is provided in Table 8. The model constructed from the combined VolSurf and 4D-FP decorator-only trial descriptor pool is a very good model. However, the stand-alone VolSurf trial descriptor set yields a relatively poor model. But more globally, combining the VolSurf descriptors with any other descriptor set and using this composite descriptor set as a trial descriptor pool yields models of considerable significance as measured by both R2and
Q2 relative to the model derived solely from the VolSurf
descriptor set.
BSA Binding QSAR Models as a Function of the Trial Descriptor Set. The optimum size for these models, based upon the specified criteria given in the Methods section, is again five-term models. The data in Table 9 indicates that deployment of the MOE, VolSurf, or decorator-only 4D-FP descriptors, each as individual trial descriptor sets, leads to QSAR models of marginal significance as compared to those models derived from all other possible trial descriptor sets. Moreover, the inclusion of 4D-FP descriptor sets based upon the explicit consideration of the nanotube for any combination of descriptor sets yields better models than any of the decorator-only models on the basis of R2
and Q2. Finally, the models derived from the 4D-FP descriptors
of the 13 Å nanotube are significantly better than those built from the 10 Å nanotube 4D-FP descriptors.
Best QSAR Models and Corresponding GFA Descriptor Cross-Over Usage for the Three 4D-FP Descriptor Classes. Table 10 contains the descriptor terms of the best QSAR models in terms of optimizing Q2as a function of the number of descriptor terms in the model for the BSA and CA binding endpoints. In this case, no common size constraint across the models was employed, but each of the three 4D-FP descriptor sets was used as part of the trial descriptor pool. Each model from each individual endpoint and trial descriptor set was
optimized in terms of maximizing Q2as a function of model size. The QSAR models for these two endpoints are meant to be representative in terms of descriptor set behavior of all six nanotoxicity endpoints. Also, listed in Table 10 are the top descriptors used in GFA model construction. The number to the right of the descriptor name in the“Top GFA Descriptor Usage” column is the relative number of time the descriptor was used in the GFA cross-over operation during GFA optimization. Only those descriptors used at least 20% as much as the most often used descriptor are reported. The bolded descriptors in the“Top GFA Descriptor Usage” column match the descriptors found in the best resultant QSAR models that are listed in the“Descriptor Influence” column. These descriptors are ranked on the basis of importance from top to bottom, and the sign in front of the descriptor indicates if the descriptor contributes to increasing (+) or decreasing (−) the predicted (calculated) endpoint value. Descriptor importance is measured by the absolute value of the product of the descriptor regression coefficient times the range of the descriptor in the training set.
It is shown from inspecting Table 10 that on average about half to two-thirds of the most often used descriptors in GFA cross-over optimization are found in the correspondingfinal optimized QSAR model. The other descriptors of the best models are less used descriptors that meaningfully complement the most used descriptors in optimizing Q2. Moreover, the ranking of descriptors in GFA usage tracks quite well with relative descriptor importance for all the models reported in Table 10. The 4D-FP descriptors are the most used descriptors in GFA optimization and are also found most often in the QSAR models of Table 10 having the highest R2and Q2values.
The general definitions and classifications of the descriptors in Table 10, and later in Table 11, are summarized as follows:
(A) The 4D-FP descriptors permit a large range of conforma-tional and spatial features of molecules to be used in trial descriptor pools for QSAR analysis. In this approach, e(X·YM) is the Mtheigenvalue representation of the pair
interaction distances between all atom/group types X and Y averaged over the conformational ensemble of the molecule.36The larger the value of M, the greater the distant apart on average is the corresponding X and Y atom/group types in the molecule. Thus, for example, the BSA decorator-only descriptor, ePP·PN6 refers to M = 6 for X = PP and Y = PN, which in turn corresponds to a pair Table 11. continued
Endpoint Best QSAR Model Molecular Structure R2 Q2 QSAR Model
− 8987. * eHS·HS47 − 0.10 * dipoleX + 198263.* eNP·HS513 + 238320.* eAll·HS403 VolSurf + 4D-FP N = 5 Decorator + Nanotube (10 Å) 0.857 0.759 + 27.36
− 313068. * eAll·NP727 + 315524.* eAll·NP404 − 22.96 * vsurf_CW7 − 26310. * eAll·NP127
− 21708. * eAll·All83 NO Response MOE + VolSurf + 4D-FP N = 5 Decorator + Nanotube (10 Å) 0.900 0.837 − 197.5
+ 544342.* eHS·HS807 − 35.98 * ePP·HBD3
− 0.01 * E_ele + 257224.* eNP·HS394
− 0.13 * dipoleX aThe descriptor set, model size, molecular structure, R2 and Q2, and QSAR model are given in the columns from left to right.
of polar positive and polar negative atoms that are separated by approximately 6 Å. The other atom/group designations are as follows: All− all atoms of the molecule with no type differentiation, NP − nonpolar, HBA − hydrogen bond acceptor, HBD− hydrogen bond donor, ARO− aromatic, and HS − any type of non-hydrogen atom (hydrogen suppressed; also-known-as heavy atoms). The 4D-FP descriptors are characterized as being small in positive value for most drug-size molecules. The small positive value of these descriptors is due to them being normalized eigenvalues that enable the descriptors to be compared to one another. Thus, large regression coefficients can be expected and are found when these descriptors appear in regression-based QSAR models. (B) vsurf_XM are scalar values for particular types of
molecular interactionfields generated by a probe molecule interacting with the molecule of interest. X denotes a particular iso-surface at value M in 3D space around the molecule of interest. The definitions of the set of vsurf_XM are in the works of Cruciani and co-work-ers.33−35
(C) The remaining descriptors of the QSAR models given in Table 10 are MOE descriptors,32and a description of the descriptors are available on the Chemical Computing Group Web site.37
Best Overall QSAR Models for All Six Nanotoxicity Endpoint Measures. The best overall QSAR models in terms of optimizing the model as a function of size as well as trial descriptor set are given in Table 11 for each of the six endpoints. Infive cases, there are models from different descriptor sets and/ or of different sizes that are correspondingly different from one another but that are practically indistinguishable in terms of R2 and Q2. Hence, there are multiple best model entries for these endpoints.
All of the models in Table 11 have between 5 and 7 terms with five-term models being the most prevalent. On average, these best models have R2values between 0.85 and 0.95 and Q2values
from 0.75 to 0.85. Thus, on the premise, no overfitting has occurred in building the models, as measured by maximizing Q2
as a function of size; it is reasonable to conclude that the models in Table 11 are quite significant and stable.
The models in Table 11 are rich in 4D-FP descriptors with a prevalence of 4D-FP involving“All” and “HS” atom types and having large eigenvalue numbers. These observations suggest that interactions involving decorator atoms distant from the carbon nanotube atoms dominate the QSAR models. In other words, conformations of the decorators extended away from the surface of the nanotube appear important for most of the endpoints. This behavior will be fully discussed in our next paper dealing with probing possible mechanistic interpretations of the QSAR models of Table 11.
The decorator-only models of Table 11 have more MOE and VolSurf descriptors than the models involving explicit consid-eration of the SWNT. The most prevalent descriptor from the MOE and VolSurf trial descriptor sets is the number of chlorines
in the decorator, a_nCl, present for the CT and HB endpoints and is predicted to decrease protein binding in both cases.
It is important to remember that the results presented in this section and in Tables 10 and 11 are for the best models, regardless of size (number of molecular descriptors). These models also consider all combinations of the descriptor sets as trial descriptor pools and are not at odds with the findings presented in the previous sections where model size and/or descriptor set(s) were used as constraints in building and comparing the QSAR models.
Multi-Assay Endpoint. Zhou et al.1 constructed a single global endpoint measure they call the multi-assay endpoint to collectively rank the impact of all six nanotoxicity endpoints of the 80 DNC. Because all six endpoints are defined on a common 0 to 100 scale, there is no reason to weigh the endpoints other than equally. Thus, the researchers chose the sum of the six endpoints as the global endpoint measure. While this is certainly a sensible way of characterizing the “net” nanotoxicity of the decorated carbon nanotube, the question does arise if the multi-assay endpoint has any physicochemical and/or mechanistic meaning? Without going into detail, the descriptor diversity across the best QSAR models for each of the six endpoints in Table 11 would suggest that the multi-assay composite endpoint might“average out” distinct mechanistic contributions from the individual endpoints. If this is the case, then the best QSAR models for the multi-assay endpoint should be inferior to those of the six individual endpoints. Table 12 compares R2and Q2of the best five-term QSAR models for each of the six nanotoxicity endpoints to those of the best multi-assay QSAR model. It is clear that the multi-assay QSAR model is inferior to each of the six nanotoxicity endpoint models in terms of both R2and Q2. Thus, while the multi-assay model is useful to rank the “net” nanotoxicity of the decorated carbon nanotubes, by doing so mechanistic and physicochemical information are seemingly somewhat lost.
Interpretation and Visualization of Some QSAR Model Descriptors. The discussion presented here is not intended to attempt to define sources of nanotoxicity using the QSAR models. However, a visual example of the role of a member from each of the classes of descriptors found among the best QSAR models in this study does provide additional insight to the goal of this research: to demonstrate the sensitivity of QSAR models to the choice of the chosen trial descriptor pool.
An increase in the interactions between“All” atom pairs (All− All) at large distances (greater than 30 Å) increases the predicted HB binding value on the basis of 4D-FP QSAR descriptors having large eigenvalues. This correlation is most prevalent for interactions between nanotube carbons and non-hydrogen atoms of the decorators. That is, the larger the decoration and/ or the greater its projection from the nanotube, the greater the HB binding. Decoration 17 (NT-17) is considered a “small” decoration but can protrude as far from the nanotube as decoration 64 (NT-64). This is illustrated by the images in Figure 2. While the decoration of NT-17 (HB binding 14) can extend far from the nanotube in its extended conformation, the decoration of NT-64 (HB binding 41) is able to create more Table 12. Comparison ofR2andQ2of the Best Five-Term QSAR Models for Each of the Six Nanotoxicity Endpoints to Those of
the Best Multi-Assay QSAR Model with Five Descriptors
BSA CA HB CT NO Cell Viability Multi-Assay
R2 0.903 0.892 0.932 0.947 0.900 0.857 0.800
long-range atom−atom interactions principally involving deco-rator heavy atoms with nanotube carbons. Thus NT-64 is predicted to have a greater binding to HB than NT-17. The more interactions between the nanotube and the decoration should likely be taken as an indication of the decoration’s steric bulk distributed over space.
The inclusion of short-range interactions between polar-positive atoms (PP) and hydrogen bond donors (HBD) within the decorator reduces the predicted NO response (the [− 35.98 * ePP·HBD3] term). Two examples of pairwise intradecorator distance interactions of PP and HBD atom pairs are shown in Figure 3. Decorator 42 (NT-42) with a NO response of 18 possesses a PP-HBD pair interaction within 3−4 Å, that is a 4D-FP descriptor with a small eigenvalue number, and is shown in part (A) of Figure 3. In contrast, part (B) of Figure 3 illustrates NT-34 with a NO response of 64 and also has PP and HBD atoms, but these atoms cannot come to within 5 Å of one another. There are 10 decorators in the training set with atoms designated as PP and HBD, but only eight of these decorators have the ability for a short-range PP-HBD intradecorator interaction to occur.
The inclusion of decorator-only descriptors to the trial descriptor pool permits the characterization of specific molecular features that are unique to the decorator. This decorator specificity as noted earlier is achieved by explicitly removing the nanotube as part of the descriptor calculation. From the models in Table 11, two decorator-only MOE molecular descriptors, SMR_VSA7 (Figure 4) and Q_VSA_FPOL (Figure 5), are revealed as important in some QSAR models. These molecular descriptors map physical properties to the idealized van der Waals surface area (vdWSA) of a decorator. The idealized van der Waals surface area in turn is calculated using the elemental van der Waals surface area and ideal interatomic distances but does not include the obscured vdWSA due to atomic overlap.32,37 The SMR_VSA7 descriptor measures the idealized vdWSA for atoms that contribute greater than 0.56 to the computed molar refractivity (MR).38The CA binding QSAR model contains the SMR_VSA7 descriptor, and as SMR_VSA7 of the decorator increases, the predicted CA binding is predicted to be reduced. For the training set of decorators, individual atoms with MR values greater than 0.56 are terminal carbons and sulfur atoms that are highlighted with green dots in Figure 4. Within the CA binding data set, decorator 35 (NT-35), Part A of Figure 4, has a binding value of 4 and a vdWSA of 129 Å2. In contrast, decorator
60 of NT-60, Part B of Figure 4, has a binding value of 29 and a vdWSA of 29 Å2. Decorators that do not contain terminal carbon or sulfur atoms bind better to CA on the basis of this descriptor. Q_VSA_FPOL is the fraction of polar idealized vdWSA of the decorator that positively impacts the HB binding value on the basis of the (+ 2.62* Q_VSA_FPOL) descriptor term of one of the HB QSAR models in Table 11. Atoms were assigned MMFF94x atomic partial charges32 and are classified as polar when their absolute atomic partial charge is greater than 0.2. The decorator of NT-48 (HB binding value of 31) has a polar vdWSA fraction of 0.370, while the decorator of NT-57 (HB binding value of 3) has a polar vdWSA fraction of 0.263. Increasing HB binding by increasing the decorator’s fraction of polar vdWSA is visually illustrated in Figure 5. The portion of polar vdWSA for each of these decorators (Part A illustrates NT-48, and Part B illustrates NT-57) is depicted in Figure 5 by the set of spheres defined by the orange dots.
Figure 2. Long-range atom−atom interactions captured by 4D-FP descriptors with large eigenvalues numbers in the HB QSAR model. The examples shown are for nanotube carbons interacting with decorator heavy atoms. Part A is NT-64. Part B is NT-17.
Figure 3.Decorator PP-HBD specific interactions. Part A illustrates NT-42 and its 3−5 Å PP-HBD distance interaction that is between the SO2sulfur and the proton of the amide group as shown. Part B illustrates NT-34 has both PP and HBD atoms. However, in this case because the PP and HBD atoms are bonded to each other and 4D-FPs only capture nonbonded interactions, they do not satisfy the requirement of being within 3−5 Å of one another.
■
DISCUSSION AND CONCLUSIONSThe majorfindings and conclusions summarized in Table 13 that have been made from this study focus on the role and impact of considering different classes and types of descriptors for the trial descriptor sets used in building the corresponding QSAR models.
Possible mechanistic interpretations from the QSAR models for the six nanotoxicity endpoints investigated are only very briefly discussed. A separate manuscript addresses mechanistic aspects of the nanotoxicity endpoints, as suggested from the
corresponding QSAR models, for this training set of decorated nanotubes.
The most importantfinding of this study is the demonstration that different descriptor sets can yield optimized QSAR models of varying quality and of diverse descriptor representation for each individual endpoint. Thisfinding also suggests a strategy to maximize the extraction of SAR information from a given training set by using different descriptor sets to develop an ensemble of QSAR models that can be compared, contrasted, and integrated. The overall conclusion of this study is that the outcome of a QSAR study is critically dependent on the sets of descriptors
Figure 4.SMR_VSA7 descriptor example. The dotted green shapes surround those atoms that have SMR values of 0.56 or greater. Part A shows decorator NT-35 with a SMR_VSA7 value of 129 Å2, while Part B shows NT-60 that has a SMR_VSA7 value of 29 Å2.
Figure 5.Polar van der Waals surface area depicted as orange dots for the decorators of NT-48 in Part A and NT-57 in Part B.
Table 13. Major Findings with Regard to the Six Nanotoxicity Endpoints
1. Finding: Both the form and quality of the best QSAR models for each of the protein binding endpoint are distinct from one another.
Conclusion: The binding process of the DNC with each of the four endpoint proteins are notably different from one another, and the QSAR models are capturing at least some of the corresponding distinguishing features of each binding process.
2. Finding: Some endpoints are quite dependent upon the 4D-FP descriptors of the entire DNC. However, other endpoints yield equally good models using decorator-only descriptors with and without decorator−nanotube 4D-FP descriptors.
Conclusion: Unless the nanotube is explicitly considered in building the QSAR model for a given endpoint, it is not possible to determine its role and importance in expressing and dissecting the SAR of the endpoint.
3. Finding: The“Cell Viability” and “NO Response” endpoints yield QSAR models of equivalent quality to those of the four protein specific binding endpoints.
Conclusion: The trial descriptor sets used in this study appears to provide about an equal amount of information to build models for the less pharmacologically well-defined endpoints (“Cell Viability” and “NO Response”) as for the more well-defined endpoints.
4. Finding: All QSAR models for all six endpoints contain and are generally rich in 4D-FP descriptors.
Conclusion: All six endpoints are explicitly dependent upon the spatial properties of the decorated carbon nanotube complexes. These spatial properties may only include the conformation of the decorator but in other cases also location and shape of the decorator relative to the nanotube.
5. Finding: Different descriptor sets yield optimized QSAR models of varying quality and diverse representations of possible mechanisms of action for each endpoint. Conclusion: The outcome of a QSAR study is critically dependent upon the descriptor sets used to construct the QSAR models.
used to do the QSAR modeling. Perhaps this conclusion will set the tone for what we hope is a community-wide investigation of this“degree of freedom” in QSAR analysis.
■
AUTHOR INFORMATIONCorresponding Author
* Phone: +886.2.3366.4888, #529. Fax: +886.2.23628167. E-mail: yjtseng@csie.ntu.edu.tw.
Notes
The authors declare no competingfinancial interest.
■
ACKNOWLEDGMENTSThis work was funded by the Taiwan National Science Council, Grants Numbers 100-2325-B-002-004 and 101-2325-B-002-005. Resources of the Laboratory of Computational Molecular Design and Metabolomics and the Department of Computer Science and Information Engineering of National Taiwan University were used in performing these studies.
■
REFERENCES(1) Zhou, H.; Mu, Q.; Gao, N.; Liu, A.; Xing, Y.; Gao, S.; Zhang, Q.; Qu, G.; Chen, Y.; Liu, G.; Zhang, B.; Yan, B. A nano-combinatorial library strategy for the discovery of nanotubes with reduced protein-binding, cytotoxicity, and immune response. Nano Lett. 2008, 8 (3), 859−865.
(2) Fourches, D.; Pu, D.; Tassa, C.; Weissleder, R.; Shaw, S. Y.; Mumper, R. J.; Tropsha, A. Quantitative nanostructure-activity relationship modeling. ACS Nano 2010, 4 (10), 5703−5712.
(3) Fourches, D.; Pu, D.; Tropsha, A. Exploring quantitative nanostructure−activity relationships (QNAR) modeling as a tool for predicting biological effects of manufactured nanoparticles. Comb. Chem. High Throughput Screening 2011, 14 (3), 217−225.
(4) Tejral, G.; Panyala, N. R.; Havel, J. Carbon nanotubes: Toxicological impact on human health and environment. J. Appl. Biomed. 2009, 7 (2), 1−13.
(5) Jia, G.; Wang, H.; Yan, L.; Wang, X.; Pei, R.; Yan, T.; Zhao, Y.; Guo, X. Cytotoxicity of carbon nanomaterials: Single-wall nanotube, multi-wall nanotube, and fullerene. Environ. Sci. Technol. 2005, 39 (5), 1378− 1383.
(6) Kaiser, J.-P.; Krug, H. F.; Wick, P. Nanomaterial cell interactions: How do carbon nanotubes affect cell physiology? Nanomedicine (London) 2009, 4 (1), 57−63.
(7) Mu, Q.; Du, G.; Chen, T.; Zhang, B.; Yan, B. Suppression of human bone morphogenetic protein signaling by carboxylated single-walled carbon nanotubes. ACS Nano 2009, 3 (5), 1139−1144.
(8) Zhang, B.; Xing, Y.; Li, Z.; Zhou, H.; Mu, Q.; Yan, B. Functionalized carbon nanotubes specifically bind to alpha-chymotrypsin’s catalytic site and regulate its enzymatic function. Nano Lett. 2009, 9 (6), 2280−2284. (9) Mu, Q.; Broughton, D. L.; Yan, B. Endosomal leakage and nuclear translocation of multi-walled carbon nanotubes: Developing a model for cell uptake. Nano Lett. 2009, 9 (12), 4370−4375.
(10) Zhou, H.; Jiao, P.; Yang, L.; Li, X.; Yan, B. Enhancing cell recognition by scrutinizing cell surfaces with a nanoparticle array. J. Am. Chem. Soc. 2011, 133 (4), 680−682.
(11) Gao, N.; Zhang, Q.; Mu, Q.; Bai, Y.; Li, L.; Zhou, H.; Butch, E. R.; Powell, T. B.; Snyder, S. E.; Jiang, G.; Yan, B. Steering carbon nanotubes to scavenger receptor recognition by nanotube surface chemistry modification partially alleviates NFκB activation and reduces its immunotoxicity. ACS Nano 2011, 5 (6), 4581−4591.
(12) Moyano, D. F.; Rotello, V. M. Nano meets biology: Structure and function at the nanoparticle interface. Langmuir 2011, 27 (17), 10376− 10385.
(13) Zhang, Y.; Yan, B. Cell cycle regulation by carboxylated multi-walled carbon nanotubes through p53-independent induction of p21 under the control of the BMP signaling pathway. Chem. Res. Toxicol. 2012, 25 (6), 1212−1221.
(14) Baker, G. L.; Gupta, A.; Clark, M. L.; Valenzuela, B. R.; Staska, L. M.; Harbo, S. J.; Pierce, J. T.; Dill, J. A. Inhalation toxicity and lung toxicokinetics of C60 fullerene nanoparticles and microparticles. Toxicol. Sci. 2008, 101 (1), 122−131.
(15) Weissleder, R.; Kelly, K.; Sun, E. Y.; Shtatland, T.; Josephson, L. Cell-specific targeting of nanoparticles by multivalent attachment of small molecules. Nat. Biotechnol. 2005, 23 (11), 1418−1423.
(16) Zhou, H.; Du, F.; Li, X.; Zhang, B.; Li, W.; Yan, B. Characterization of organic molecules attached to gold nanoparticle surface using high resolution magic angle spinning 1H NMR. J. Phys. Chem. C 2008, 112 (49), 19360−19366.
(17) Mu, Q.; Li, Z.; Li, X.; Mishra, S. R.; Zhang, B.; Si, Z.; Yang, L.; Jiang, W.; Yan, B. Characterization of protein clusters of diverse magnetic nanoparticles and their dynamic interactions with human cells. J. Phys. Chem. C 2009, 113 (14), 5390−5395.
(18) Mahmoudi, M.; Lynch, I.; Ejtehadi, M. R.; Monopoli, M. P.; Bombelli, F. B.; Laurent, S. Protein-nanoparticle interactions: Opportunities and challenges. Chem. Rev. 2011, 111 (9), 5610−5637.
(19) Myllynen, P.i. Damaging DNA from a distance. Nat. Nanotechnol. 2009, 4 (12), 795−796.
(20) Panyala, N. R.; Pena-Mendez, E. M.; Havel, J. Silver or silver nanoparticles: A hazardous threat to the environment and human health? J. Appl. Biomed. 2008, 6 (3), 117−129.
(21) Panyala, N. R.; Pena-Mendez, E. M.; Havel, J. Gold and nano-gold in medicine: Overview, toxicology and perspectives. J. Appl. Biomed. 2009, 7 (2), 75−91.
(22) Stern, S. T.; McNeil, S. E. Nanotechnology safety concerns revisited. Toxicol. Sci. 2008, 101 (1), 4−21.
(23) Kipen, H. M.; Laskin, D. L. Smaller is not always better: Nanotechnology yields nanotoxicology. Am. J. Physiol.: Lung Cell. Mol. Physiol. 2005, 289 (5), L696−L697.
(24) Kostarelos, K. The long and short of carbon nanotube toxicity. Nat. Biotechnol. 2008, 26 (7), 774−776.
(25) Wörle-Knirsch, J. M.; Pulskamp, K.; Krug, H. F. Oops they did it again! Carbon nanotubes hoax scientists in viability assays. Nano Lett. 2006, 6 (6), 1261−1268.
(26) Green, L. C.; Wagner, D. A.; Glogowski, J.; Skipper, P. L.; Wishnok, J. S.; Tannenbaum, S. R. Analysis of nitrate, nitrite, and [15N] nitrate in biological fluids. Anal. Biochem. 1982, 126 (1), 131−138.
(27) Holland, J. H. Adaptation in Natural and Artificial Systems: An Introductory Analysis with Applications to Biology, Control, and Artificial Intelligence; University of Michigan: Ann Arbor, MI, 1975.
(28) Rogers, D.; Hopfinger, A. J. Application of genetic function approximation to quantitative structure−activity relationships and quantitative structure−property relationships. J. Chem. Inf. Model. 1994, 34 (4), 854−866.
(29) Friedman, J. Multivariate Adaptive Regression Splines; Technical Report Number 102; Laboratory for Computational Statistics, Depart-ment of Statistics, Stanford University: Stanford, CA, 1990.
(30) Golbraikh, A.; Tropsha, A. Beware of q2! J. Mol. Graphics Modell. 2002, 20 (4), 269−276.
(31) Shao, J. Linear model selection by cross-validation. J. Am. Stat. Assoc. 1993, 88 (422), 486−494.
(32) Molecular Operating Environment (MOE); Chemical Computing Group, Inc.: Montreal, Quebec, Canada. http://www.chemcomp.com (accessed October 30, 2012).
(33) Cruciani, G.; Crivori, P.; Carrupt, P.; Testa, B. Molecular fields in quantitative structure−permeation relationships: The VolSurf ap-proach. J. Mol. Struct.: THEOCHEM 2000, 503 (1−2), 17−30.
(34) Cruciani, G.; Pastor, M.; Guba, W. VolSurf: A new tool for the pharmacokonetic optimization of lead compounds. Eur. J. Pharm. Sci. 2000, 11, S29−S39.
(35) Cruciani, G.; Pastor, M.; Mannhold, R. Suitability of molecular descriptors for database mining. A comparative analysis. J. Med. Chem. 2002, 45 (13), 2685−2694.
(36) Senese, C. L.; Duca, J.; Pan, D.; Hopfinger, A. J.; Tseng, Y. J. 4D-fingerprints, universal QSAR and QSPR descriptors. J. Chem. Inf. Model. 2004, 44 (5), 1526−1539.
(37) Lin, A. QuaSAR-Descriptor. http://www.chemcomp.com/ journal/descr.htm (accessed Nov. 1, 2012).
(38) Wildman, S. A.; Crippen, G. M. Prediction of physiochemical parameters by atomic contributions. J. Chem. Inf. Model. 1999, 39 (5), 868−873.