程式失控動態分析系統設計與實作
59
0
0
全文
(2) 程式失控動態分析系統設計與實作 The Design and Implementation of a Dynamic Instrument Tool for Program Crash Analysis 研 究 生: 劉世弘 指導教授: 黃世昆 博士. 國 資. 立 訊 碩. Student: Shih-Hung Liu Advisor: Dr. Shih-Kun Huang. 交 工 士. 通 程 論. 大 學 文. 學 系. A Thesis Submitted to Department of Computer Science and Information Engineering College of Electrical Engineering and Computer Science National Chiao Tung University In Partial Fulfillment of the Requirements For the Degree of Master In Computer Science and Information Engineering. June 2004 Hsinchu Taiwan, Republic of China. 中華民國九十三年六月. ii.
(3) 程式失控動態分析系統設計與實作 研究生 : 劉世弘. 指導教授:黃世昆 博士. 國立交通大學資訊工程學系(研究所)碩士班 摘要 為了符合市場快速開發的特性,發行後的軟體系統常發生未預期的錯 誤。有些錯誤可能導致軟體失控,甚或產生安全弱點。一般現成的商業軟體 (Commercial Off-The-Shelf, COTS)都沒有附原始碼,若軟體發生失控, 我們能做的就是回報給開發此軟體的廠商,並等待他們的修補(patch)。然 而軟體廠商常延誤多時才推出修補程式,有些修補程式甚至與舊有的軟體版 本不相容,未能完全修復錯誤。針對現有商業軟體元件,一般仍使用反向工 程(Reverse Engineering)工具進行測試與觀察軟體執行行為,以判斷該軟 體是否存在可能遭入侵的弱點。本研究的目標在於設計系統、協助判斷程式 失控點是否隱藏可被運用的軟體漏洞。我們希望此系統能提供系統化的程式 失控分析。 目前已有許多研究著力於偵測程式錯誤並指出錯誤形成的原因,有些是 透過靜態程式碼分析或動態觀測程式執行過程來進行分析,而大部分的研究 採用的方法是稽核或修改程式原始碼,以達到觀察的目的。然而由於本研究 是針對現成的商用軟體,沒有原始碼可供分析,我們因此發展一個實驗與攔 截(instrument and interception)的系統,能夠偵測軟體異常執行流程, 並判斷是否可能成為安全上的漏洞。本研究發展堆疊錯誤點偵測、逼近(stack corrupt site approximation and identification)與呼叫目標確認(call target validation)兩種機制去偵測程式的執行流程是否發生異常。透過對 微軟視窗(Microsoft Windows)平台上商業軟體的實驗,對現有多種弱點都 能有效偵測,並經由攔截狀況分析中瞭解產生異常的原因。此實驗也證實錯 誤點偵測機制能指出導致堆疊異常的函式。最後我們與相關工具比較,以評 估系統的可行性。. iii.
(4) The Design and Implementation of a Dynamic Instrument Tool for Program Crash Analysis Student: Shih-Hung Liu. Advisor: Shih-Kun Huang. Department (Institute) of Computer Science and Information Engineering National Chaio Tung University. Abstract In order to meet time to market, software often releases with unintended flaws. Some cause software crashes that are highly related to security vulnerabilities. Commercial Off-The-Shelf (COTS) software normally comes without source code. If there happened any program crash, all we can do is to report it to the vendor and wait for the patch. Some software companies, however, develop their patch not in timely manner, or even no longer support the older version. Normally, intended users can use debuggers to observe the running behavior of the software and determine if there exists any vulnerability to exploit. Our objective is to design a tool that helps systematically detect security-related errors from the crash. We want to automate the process to a certain extent for crash analysis. Much research work focused on detecting program errors and identifying their root causes either by static analysis or observing their running behavior through dynamic program instrument. Much of the work analyzes or instruments the source code of the software. However, with the assumption of lack of the source code, we develop an execution instrument and interception system and add detection mechanism of anomaly control flow inside to automatically judge if a certain crash can be exploited. We develop stack corrupt site identification and call target validation to detect if the control flow of the program is changed abnormally. Case studies of several commercial Windows applications from known exploits have proved the applicability of our system and better understanding of the exploiting path of these vulnerabilities. It manifests that our corrupt site identification mechanism points out the vulnerable function where the stack is polluted. At last, we compare this work with several related work to manifest the evaluation in the recent research.. Keywords: Dynamic Analysis, Software Wrapper, COTS Vulnerability Testing iv.
(5) 誌謝 首先,要感謝我的指導教授黃世昆博士,謝謝老師這些日子以來的細心指 導,給予許多寶貴的意見與想法,使得這篇論文得以完成;並感謝老師在生活與 做事上的觀念分享,讓我明白每個人在一個團隊中要盡心盡力地扮演好自己的角 色,才能使這個團隊卓壯與進步;並且要感謝中研院的梁德容教授,他的思路與 邏輯常常讓問題更加清楚。再來要感謝中研院軟體方法實驗室的黃舜溫學長以及 博士班的蔡昌憲學長,在做研究的這段過程裡給與我技術上與心態上的建議與教 導,在我鬆懈的時候給我提醒,在我茫然的時候給我意見,讓我得以完成這篇論 文,非常謝謝他們。接著要謝謝中研院軟體方法實驗室的其他學長,有袁勤國學 長、蔡和諺學長、洪偉能學長、陳宗裕學長、林宗伯學長與陳寬達學長,給我在 研究生這段期間生活上與技術上的幫忙與指教,讓我更加順利。最後要謝謝我的 祖母與父母給我的支持與鼓勵,容忍我的任性與脾氣,感謝他們長久以來對我所 做的一切;也謝謝宛真的陪伴以及給我的叮嚀與嘮叨,得以完成這篇論文。最後 祝福我所有的朋友同學平安快樂。. 劉世弘謹誌 民國九十三年六月. v.
(6) Table of Contents 1. Introduction..........................................................................................................1 1.1 Motivation........................................................................................................1 1.2 Background ......................................................................................................1 1.2.1 Stack-based Overflow Crash.................................................................1 1.2.2 Heap-based Overflow Crash .................................................................4 1.3 Objective ..........................................................................................................4 1.4 Contribution .....................................................................................................5 1.5 Synopsis ...........................................................................................................6. 2. Related Work .......................................................................................................7 2.1 Static analysis...................................................................................................7 2.2 Runtime Inspection ..........................................................................................8 2.3 System Call Interception Techniques ..............................................................9 2.4 Checkpoint Techniques....................................................................................9 2.5 Fault Triggering and Robustness Testing ......................................................10 2.6 Replay and Debug Parallel Programs ............................................................11. 3. Win32 API Hooking Techniques ......................................................................12 3.1 Injection .........................................................................................................12 3.1.1 Registry ...............................................................................................13 3.1.2 Windows Hooks..................................................................................13 3.1.3 Remote Threads ..................................................................................14 3.2 Interception ....................................................................................................15 3.2.1 Modification of the Import Address Table .........................................15 3.2.2 API patch ............................................................................................17 3.3 The Comparison of API Interception Works .................................................18. 4. Research Method ...............................................................................................20 4.1 Control Flow Anomaly Detection..................................................................20 4.1.1 Stack Corrupt Site Identification ........................................................21 4.1.1.1 Pertinent Registers to a Stack ..................................................22 4.1.1.2 Stack Frame Backtracing .........................................................22 4.1.2 Call Target Validation.........................................................................24 4.2 Tainted Input Tracing ....................................................................................26. 5. Implementation ..................................................................................................28 5.1 System Architecture.......................................................................................28 5.2 Process Rewriting for Function call wrapping...............................................28 5.2.1 Binary Disassembly ............................................................................30 5.2.2 Function Info Parser............................................................................30 vi.
(7) 5.2.3 Instrumentation Library ......................................................................31 5.3 Breakpoint Interrupt.......................................................................................32 5.4 Experience and Further Discussion ...............................................................34 5.4.1 Stack Region .......................................................................................34 5.4.2 Stack Evolvement After Instrument....................................................36 5.4.3 Corrupt Site Approximation .......................................................................37 6. Experiments and Assessment............................................................................39 6.1 Buffer Overflow in RobotFTP Server 1.0......................................................39 6.2 Buffer Overflow in Serv-U 4.1 ......................................................................40 6.3 Buffer Overflow in Palace 3.x client .............................................................40 6.4 Smashing C++ VPTR ....................................................................................41 6.5 Wrapping Coverage .......................................................................................42 6.6 Comparisons ..................................................................................................43. 7. Conclusion and Future Work ...........................................................................47. References...................................................................................................................48. vii.
(8) List of Tables Table 1 Table 2 Table 3. The comparison of API interception techniques..........................18 Wrapping coverage ......................................................................43 Comparison of our work with other dynamic approaches...........44. viii.
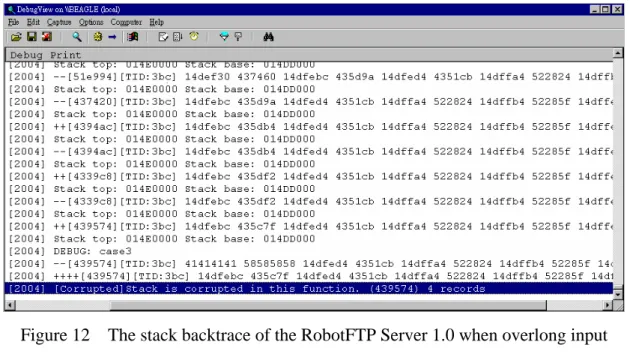
(9) List of Figures Figure 1 Figure 2 Figure 3 Figure 4 Figure 5 Figure 6 Figure 7 Figure 8 Figure 9 Figure 10 Figure 11 Figure 12. An activation record on the stack .................................................................2 A sample program to show the stack overflow crash...................................3 The process of calling a function in another module .................................16 The interception process.............................................................................17 The sample program to demonstrate the crash site and the corrupt site.....22 The operation of stack frame backtracing ..................................................23 A sample program to detect the function pointer anomaly ........................26 The buffer tree constructed during the program execution ........................26 System Architecture ...................................................................................28 The flow of the function wrapping...........................................................29 The instrument scenario of INT 3 instruction ..........................................32 The stack backtrace of the RobotFTP Server 1.0 when overlong input...40. Figure 13 The sample program of smashing C++ VPTR .........................................41 Figure 14 The result of detecting the function pointer anomaly...............................42. ix.
(10) 1. Introduction. 1.1 Motivation Program running behavior has much to do with software security. Especially, crashed software may be exploited to be a potential vulnerability. It is difficult to reconstruct system failures after a program has crashed and much research effort has been taken on detecting program errors and identifying their root causes either by static analysis or observing their running behavior through dynamic program instrument. In order to meet the time to market, software releases with unintended flaws. Some of them cause software crash, while others may introduce security vulnerabilities. Our goal is to design a tool that helps analyze the program running behavior and determine if it is an exploitable vulnerability. We try to intercept and monitor running behaviors during programs in execution when only COTS (Commercial Off-The-Shelf) executables available for analysis. 1.2 Background The purpose of this work is to automatically detect security-related errors from the crash. First of all, we must explain what our so-called “exploitable crash” is. Actually, this concept is much similar to exploiting the vulnerabilities in the programs. Buffer overflow vulnerabilities dominate the security attacks in recent years because it provides the attackers with exactly what they need, the space to inject payload and the change of control flow of the program. In this section, two common kinds of buffer overflow crashes will be explained, including how they are produced, how the attackers can exploit them to alter the control flow and how they can be detected. We cannot generate enough testings to prove inexistence of all bugs. The problem such as strcpy, which will be shown in the following, is well known but exists so far. Although we can swap strcpy with strncpy, it still cannot make our code secure. There still exists many other vulnerable function such as wsprintf() or sprintf() to manipulate the string operations. 1.2.1 Stack-based Overflow Crash Stack overflow is a programming error that might cause the program to be 1.
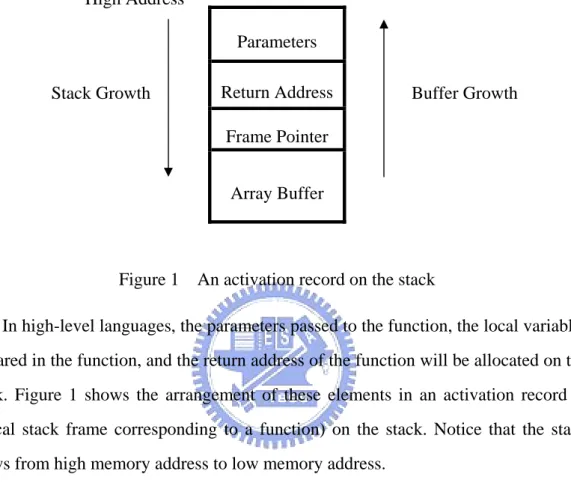
(11) controlled by malicious attackers [17]. When the execution control of the program is taken, the attacker can do anything with the privilege of this program. This programming error is a notorious attack problem for years.. High Address Parameters Stack Growth. Return Address. Buffer Growth. Frame Pointer Array Buffer. Figure 1. An activation record on the stack. In high-level languages, the parameters passed to the function, the local variables declared in the function, and the return address of the function will be allocated on the stack. Figure 1 shows the arrangement of these elements in an activation record (a logical stack frame corresponding to a function) on the stack. Notice that the stack grows from high memory address to low memory address. When a function is called, the parameters passed to the function will be pushed on the stack first. Moreover, the order of the parameters to be pushed on the stack depends on the various calling syntax. Then the “CALL” instruction will be executed by pushing the address of the next instruction after “CALL”, i.e. return address, on the stack. Afterwards, the frame pointer stored in the current EBP will be pushed on the stack. The content of this frame pointer is the address of the previous stack frame and will be used to restore the previous stack frame information at the function exit. The last element to be allocated on the stack is the local variable declared in this function. When an array buffer is declared in this function, it will also be placed here. If the function copies an overlong string without bound checking, the stack overflow occurs. Because of the order of the buffer growth, the overlong string could overwrite the values of the frame pointer and the return address, which may result in the control 2.
(12) flow corruption. The purpose of this work is to detect crashes due to frame pointer and return address overwriting because this vulnerability will be exploited by careful manipulation. Figure 2 is a simple example to show the stack overflow crash. We can obviously see that the return address overwritten alters the control flow.. /* This is a program to show the stack overflow crash. It is intended to overwrite the frame pointer and the return address of the function func with 0x61616161, which is ‘aaaa’ in ASCII. */. #include <stdio.h> #include <string.h>. int func(void) { char str[8];. /* declare a character buffer in func */. strcpy(str, “aaaaaaaaaaaaaaaaaaaa”);. /* copy an overlong string to this buffer */. return 0;. /* func will not return correctly because of stack corruption */. } int main(void) { func();. /* call the vulnerable function */. printf(“Should not see this line.\n”);. /* execution flow is altered, so this message will not be seen */. return 0; }. Figure 2. A sample program to show the stack overflow crash. 3.
(13) 1.2.2 Heap-based Overflow Crash Based on the overwritten of the return address and saved base pointer on the stack, the execution flow can be changed. Heap is the memory region for dynamic data allocated at runtime. Heap-based overflow can also change the execution flow of the program and is more complicated than stack-based overflow. We will introduce how the heap-based overflow overwrites the destination of CALL instruction to change the execution flow and causes programs to crash. The basic method is to pollute a function pointer by the neighboring buffer. Memory objects are often on the heap and through these objects, we can overwrite the pointer of virtual function table [20]. 1.3 Objective We will develop an execution instrument and interception system. This system will instrument the process and perform the detection mechanism to analyze whether the crash is exploitable or not. Usually, the intended attacker does not have source code of the program and uses the debugger to judge whether the program is exploitable or not. Therefore, our instrument process should not need to access the source code. This system will monitor the running behavior of the program when the execution meets the point we instrument. For stack-based overflow crash, we will instrument the prologue and epilogue of the API call and the user function call to record the stack evolvement. By verifying the integrity of the stack-trace made in the prologue and epilogue, we can determine that the stack is corrupted or not and point out the corrupt site of the program. For heap-based overflow crash, we will instrument all the CALL instruction whose destination is determined at runtime. When this type of CALL is executed, we will validate the legality of its target. We want to perform sort of input tracing to find out the path through which the corrupt site is deduced. Through memory-related API call wrapper, we design a data structure to save buffer size and address information. When the stack corrupt site is identified, we can traverse the data structure to find out why the corrupt site occurs due to some specific input data.. 4.
(14) With this tool, we don’t need to step by step execute the program to observe the crash process of a certain crash and judge its exploitability. It will detect two kinds of control state anomaly: saved base pointer / return address and function pointer corruption. We will evaluate our tool with actual known vulnerabilities. 1.4 Contribution The contribution of this thesis is as following: (1) The control flow anomaly detection mechanisms, such as stack corrupt site identification and call target validation, are presented. By using the debugger to analyze a crash, testers have to perform something like single-step executions and observe the running behavior of the program such as stack evolvement with core dump. However, core dump is produced at crash site and the stack has already been corrupted. Therefore, this debugging process is tedious and important actions may be hidden from being observed, such as functions that were called but silently returned before the crash. The mechanisms we proposed serve as measures to automate the process of crash analysis related to the security errors. (2) Our stack corrupt site identification mechanism is helpful to understand why a certain stack-based crash occurs. If the distance between the corrupt site and the crash site is large, it is very likely that testers may miss the corrupt site and do not know what happened until the program crash. Current research often prevents the occurrence of the crash but does not point out where the corruption point is. (3) There is an unusual tricky method to exploit the stack-based buffer overflow vulnerability through the saved base pointer [2, 12]. Our stack frame backtracing approach detects the anomaly of the saved base pointer with limitations. (4) We extensively survey the interception techniques on instrument and intercept programs. Through these techniques our instrument tool monitors their running behaviors in execution when only COTS (Commercial Off-The-Shelf) executables available for analysis on the platform of Microsoft Windows.. 5.
(15) 1.5 Synopsis In Section 2, related work will be presented. We investigate the Win32 API hooking techniques, which will be presented in Section 3. It is discussed in a dedicated chapter because our implementation on process rewriting for function call wrapping use a similar method to one of these injection and interception approaches. Moreover, one of API hooking techniques is utilized to provide tainted input analysis to a certain extent. The research method is explained in Section 4. The implementation issues are presented in Section 5. Finally, the experimental results are in Section 6 and the conclusions in Section 7.. 6.
(16) 2. Related Work. A considerable amount of work has been performed on detecting program errors and identifying their root causes either by static analysis or observing their running behavior through dynamic program instrumentation. In this section we review different works in each category and relate them to our work. 2.1 Static analysis Static analysis is based on the information provided by the source code. It may validate the call sequence to find the program error or check if the vulnerable function call is used without actually executing the application [29]. The drawbacks of this way to find bugs are: (1) there are too many program states to verify, (2) it cannot know some dynamic information such as pointers and should use other inexact measures to analyze [8, 25, 27]. Livshits and Lam proposed a pointer alias analysis with path and context sensitivity for bug detection in C programs [15]. They made an unsound assumption to reduce spurious aliases and speedup the analysis. Our method combines the static binary disassembly analysis and dynamic instrumentation and monitoring to point out where the corruption occurs. Chen and Wagner use a formal approach to examine whether the program violates the pre-defined security properties, which are described by Finite State Automata (FSA) [3]. The programs to be tested are modeled as pushdown automata (PDA) and MOPS uses model-checking techniques to determine the reachability of exception states in the PDA. Liblit and Aiken present an algorithm for computing a set of paths given a crash site and a global control flow graph [14]. Furthermore, it uses some post-crash artifacts such as the stack trace and the event trace to reduce the set of possible execution paths. ARCHER (ARray CHeckER) uses path-sensitive, interprocedural symbolic analysis to bound the value of both variables and memory size [31]. Accesses that violate constraints are flagged as errors.. 7.
(17) 2.2 Runtime Inspection Some works automatically add codes in the source and observe the behavior of these codes at runtime [5, 28]. The difference from our work is that we instrument the runtime process image, not the source. Therefore even if we don’t have the source, we still can detect the program errors, or even add survival patches. Hangal and Lam present DIDUCE for tracking down software bugs using automatic anomaly detection [9]. DIDUCE aids programmers in detecting complex program errors and identifying their root causes. It dynamically formulates hypotheses of invariants obeyed by the program. Our work is also based on runtime inspection, but in different method from DIDUCE. DIDUCE observes the invariants at runtime and check if the program violates them. Binary Rewriting protects the integrity of the return address on the stack by modifying the binary code [19]. The difference from our work is that its detection on stack overflow has false positives when the corruption occurs not in the current stack frame. There is another work presented by Nebenzahl and Wool similar to Binary Rewriting [16]. They developed an anti-stack-smashing defense technique for Microsoft Windows systems. The instrument process, which is called “vaccination” in their paper, is at install-time and does not need access to the source code. But they do not present any results on detecting the known or unknown vulnerabilities of real software. Avijit et al. presented a runtime approach for protection against all known forms of buffer overflow attacks [1]. Their solution consists of two tools: TIED and LibsafePuls. TIED extracts size information of all global and automatic buffers defined in the program from the debugging information produced by the compiler and inserts it back in the program binary as a data structure available at runtime. LibsafePlus performs unsafe C library function wrapping. They combine these two tools to protect any character array operation performed by the unsafe library function. The difference from our work is that they retrieve the array size information from debugging information. However, we observe the runtime behavior of the program. Ruwase and Lam developed a dynamic buffer overflow detector CRED that checks the bounds of memory accesses [22]. It is implemented as an extension of the GNU C compiler version 3.3.1. Their protecting mechanism from 8.
(18) buffer overflow is based on the boundary checking other than stack inspection or call target observation. There is another interesting work of runtime inspection called PointGuard [4]. It is a compiler technique to defend buffer overflows by encrypting pointers when stored in memory, and decrypting them only when loaded into CPU registers. 2.3 System Call Interception Techniques System call interception is the fundamental technique in our work. We have surveyed a lot of system call interception techniques, which are listed in Table 1. Detours developed by Hunt and Brubacher is a library for instrumenting arbitrary Win32 functions on x86 machines [10]. It replaces the first few instructions of the target function with unconditional jump, which points to the user-provided detour function. Users can do the interception work in the corresponding detour function. The instructions removed from the target function are preserved in a corresponding trampoline function. When the target function is called, the control will jump to the detour function. After finishing the interception work, the detour function can call the trampoline function or return to the caller. Pietrek develops API-SPY in his book [18]. API-SPY tools lists API’s name in the order they are called, and record the parameters as well as the return value. The purpose of this work, the same as Detours, is to get control before the intended target function call is reached. However, the technique used in API-SPY is DLL redirection by modifying the Import Address Table (IAT), much different from the way Detours used, which is to modify the target function’s prologue code to transfer control by inserting a JMP instruction at the start of the function. 2.4 Checkpoint Techniques The best way to find software bugs is to reproduce the fault at any time. However, ideally checkpoint the process has some difficulties. We have surveyed some checkpoint techniques in order to achieve some kind of rollback and replay. Liang et al. present NT-SwiFT for software implemented fault tolerance on Windows. 9.
(19) NT [13]. The contribution of this work is that they transparently checkpoint and recover applications on Windows NT for fault tolerance. During checkpointing, NT-SwiFT dumps the user memory space of the application to the physical storage. If the application fails afterwards, users can roll back the state to the last checkpoint in the same process. Srouji et al. also present a system for software fault tolerance on Windows NT platform [26]. The purpose of this work is very similar to NT-SwiFT. However, the main difference between them is that this work tries to reconstruct the system state when rolling back to the checkpoint by re-invoking certain Win32 API calls that change the system state such as CreateThread(), CreateFile(), CreateSemaphore(), etc. Besides, the technique of wrapping Win32 API calls in this work is to modify the address in the IAT, similar to API-SPY. Zandy and Miller perform checkpoints of GUI-based applications on X-window system [33]. The system enables the GUI of any application to transparently migrate to or replicate on another display. It is based on a small X window server extension that enables an application to retrieve its window session from the window server and a library of GUI migration functionality that is injected in the application process at runtime. 2.5 Fault Triggering and Robustness Testing We also survey some fault triggering works because we want to produce a lot of crashes and examine whether these crash are exploitable or not. Ghosh and Schmid present an approach to testing COTS software for robustness to operating system exceptions and errors [7]. That is, they bring up an idea to assess the robustness of Win32 applications. It instruments the interface between the software application and the Win32 APIs. By manipulating the APIs to throw exceptions or return error codes, it analyzes the robustness of the application under the stressful conditions. Whittaker and Jorgensen summarize the experiences of breaking software in their lab [30]. By studying how these software failed, they presents four classes of software failures: improperly constrained input, improperly constrained stored data, improperly constrained computation and improperly constrained output. Software testers can use 10.
(20) the four classes of failures to break the software. An empirical study of the robustness of Windows NT applications using random testing was made by Forrester and Miller [6]. This work designs a special random testing methodology to test the capability of the applications on NT to process the messages and events. It uses SendMessage, PostMessage, or keybd_event and mouse_event to deliver the random input to the running applications. In their experiment result, almost all the applications on the Windows NT cannot handle the random message/event input well. They, furthermore, analyzes two open source software, emacs and mozilla, to see why they failed.. Almost all failures result from. the pointer de-referencing error. Jorgensen adopts different testing methods from other random testing with hostile data streams [11]. It does not feed non-sense input to the application. Instead, it creates lexically, syntactically, semantically deformed files to feed Adobe Acrobat Reader (AAR) and observes if AAR will fail or not. When AAR fails, it uses debug information to inspect the relationship between the values of the registers and the string inserted in the deformed document intentionally. 2.6 Replay and Debug Parallel Programs General debugger is not suitable for debugging parallel programs. Ronsse et al. explains the relationship between execution replay and debugging [21]. The main problem is that parallel programs are non-deterministic: each program run (even with the same input) might result in different program execution. It is so-called non-determinism property of the parallel programs. For example, programs do not determine the sequence of using semaphores for processors. It depends on the competition of processes’ execution at runtime. As a result, when debugging the parallel programs, the execution details should be recorded for the debugger to reproduce the former execution. The purpose is to remove the non-determinism produced in execution time.. 11.
(21) 3. Win32 API Hooking Techniques. API call interception technique is the groundwork of our system. The ability to control API function calls is extremely helpful and enables developers to track down the internal actions happening during the API call. Actually, this is the reason why the title of this work adopts the word “instrument”. The purpose of API call interception is to take control of some execution code. That is the so-called “stub” to force the target application to execute the injected code. Therefore, the injected code can easily monitor the program by parameter logging, return value checking, stack dump, frame pointer tracing, etc. We have investigated some API hooking techniques and the details of these methods will be discussed in the following. There are two roles in the Win32 API hooking system. One is the Hook Server, which injects the Driver, i.e. spying DLL code, into the address space of the target application at some proper time. The other is the Hook Driver, which is injected in the target process’ space to execute the interception work. Usually, the Hook Server should communicate with the Hook Driver. It retrieves the information from the Driver when the Driver performing the interception. In the following, the injection and the interception work we have surveyed will be introduced separately, corresponding to the Server’s and the Driver’s work. 3.1 Injection Dynamic-link libraries (DLLs) are the structural elements of Microsoft Windows. They are separate files containing functions that could be called by programs to perform certain jobs. It is the DLLs that we want to write our spying code in. We can consider them as an extension to the application programs. In Win32, each process has its own address space and its own set of loaded DLLs. The DLL’s file image must be mapped into the address space of the calling thread’s process so that the program could call a function in a DLL. Here comes the problem. How does the application program use our function in the spying DLLs? Since the target application does not have any information about our spying DLL,. 12.
(22) we need to use some tricks to force the DLL into the target process to perform the interception. There are three injection techniques we have studied. 3.1.1 Registry There is a registry key that records the DLL names loaded by the operating system into the address space of each process at the process startup time. We can simply add the DLL name to the value of the following registry hierarchy:. HKEY_LOCAL_MACHINE\Software\Microsoft\WindowsNT\CurrentVe rsion\Windows\AppInit_DLLs. The loading of these DLLs in the above registry key is performed when the USER32.DLL initializes. In its DllMain, USER32.DLL will use the explicit linking, LoadLibrary() call, to map these files into the address space. This is a tedious and. manual way to inject the spy DLL into our target application process and has some disadvantages: 1. Windows has to be rebooted for the activation of the injection. This will add a lot of overhead for our experiments. 2. All the processes that use the USER32.DLL will be injected the spy DLL. We have to add some check code in the spy DLL to avoid injecting to the processes we are not interested in. Furthermore, if the application we are interested in does not use the USER32.DLL such as most console-based applications, this technique fails to inject the spy DLL. 3.1.2 Windows Hooks Installing a windows hook by SetWindowsHookEx() can also force the certain DLLs into the address space of the target processes. The hook is installed as follows: HHOOK SetWindowsHookEx ( int idHook, HOOKPROC lpfn,. 13.
(23) HINSTANCE hMod, DWORD dwThreadId );. The first parameter indicates the type of hook procedure to be installed. The second parameter identifies the pointer to the hook procedure. The third parameter specifies the handle to the DLL containing the hook procedure. Finally, the last parameter specifies the thread to hook. The operating system will automatically inject the DLL containing the hook procedure into the address spaces of all processes influenced by the hook. The advantage of this method is that it can use the UnhookWindowsHookEx() to unload the DLL when the hook is not needed. However, there are still some shortages: 1. The API call made by the target process before the hook is installed will be missed. 2. The spy DLL will not actually be loaded until the some actions performed by the target process trigger the hook procedure. 3. Windows hooks increase much overhead of extra message processing so as to decrease the performance of the whole system. 3.1.3 Remote Threads We adopt this technique in this work. This method is more flexible and trying to force the target application process to call the LoadLibrary() and load the spy DLL. However, the problem is that we don’t have any access to the target process’s thread and trick it to load the DLL for us. In order to overcome this difficulty, we need some Win32 functions that could affect other processes. CreateRemoteThread() is the one. Its prototype is as follows: HANDLE CreateRemoteThread ( HANDLE hProcess, LPSECURITY_ATTRIBUTE lpThreadAttributes, SIZE_T dwStackSize, LPTHREAD_START_ROUTINE lpStartAddress, LPVOID lpParameter,. 14.
(24) DWORD dwCreationFlags, LPDOWRD lpThreadId ); CreateRemoteThread() allows one process to create a thread that runs in the. virtual space of another process. Compared with the CreateThread(), this API just have one more parameter to specify the process that will contain the newly-created thread. The lpStartAddress parameter identifies the memory address of the thread function, which will be executed after the remote thread has been created. We can use GetProcAddress() to retrieve the address of the LoadLibrary() API and consider it. as thread function to load our spy DLL. Because KERNEL32.DLL is always mapped to the same address of every process, the address of the LoadLibrary() API will be correct for sure. Therefore, we can succeed to ask the target process to execute LoadLibrary() on our behalf.. In Matt Pietrek’s work, he does not use the CreateRemoteThread() API.. Instead, he modifies the target process’s memory and registers so that it look like the process is calling LoadLibrary() on its own. The advantage is that his method is portable to the platforms that do not support CreateRemoteThread(). 3.2 Interception After injecting the Hook Driver (spy DLL code) into the target process’s address space, what we have to do next is to intercept the API call. That is, the injected DLL should be responsible for accomplishing all the preparation for interception. In the following, three interception techniques we surveyed will be introduced. 3.2.1 Modification of the Import Address Table This technique is based on the fact that Win32 executables files and DLLs are built on the neat structure of Portable Executable (PE) file format, which is an extension of Common Object File Format (COFF). PE file format consists of several logical chunks called sections. Each section stores a specific type of data. For example, the .text section contains all general-purpose code produced b the compiler. 15.
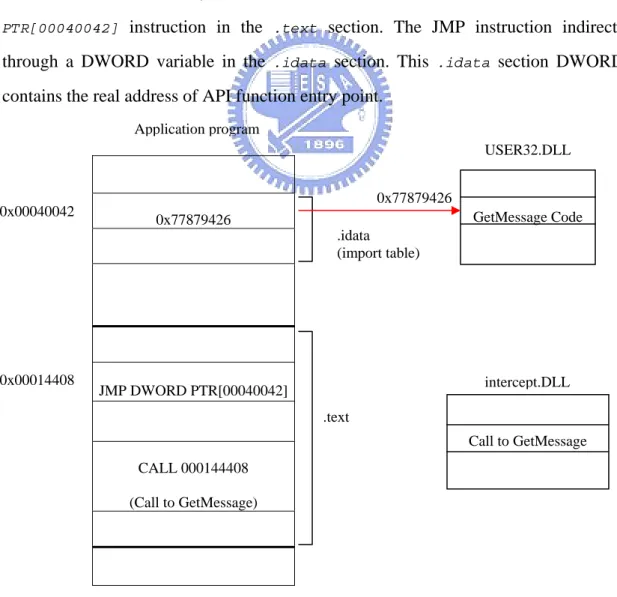
(25) or assembler; the .edata section is a list of the functions and data that the PE file exports for other modules. In order to implement the API interception, we should pay more attention on the .idata section, which contains information about functions that the module imports from other DLLs. An important table resided in this section (so-called Import Address Table) contains file-relative offsets to the names of imported functions referenced by the executable’s code. When the program is loaded to the memory, the addresses in the IAT will be patched to the real addresses of the imported functions. Figure 3 shows the process of calling a function in another module. When you call a function in another module (for example, GetMessage in USER32.DLL), the CALL instruction produced by the compiler does not transfer control directly to the function in DLL. Instead, the call instruction transfer control to a JMP DWROD PTR[00040042] instruction in the .text section. The JMP instruction indirects. through a DWORD variable in the .idata section. This .idata section DWORD contains the real address of API function entry point. Application program USER32.DLL 0x77879426. 0x00040042. GetMessage Code. 0x77879426 .idata (import table). 0x00014408. intercept.DLL. JMP DWORD PTR[00040042] .text. Call to GetMessage CALL 000144408 (Call to GetMessage). Figure 3. The process of calling a function in another module 16.
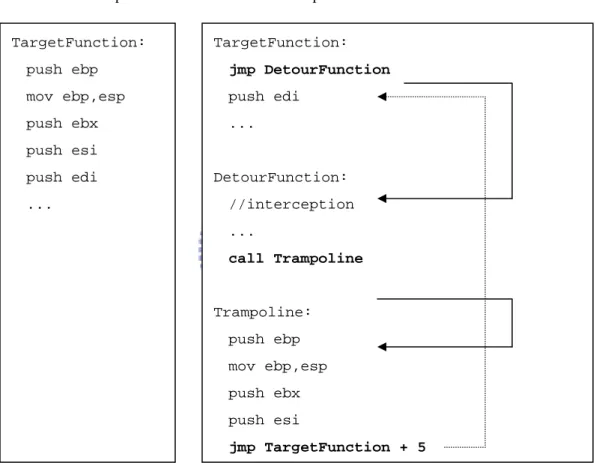
(26) 3.2.2 API patch This method directly modifies the API function itself. One approach is to replace the first byte of the target API with a breakpoint interrupt instruction (INT 3). Any call to the target API will generate an breakpoint exception, and the operating system will inform your API interceptor, which serves as a debugger of the target process, to handle it. The shortcoming of this approach is the overhead caused by Windows exception handling mechanism. Before Interception TargetFunction:. After Interception TargetFunction:. push ebp. jmp DetourFunction. mov ebp,esp. push edi. push ebx. .... push esi push edi. DetourFunction: //interception. .... ... call Trampoline. Trampoline: push ebp mov ebp,esp push ebx push esi jmp TargetFunction + 5. Figure 4. The interception process. Another approach to perform API patch is to modify the first few bytes of the target API with the control-transfer instruction JMP. Actually, our process rewriting mechanism to hook the user function, which will be described in Section 5, adopts this approach. Detours is an implementation of the API patch mechanism, and the following Figure 4 explains the interception process through the terms used in Detours. When execution reaches the target function, control jumps directly to the 17.
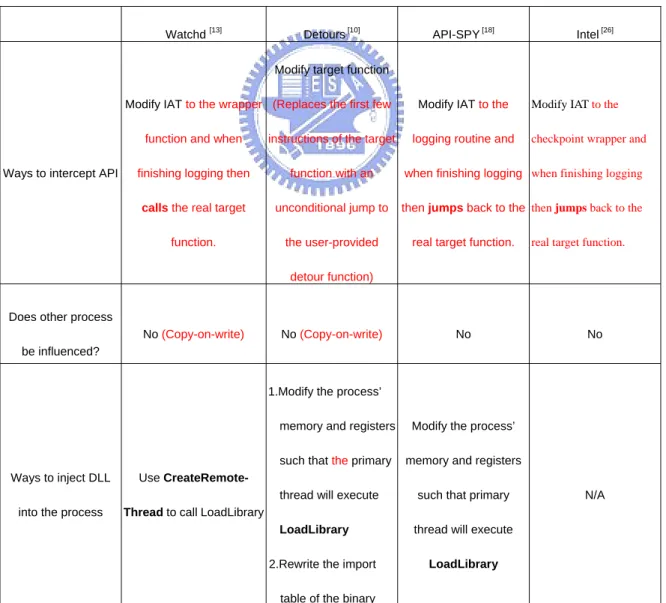
(27) user-supplied detour function. After the detour function performs the interception work, it calls the trampoline function, which consists of the initial instructions from the target function and a jump to the remainder of the target function. 3.3 The Comparison of API Interception Works According to the ways of injection of users’ DLL into the target process and interception mechanisms, there exists some different kind of works for different purposes. Table 1 compares these surveyed interception work. After the consideration about stack frame evolving due to added monitor function and the completeness of the API interception mechanism, Detours is chosen to be the framework of this work.. Table 1. The comparison of API interception techniques. Watchd. [13]. Detours. [10]. API-SPY. [18]. Intel. [26]. Modify target function Modify IAT to the wrapper (Replaces the first few. Ways to intercept API. Modify IAT to the. Modify IAT to the. function and when. instructions of the target. finishing logging then. function with an. when finishing logging when finishing logging. calls the real target. unconditional jump to. then jumps back to the then jumps back to the. function.. the user-provided. logging routine and. real target function.. checkpoint wrapper and. real target function.. detour function) Does other process No (Copy-on-write). No (Copy-on-write). No. No. be influenced? 1.Modify the process’. Ways to inject DLL. Use CreateRemote-. into the process. Thread to call LoadLibrary. memory and registers. Modify the process’. such that the primary. memory and registers. thread will execute LoadLibrary 2.Rewrite the import table of the binary. 18. such that primary thread will execute LoadLibrary. N/A.
(28) 1.CreateProcess. Use their own loader to. Ways to Launch CreateProcess. 2.System loader loads. CreateProcess. load app.exe. app.exe app.exe Where to log. (Command line loader). In the user-provided. In the logging routine of. detour function. the stub. In the wrapper function parameters. In the wrapper function. The target function directly returns to Get the return of the target. Get the return of the. function directly in the. target function directly. app.exe,so it’s not easy. Ways to get the Return value. N/A to get the return value.. wrapper function.. in the detour function. (Using the “return address stack”) Yes, after reading the. Can determine which. No (Should write user. No (Should write user. configuration file, it. API to intercept by the. code in the DLL to be. code in the DLL to be. dynamically allocates. configuration file. injected). injected). memory (so-called. N/A. stub) for each function N/A (It can be done in Does save registers. the detour function by. Yes (Use “pushad” and. Yes (Save/restore the. using “pushad” and. “popad” in the stub). registers in the stub). No before interception. “popad”.). 19.
(29) 4. Research Method. Our research uses the following approaches to manifest and analyze the crash process as precisely as possible. 4.1 Control Flow Anomaly Detection If programs crash, programmers and hackers are eager to find the bugs. There are two main causes of a crash. The first is accessing data in an invalid address, for example, null pointer assignment. The second is transferring control to an invalid address, often due to buffer overflow. The latter is the more serious in the two cases. In this situation, we can transfer the control of the program by overwriting the following data: (1) Return address: The corruption of this data belongs to stack-based control flow anomaly and will be detected by our stack corrupt site identification mechanism. When the current function returns, the program transfers the control to the code designated by the return address. By overwriting the return address, we can jump to any position in the process. After the function returns, the control flow will be intercepted. This is the popular target of buffer overflow exploit. (2) Saved base pointer: The corruption of this data also belongs to stack-based control flow anomaly and will be detected by our stack corrupt site identification mechanism. Saved base pointer points to the previous stack frame. If the saved base pointer is overwritten, the process will have a fake frame after returning from the current function and will jump to the fake return address. (3) Function pointer: This data may be in the stack or heap and will be detected by our call target validation mechanism. When overwriting the function pointer, the process will jump to an arbitrary position. Overwriting the virtual function pointer in the heap is also a common vulnerability in C++ program. The entire control flow anomaly caused by overwriting these data mentioned above would be detected by the following two mechanisms. Some limitations will be described in the Section 6.. 20.
(30) 4.1.1 Stack Corrupt Site Identification When the program crashes, by inspecting it using the debugger we know the instruction where the program stops running. The point where the program stops running abnormally is the crash site. When the stack-based overflow occurs, the stack is “corrupt” for the saved base pointer and the return address corresponding to a certain function is overwritten. This is the point where the stack becomes abnormal. At some later time, this program must either crash or be exploited. The goal of the stack corrupt site identification is that right after the control flow of the program has been changed, we identify where the corrupt site is as precisely as possible. Figure 5 is a sample program to demonstrate the distinction between the crash site and the stack corrupt site. Function main passes the pointer of its local buffer buff to function a, and then function a passes it to function b. In function b, after strcpy() finishes copying the overlong string to main’s local buffer, the stack is. corrupt. However, the program has not yet crashed until the function main returns. Obviously, the debugger could not specify the distance between the stack corrupt site and the crash site.. #include <stdio.h>. void b(char *buff){ strcpy(buff, “AAAAAAAAAAAAAAAAAAAAAA”); /* overlong string */ /* stack corrupt site */ ...... } void a(char *buff){ b(buff); } void main(){ char buff[4];. 21.
(31) a(buff); }. /* crash site */. Figure 5. The sample program to demonstrate the crash site and the corrupt site. In the following sub-sections, the mechanism to identify the stack corrupt site is described. 4.1.1.1 Pertinent Registers to a Stack In order to understand the operation on a stack, we should know some specific assembly language knowledge. Normally, there are three registers that are pertinent to the operation on a stack: EIP, EBP and ESP. EIP is the extended instruction pointer. It stores the address of the current instruction we are executing. When we call a function, this address will be pushed on the stack. We call the saved EIP the return address (RET). When exiting the function, the control flow will go back to RET for later execution. ESP is the extended stack pointer. It points to the current position on the stack. When we use push or pop instruction to add or remove data on the stack, ESP will change as well. Moreover, we could change the ESP by direct stack pointer manipulation. Finally, EBP is the extended base pointer. It is used to access the stack data such as local variables and offsets in a function and should keep the same throughout the lifetime of the function. 4.1.1.2 Stack Frame Backtracing Stack frame backtracing employs the fact that saved base pointer points to previous saved base pointer in the stack. Typically, the function prologue is used to allocate the space on the stack for local variables. The following short disassembly shows how the compiler decided to implement the allocation of stack variables. // function prologue PUSH EBP. // save old frame pointer. MOV EBP, ESP. // the current EBP points to the saved EBP. SUB ESP, X. // stack variables allocation with X bytes 22.
(32) The old EBP is pushed on the stack, and then the current EBP is overwritten by the address of stack pointer, which points the top of the stack. That is, the current EBP points to the previous saved EBP. If we continuously trace back the saved EBP, the tracing will reach the saved EBP of main function. We utilize stack frame backtracing to verify that the call stack is sound and furthermore identify the stack corrupt site when the stack-based overflow occurs. We define our term “stacktrace”. In Figure 6, function A invokes function B. Therefore, the stack frame of function A is in the higher address and the stack frame of function B is in the lower address. Now assume that the EBP register points to the saved base pointer of function B. If we perform the stack frame backtracing, we will generate a stacktrace, which comprises {(SavedEBP, RET)B, (SavedEBP, RET)A, …, (SavedEBP, RET)Main}. Actually, this sequence could be understood easily by realizing that the main function calls some other functions and then some other functions call function A, and then function A calls function B. High Param 2 Func A. Param 1 RET SavedEBP. Local var. Param 2 Func B. (1) FuncA invokes FuncB. (2) FuncB’s saved base pointer points to FuncA’s saved base pointer. (3) Current EBP register points to FuncB’s saved base pointer.. Param 1 RET SavedEBP. Local var. Low. Figure 6. The operation of stack frame backtracing. We first insert a monitor function in the function’s prologue and epilogue separately to perform the detection mechanism and we have to ensure that this monitor function will not disturb the original program’s normal execution. What this 23.
(33) monitor function performs in the function’s prologue and epilogue is as following: (1) In the prologue: ‧Reserving all the registers ‧Using the current EBP to enforce stack frame backtracing ‧Restore all the registers (2) In the epilogue: ‧Reserving all the registers ‧Using the current EBP to enforce stack frame backtracing ‧Comparing the stacktrace with the prologue’s stacktrace and point out the difference ‧Restore all the registers To detect the stack corruption, we compare the stacktraces generated in a certain function’s prologue and epilogue. If the stacktraces are different, there must exist some stack buffer in a certain function growing out of bound so that the return address or the saved EBP corresponding to that function is overwritten. 4.1.2 Call Target Validation This mechanism is designed for the control flow anomaly resulted from the function pointer overwritten. We instrument the application process at the point where each CALL instruction is. With this instruction-grained instrument, we insure that each CALL instruction is transferring control to the normal function entries. We use the software interrupt to enforce this instrument. We overwrite the first byte of the CALL instruction with breakpoint interrupt instruction (INT 3), and install a corresponding exception handler. When an INT 3 instruction is executed, it generates a Debugger Breakpoint Exception, and the handler gains control to perform call target validation. After finishing the validation, we will restore the original EIP and CALL instruction. According to the way of the CALL target is determined, we divide the CALL instruction into four types: API call, relative call, memory call and register call. The former two types of CALL instruction does not need to instrument the INT 3 24.
(34) instruction because typically these CALL targets will not be overwritten. The term “static calls” will be used to represent these two calls in the following text. For the memory call and register call, the target of them will be determined at runtime. We only instrument these “dynamic calls”. The details of the implementation of this software interrupt will be described in Section 5. The steps of the call target validation are as following. (1) Off-line parse the disassembly of the program to get the CALL information. ‧Recognize the CALL type as either static or dynamic. ‧Retrieve the function entries and the callsites of valid jump instructions. (2) There are some INT3 instructions in the original programs, and we just handle the INT 3 we have inserted. (3) According to the information parsed at step (1), we could compute the CALL target address at runtime. (4) When the call target computed at step (3) matches one of the function entries retrieved at step (1), this call target is valid.. #include <stdio.h>. void a(void) { printf("a was called.\n"); } void b(void) { printf("b was called.\n"); } int main(void) { void (*p)(void); p = a; (*p)(); *p = (void (__cdecl *)(void))0x12345678; (*p)(); 25.
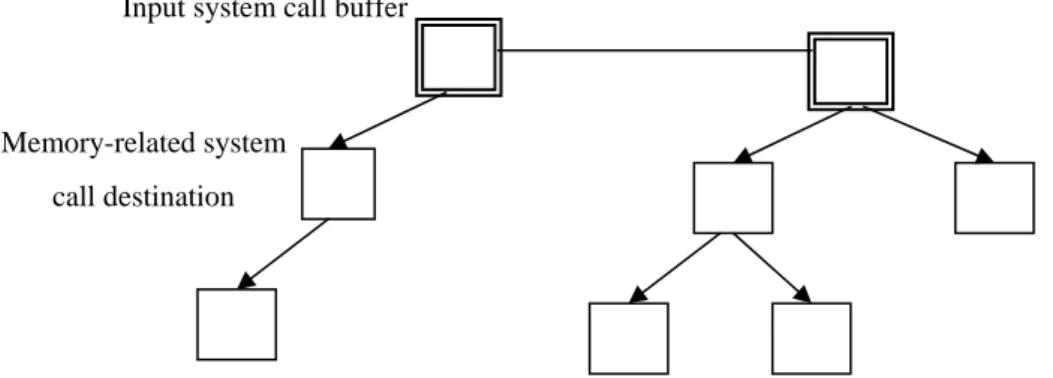
(35) return 0; }. Figure 7. A sample program to detect the function pointer anomaly. We could see a sample program in Figure 7. The function pointer p declared in main is assigned in turn the address of function a and an invalid value 0x12345678. When the function a is called through function pointer p, the call target is valid. However, when the next 0x12345678 is called, we detect that this call target is invalid because it does not match any function entries in this program. 4.2 Tainted Input Tracing Establishing the bridge connecting the software robustness and security is a brand-new and fantastic idea in the research area of software testing. Traditional testing techniques are well equipped to find the bugs that violate the specification, but lack of looking for how these bugs relate to the security issues. For example, there are plenty of application crashes during our everyday life and you may wonder whether bugs leading to these crashes are security-related.. Input system call buffer. Memory-related system call destination. Figure 8. The buffer tree constructed during the program execution. Input tracing mechanism combines the function wrapping techniques and the stack overflow detection with the maintenance of the runtime buffer tree. First of all, I/O related API call such as ReadFile would be intercepted to create the root buffer. 26.
(36) for those parameters related to the input. Second, when memory related API calls, such as lstrcpyw, are invoked, its destination memory buffer will be added as a child node of the root buffer. The buffer tree is shown in Figure 8. Finally, when stack corruption occurs, this system will traverse the whole buffer tree and compare the buffer address to the corrupted stack address. If these two addresses matches, the path to the suspect buffer will be printed out. And this path stands for the input pollutant flow causing the stack to be corrupted. That is, malicious users may have capability of putting their payload on the stack.. 27.
(37) 5. Implementation. The instrument tool mentioned above helps testers to know why the programs crash by observing the stack and input tracing. Furthermore, to manifest the exploit process of the known vulnerable programs is another proof that this tool is useful. Using the log of runtime monitoring on the running applications, this tool can help analyze why this software is exploitable. 5.1 System Architecture There is an instrument tool to communicate with the API/function wrapper DLL that is injected into the target process. During the execution of the application program, testers may want to modify the parameter or return values of a certain suspicious functions. Figure 9 shows the system architecture. Kernel Send requests to modify some values Receive monitor results. User Space . The instrument tool. Wrapper . Figure 9. DLL. System Architecture. 5.2 Process Rewriting for Function call wrapping For purpose of monitoring the stack frame evolving and tracing EBP/return pair, however, API call interception still seems too coarse to pinpoint the reason why the application programs crash. Actually speaking, the most ideal scenario for crash analysis is to figure out which line of code is the onset of bugs, and it is impossible without source code. What we can do furthermore is to wrap user functions to achieve the finer-grained monitoring. 28.
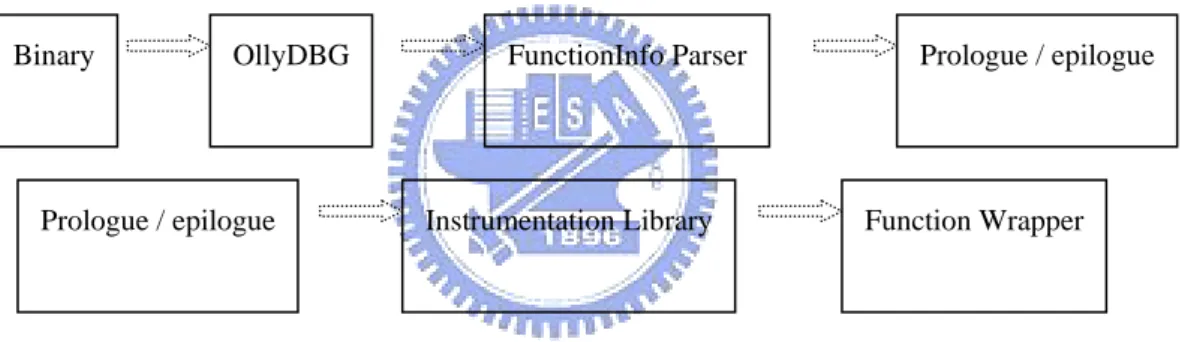
(38) Function call wrapping is especially helpful to catch the site resulting in crashes happening on the stack. For instance, if a function in a program does some string manipulation without careful bound checking, it may crash when the string in process is out of bound. Such vulnerabilities bring about the classic and simple attack, i.e. stack overflow. By overwriting the return address through stack variables overflowing, the attacker can intercept the programs when this function returns. Therefore, the control jumps to a location where the attacker would have inserted malicious code. To deserve to be mentioned, buffer overflow attack is a kind of injection/interception mechanism. Compared with the API interception techniques mentioned above, buffer overflow cannot successfully return back to the correct site after some destructive activities since the return address and the stack is overwritten. Figure 10 shows the flow of the function call wrapper generation.. Binary. OllyDBG. Prologue / epilogue. FunctionInfo Parser. Instrumentation Library. Prologue / epilogue. Function Wrapper. Figure 10 The flow of the function wrapping The principle of function wrapping is similar to what Detours does in the API call interception. Detours replaces the first few instructions of the target API with unconditional jump to the user-provided monitor function. The primary difference between Detours and this function wrapper is as follows: (1) Detours acquires the API call entry address from static linking. However, this function wrapper acquires the user function from the disassembly of the binary code of the application program through the FREE tool named “OllyDBG” [32]. (2) Detours only instruments the prologue of the API call. However, this function wrapper instruments both the prologue and epilogue of the user function. Comparing the stack tracing in a function’s entry and exit is extremely helpful to detect the anomaly of the stack. 29.
(39) 5.2.1 Binary Disassembly Our research method relies heavily on the disassembly ability of OllyDBG, which is a 32-bit assembler level analysing debugger for Microsoft® Windows®. It does much work on binary code analysis that we could utilize especially when the source is not available. It could recognize procedures, API calls, and complex code constructs, like call to jump to procedure. These analyses help us parse the disassembly of the application to retrieve the necessary information such as procedure call site, entry address, etc. In addition, it could disassemble all the executable modules the application loads. 5.2.2 Function Info Parser In order to transfer control from the execution of the application process to our runtime-generated stub, we need to replace instructions at the function prologue and epilogue with a JMP to the stub. The type of the procedures we recognize is the typical function prologue and epilogue, which will do operations on the stack and frame pointer. Our function info parser retrieves prologue/epilogue information that is needed by the instrument library. In typical C/C++ programs, the compiler will generate the prologue as “ PUSH EBP” “ MOV EBP, ESP” and the epilogue as “POP EBP” “RET (const)”. The prologue is 3 bytes and the epilogue is at most 3 bytes. Therefore,. we need to look the instructions following the prologue and the instructions above the epilogue until the space is enough to put a JMP instruction. The following example is the result of parser: > 60F71213 558BEC8B4508 6 60F71243 5DC3 2 60F71248 0FB60A2BC15DC3 7 60F71251 5DC3 2 < The first line is the needed information of a prologue. The first field is the entry. 30.
(40) address of this prologue. The second field is the binary code of this prologue that will be overwritten by the instrument library. When instrumenting this prologue, the instrument library will check the third field that is the length of the binary to be replaced. If the length is less than 5 bytes, it means that there is not enough space to substitute the prologue for the JMP instruction and we leave this kind of procedure to breakpoint interruption instruction instrumentation if needed. The second lines to the last line of this function information are the epilogues. There may be multiple return site of this function, but not all of them have enough space to be instrumented. When looking for more space for instrumenting the JMP instruction, we have to exclude the following situations that might disturb the correct execution of the target program. When the instructions following the prologue or the instructions above the epilogue should not be: (1) JMP / CALL related instruction (2) JMP target such as the following example push ebp mov ebp,esp x:. push edi .... .... jmp x. The reason is that if we have to move these instructions to our stub, and the control flow of the original program is disturbed, which will result in the software failure even program crash. 5.2.3 Instrumentation Library We develop an instrumentation library to replace the certain functions at runtime. According to the information provided by the function info parser, the instrumentation library will allocate the space for the stub and append the intended instructions on the stub. The most important instruction is to CALL the monitor function where we could backtrace the stack for corruption detection. Detours provides some useful library to 31.
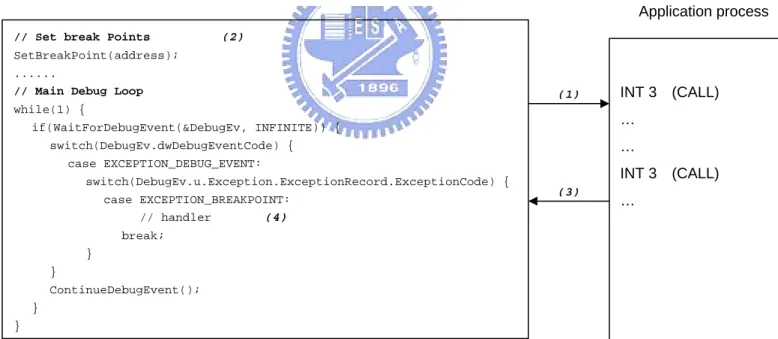
(41) append the certain instruction on the stub. 5.3 Breakpoint Interrupt We use the breakpoint interrupt instruction to instrument each CALL instruction in the program we are interested in to enforce the call target validation mechanism. We overwrite the first byte of the CALL instruction with INT 3, and install a corresponding exception handler. When an INT 3 instruction is executed, it generates a Debugger Breakpoint Exception, and the handler gains control to perform call target validation. After finishing the validation, we will restore the original EIP and CALL instruction. (1) The instrument tool creates/attaches the application process. (2) Replace the first byte of the CALL instruction with INT 3. (3) When trapping to OS, the instrument tool uses Win32 Debug API to handle breakpoint exception. (4) The handler performs the call target validation. Application process // Set break Points. (2). SetBreakPoint(address); ...... // Main Debug Loop. (1). while(1) {. INT 3 (CALL) …. if(WaitForDebugEvent(&DebugEv, INFINITE)) {. …. switch(DebugEv.dwDebugEventCode) { case EXCEPTION_DEBUG_EVENT:. INT 3 (CALL). switch(DebugEv.u.Exception.ExceptionRecord.ExceptionCode) { (3). case EXCEPTION_BREAKPOINT: // handler (4). …. break; } } ContinueDebugEvent(); } }. Figure 11 The instrument scenario of INT 3 instruction The scenario of this instrument process is shown in Figure 11. The whole instrument process consists of four steps. First, the instrument tool will create the application process. Second, it replaces the first byte of the CALL instruction with INT3. Third, when the application process is executing the INT 3 we have inserted in, the control will trap to operating system. Then the instrument tool uses Win32 Debug 32.
(42) API to handle the breakpoint exception. Last, what we have to do is perform the call target validation in the corresponding handler. When the application process is executing the INT 3 instruction we have inserted in, the EXCEPTION_DEBUG_EVENT debug event is generated. A debug event is an object used to communicate with debugger, which is the role we are playing. When a debug event is generated in the target application process, the operating system will inform us to handle this. We will use WaitForDebugEvent() to acquire the debug event and information about the event in a DEBUG_EVENT structure. This structure is defined as following: typedef struct _DEBUG_EVENT { DWORD dwDebugEventCode; DWORD dwProcessId; DWORD dwThreadId; union { EXCEPTION_DEBUG_INFO Exception; CREATE_THREAD_DEBUG_INFO CreateThread; CREATE_PROCESS_DEBUG_INFO CreateProcessInfo; EXIT_THREAD_DEBUG_INFO ExitThread; EXIT_PROCESS_DEBUG_INFO ExitProcess; LOAD_DLL_DEBUG_INFO LoadDll; UNLOAD_DLL_DEBUG_INFO UnloadDll; OUTPUT_DEBUG_STRING_INFO DebugString; RIP_INFO RipInfo; } u; } DEBUG_EVENT, *LPDEBUG_EVENT;. The member dwDebugEventCode identifies the type of debug event. The dwProcessId member is the identifier of the process in which the debugging event. occurs. The union u provides additional information relating to the debug event. The way to retrieve the additional information is determined by the dwDebugEventCode member. 33.
(43) We use WaitForDebugEvent() and ContinueDebugEvent() to handle the debug event. The WaitForDebugEvent() blocks the our instrument tool and waits for a debug event to occur in a process being debugged. When the debug event occurs, the system suspends all threads in the process being debugged. Its prototype is as following: BOOL WaitForDebugEvent( LPDEBUG_EVENT lpDebugEvent, // debug event information DWORD dwMilliseconds. // time-out value. );. The second parameter describes the number of milliseconds to wait for a debug event. If a debug event does not occur in this time, the function times out and returns FALSE. If a debug event occurs then the function returns TRUE and puts the information about event type into the DEBUG_EVENT structure. Then we check the event type. If it is the event corresponding to INT 3, we perform the call target validation measure as described in Section 5. After our code for validating the call target, we have to use the ContinueDebugEvent() to resume the thread execution and wait for next event to occur.. 5.4 Experience and Further Discussion. When implementing this instrument tool, we encounter some issues that are not intuitively simple to overcome. We address these issues in this sub-section and describe our solutions and experience.. 5.4.1 Stack Region When performing stack frame backtracing, we need to figure out when to stop tracing the frame pointer. The straightforward idea is that the frame pointer should not point to the address that is out of stack region. At first, we try to use VirtualQueryEx() API to retrieve the meta-data of a stack region. It provides information about a region of consecutive pages beginning at 34.
(44) a specified address that share the same attributes. VirtualQueryEx() determines the attributes of the first page in the region and then scans subsequent pages until it scans the entire range of pages, or until it encounters a page with a non-matching set of attributes. Because of our wrong assumption that the whole stack region shares the same attributes, we make a serious mistake on determining the stack upper boundary. Therefore, in this wrong implementation we did not traverse the whole stack and missed many stack frames to check. Our solution to overcome this problem is to use Thread Information Block (TIB) to identify when to stop backtracing the frame pointer. TIB is a key system data structure in Microsoft Windows and there are many data related to threads inside it, including a pointer to the thread’s structured exception handler list, the location of the thread’s stack and the location of the thread local storage. Furthermore, each thread in the system has its corresponding TIB. In all Intel-based Win32 implementations, the FS register points to the TIB. As a result, we have to look at what the FS register points to for getting the information hidden in the TIB. For example, FS:[0] points to the structured exception handling chain, while FS:[2C] points to the thread’s local storage array. The information we needed to judge the stack region is pvStackUserTop and pvStackUserBase field in the TIB. The 04h DWORD pvStackUserTop filed contains the linear address of the topmost address of the thread’s stack. This thread should not have a stack pointer value that is greater than or equal to the value of this field. The 08h DWORD pvStackUserBase field contains the linear address of the lowest committed page in. the thread’s user mode stack. As the thread uses successively lower addresses in the stack, those pages will be committed, and this field will be updated accordingly. The 18h DWORD ptibSelf field holds the linear address of the TIB. We use this data to access the pvStackUserTop and pvStackUserBase structure. The following code is to demonstrate how to access these system data structure. PTIB pTIB; __asm { mov EAX, FS:[18h] 35.
(45) mov [pTIB], EAX }. Therefore, we could use pTIB->pvStackUserTop and pTIB->pvStackUserBase to set the boundary when performing stack frame backtracing. 5.4.2 Stack Evolvement After Instrument We need to explain more about the stack evolvement after our code is instrumented. The instrument library replaces certain functions at runtime. It will allocate the space for the stub and append the instructions used to perform stack frame backtracing on the stub. The instruction to call the monitor function will add a stack frame on the stack, and this stack frame is not our concern. The instrument library inserts a JMP instruction in the prologue and epilogue and the inserted JMP instruction in prologue jumps to the following stub code: PUSH addr CALL Monitor_Function ADD ESP, 4. // Instructions which is recognized by parser and moved from the original prologue PUSH EBP MOV EBP ……. // Jump back to the next instruction after prologue recognized by the parser JMP Next_inst_after_prologue. The PUSH addr instruction is intended to pass a parameter addr, which is the address of the prologue, to the Monitor_Function but it adds 4 bytes on the stack. Afterward, the CALL Monitor_Function instruction pushes the return address of monitor function on the stack. After calling the monitor function, its saved base pointer will also pushed on the stack. Therefore, in the monitor function we should access the return address of the wrapped function by adding 12 bytes as following: unsigned long ret = *(unsigned long *)(EBP+12);. Similarly, the inserted JMP instruction in the epilogue jumps to the following 36.
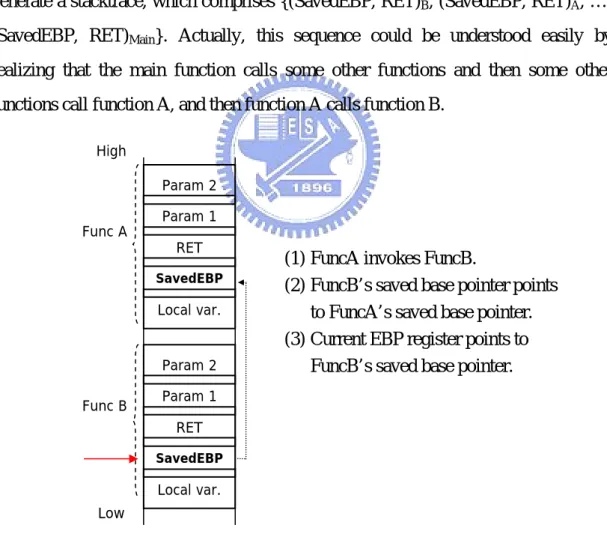
(46) stub code: ...... PUSH addr CALL Monitor_Function ADD ESP, 4. // Instructions which is recognized by parser and moved from the original epilogue ...... POP EBP RETN. The stack evolvement in the epilogue is similar to that in prologue. Therefore, access to the return address and saved base pointer of the wrapped function is the same as that in prologue and is not trivial as well. 5.4.3 Corrupt Site Approximation Because of insufficient space to instrument a JMP instruction to prologue and epilogue, we do not wrap all the typical functions in the target program. Therefore, some corrupt site approximation could be discussed to increase the precision of the corrupt site identification. For a certain wrapped function, its stacktraces performed in prologue and epilogue will fall in one of situations below under an assumption: a “normal” stacktrace is defined. (1) If the stacktrace in the prologue is normal but the stacktrace in the epilogue is abnormal, it means that the stack is corrupted in this wrapped function. (2) If the stacktraces in the prologue and epilogue are normal, it means that the stack is not yet corrupted. (3) If the stacktrace in the prologue is abnormal, it means that no matter the stacktrace in the epilogue is normal or not, the stack is corrupted in one of the previous functions. Case 3 can be divided into two situations. (i) If the stacktrace in current wrapped function’s prologue and the stacktrace in the 37.
數據
+7

相關文件
A factorization method for reconstructing an impenetrable obstacle in a homogeneous medium (Helmholtz equation) using the spectral data of the far-field operator was developed
A factorization method for reconstructing an impenetrable obstacle in a homogeneous medium (Helmholtz equation) using the spectral data of the far- eld operator was developed
Since we use the Fourier transform in time to reduce our inverse source problem to identification of the initial data in the time-dependent Maxwell equations by data on the
Following the supply by the school of a copy of personal data in compliance with a data access request, the requestor is entitled to ask for correction of the personal data
For the data sets used in this thesis we find that F-score performs well when the number of features is large, and for small data the two methods using the gradient of the
We showed that the BCDM is a unifying model in that conceptual instances could be mapped into instances of five existing bitemporal representational data models: a first normal
After the desired content has been identified, the control point needs to determine which transfer protocol and data format should be used to transfer the content from the
To convert a string containing floating-point digits to its floating-point value, use the static parseDouble method of the Double class..
