國
立
交
通
大
學
生物資訊所
碩
士
論
文
結構功能區域交互同源性為基之蛋白質功能區域
及交互作用預測
Inferring Domain Annotated Protein-Protein Interactions
through 3D-Domain Interologs
研 究 生:陳永強
結構功能區域交互同源性為基之蛋白質功能區域及交互作用預測
Inferring Domain Annotated Protein-Protein Interactions through
3D-Domain Interologs
研 究 生:陳永強 Student:Yung-Chiang Chen
指導教授:楊進木 Advisor:Jinn-Moon Yang
國 立 交 通 大 學
生 物 資 訊 所
碩 士 論 文
A Thesis Submitted to Institute of Bioinformatics
National Chiao Tung University in partial Fulfillment of the Requirements for the Degree of Master in
Bioinformatics
July 2006
Hsinchu, Taiwan, Republic of China
中華民國九十五年七月
結構功能區域交互同源性為基之蛋白質功能區域及交互作用預測
學生:陳永強 指導教授:楊進木
國立交通大學生物資訊所碩士班
摘 要
蛋白質間的交互作用在生物體內複雜反應途徑中扮演重要角色之一。在後基因體時 代,具備大規模找尋蛋白質蛋白質交互作用的能力是深入了解蛋白質網路的主要途徑之 一。Lu 等人提出”交互作用同源性對應(interologs mapping)”,大規模預測蛋白質蛋白質 交互作用 — 即利用計算比較基因體學的方法,將大量蛋白質交互作用註解從一個物種 對應到另外一個未經實驗方法註解的物種上。然而,在蛋白質交互作用中,通常都是經 由特定的功能區域(domain)作物理性接合進而執行功能。目前解蛋白質結晶結構的速度 日益進步,這些實驗資料使得目前十分適合利用已知結構蛋白質複合體預測蛋白質-蛋 白質交互作用。 在此研究中,我們提出一個新的觀念 “結構功能區域交互同源性對應(3D-domain interologs mapping)”,預測蛋白質功能區塊及交互作用。結構功能區域交互同源性對應 的定義為” 在一個已知結構的蛋白質結構上,蛋白質 A 的功能區域 a 與蛋白質 B 的功能 區域b 作物理接合,則他們在同一個物種中的同源蛋白質 A’(具有功能區域 a)以及 B’(具 有功能區域 b)可能會發生交互作用”。我們主要的創新在於能夠快速的在數百個物種中 進 行 基 因 體 規 模 的 蛋 白 質 交 互 作 用 預 測 , 並 且 發 展 一 個 新 的 成 對 位 置 加 權 矩 陣 (pairPSSM)。這個矩陣能夠利用演化式側寫提供不同的胺基酸對出現在某個特定位置的 統計意義,使記分系統更加準確。我們的方法在分辨真實蛋白質複合體及不具生物意義 蛋白質對的測試中可以達到將近九成的正確率。另外我們也嘗試預測酵母菌的蛋白質交 互作用,和過去方法相比我們能夠提昇將近一成的預測準確率,而且這些蛋白質交互作 用的平均基因表現相關性明顯高於不會發生交互作用的蛋白質對。最後,我們在七個常 見的物種中,包含人類(Homo sapiens)、家鼠(Mus musculus)、大鼠(Rattus norvegicus)、 線蟲(Caenorhabditis elegans)、果蠅(Drosophila melanogaster)、酵母菌(Saccharomycescerevisiae)以及大腸桿菌(Escherichia coli)進行大規模蛋白質交互作用預測,從這些物種
中可以預測到約四十五萬對新的蛋白質蛋白質交互作用,同時我們還能在這些蛋白質交 互作用中提供交互作用功能區塊及接觸胺基酸對的註解。綜合以上所述,我們認為”結 構功能區域交互同源性對應”及”成對位置加權矩陣”是一個具有實際應用價值的蛋白質 蛋白質交互作用預測方法並能進一步研究蛋白質交互作用網路。
Inferring Domain Annotated Protein-Protein Interactions through
3D-Domain Interologs
Student: Yung-Chiang Chen
Advisor: Dr. Jinn-Moon Yang
Institute of Bioinformatics
National Chiao Tung University
ABSTRACT
The interaction between proteins is one of the most important features to most biological processes. In the postgenomic era, the ability to identify protein-protein interactions on a genomic scale is very important to determine networks of protein interactions. To predict protein interactions large-scalely, Lu et al. presented “interologs mapping”, — predicting protein-protein interactions from one organism to another by using computational comparative genomics. However, behind protein interactions there are protein domains interacting physically with one another to perform the specific functions. According to the increasing number of solved structures involving protein complexes, it is ripe to test putative interactions on complexes of known 3D structures.
In this study, we proposed a new concept “3D-domain interologs mapping” to inferred domain-annotated protein interactions. The 3D-domain interologs mapping is defined as “Domain a (in chain A) interacts with domain b (in chain B) in a 3D complex, their inferring protein pair A' (containing domain a) and B' (containing domain b) in the same species would be likely to interact with each other if both protein pairs (A' and A as well as proteins B and B') are homologous ” The key novelties of our method are fast genome-scale prediction across hundreds of organisms and construction of a pair Position Specific Scoring Matrix (pairPSSM). This matrix is able to provide statistical significance of residue pairs at various contact positions by evolutionary profiles, leading to a more sensitive scoring system. Our method successfully distinguishes the true protein complexes and unreasonable protein pairs with about 90% accuracy. We also evaluate our method in yeast proteome and get about 10% improvements than previous methods. The mean correlation of the gene expression profiles of our predictions is significantly higher than that for non-interacting protein pairs in S.
cerevisiae. Finally, our method applies to seven organisms commonly used in molecular
research, including Homo sapiens, Mus musculus, Rattus norvegicus, Caenorhabditis elegans,
Drosophila melanogaster, Saccharomyces cerevisiae and Escherichia coli. In these seven
organisms, our method predicts ~450,000 new interactions in which the interacting domains and residues are automatically modeled. In conclusion, this study suggests that 3D-domain interologs mapping and pairPSSM are useful methods for predicting protein-protein interactions and detailed analyzing networks of protein interactions.
致 謝
在兩年碩士生涯中,我首先要感謝我的指導教授楊進木老師,不管在研究或是做人 處世方面,都給我很多的指導與啟發,讓我對生物資訊領域有概括性的了解並且學習到 作科學研究應該具備的態度和方法。當我研究上遇到許多挫折的時候,感謝老師能持續 的給我鼓勵並且適時提出合理解決方案。 其次我想感謝系統生物組的學長陳宏助、劉康平及學弟許文昌,因為有你們的建議 還有系統程式方面的協助,使我的研究能夠順利進行。還有實驗室的同學們楊登凱、葛 振寧、黃章維,在碩二這段最煎熬的時刻,陪我渡過一個又一個寂靜的夜晚,相信這段 回憶會一直保留在我們腦海中吧。感謝俊辰學長常常和我討論人生的道理,使我對未來 有不一樣的看法;感謝董花每天中午和晚上都陪我一起吃飯;感謝阿甫常幫我拿公文還 有幫我處理電腦方面的問題。感謝PIKI 和右儒提供我完整的 FTP 站台。感謝籃球的球 友黃鎮剛老師,景盛,水雉,蔚倫,草霸,建華,立人,文宏,taco,小胖以及其他摩 獸爭霸dota 的隊友們幫助我排遣研究之餘的空閒時間。 另外我要感謝我的女朋友靜芬,謝謝你能體諒我這兩年不能常常陪在你身邊,對我 所做的決定都給予最大的支持還有幫助,讓我可以沒有後顧之憂在新竹為自己的理想努 力奮鬥。 最後我想感謝我的家人,儘管我沒有很多時間可以陪在您們身邊,謝謝你們還是無 怨無悔的支持我,鼓勵我。謝謝媽媽每兩個禮拜都幫我準備愛心水果,讓我健健康康的 在新竹唸書;謝謝爸爸不管早晚不論風雨都接送我到車站;謝謝哥哥姐姐常常聽我抱怨 東抱怨西。感謝你們所為我付出的一切一切,在此我僅能以小小的研究成果獻給您們, 感謝您們。 陳永強 謹誌 中華民國九十五年七月CONTENTS
Abstract (in Chinese) ··· I Abstract ···II Acknowledgements (in Chinese) ··· III Contents··· IV List of Tables ··· VI List of Figures···VII Chapter 1. INTRODUCTION ··· 1 1.1 Background··· 1 1.2 Related works ··· 4
1.2.1 Generalized interologs mapping··· 4
1.2.2 Structural-based prediction of protein-protein interactions··· 5
1.3 Motivation ··· 6
1.4 Thesis overview ··· 7
Chapter 2. MATERIALS AND METHODS ···9
2.1 Overview ··· 9
2.2 Preparation of data sets ··· 10
2.2.1 Database of 3D-dimer ··· 10
2.2.2 Definition of protein domain··· 10
2.2.3 Data set of related 3D-dimers···11
2.2.4 Data set of true protein complexes and unreasonable protein pairs ··· 12
2.2.5 Data set of yeast proteome ··· 13
2.2.6 Data set of yeast gene expression··· 14
2.2.7 Performance criteria··· 14
2.3 Construction of pairPSSM ··· 16
2.3.1 Building comprehensive and non-redundant protein database··· 16
2.3.2 Scoring matrix architecture ··· 17
2.3.3 Construction of multiple sequence alignment ··· 17
2.3.4 Target frequency estimation ··· 18
2.3.6 pairPSSM evaluation··· 20
Chapter 3. RESULTS and DISCUSSIONS ···21
3.1 Two issues in modeling protein-protein interactions by homology ··· 21
3.1.1 Similar 3D-dimers imply similar interactive types··· 21
3.1.2 Sequence identity threshold of aligning contact residues ··· 24
3.2 Verification in true protein complexes and unreasonable protein pairs··· 25
3.3 Verification in yeast proteome··· 27
3.4 A search example: 1a2kAD ··· 28
3.5 Verification in yeast gene expression profiles ··· 31
3.6 Application: Prediction of protein interactions in seven common organisms ··· 31
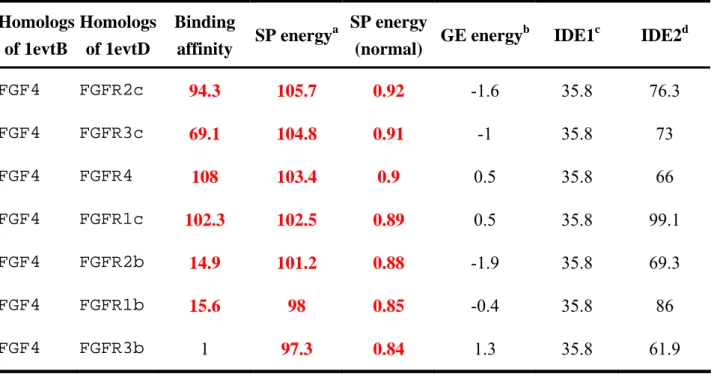
3.7 Model human protein interactions by 1evtBD ··· 32
Chapter 4. CONCLUSIONS··· 34
4.1 Summary··· 34
4.2 Major contributions and future perspectives ··· 35
List of Tables
Table 1. The compositions of protein sequence in RefSeq database (Release 16) ... 37
Table 2. The frequency of amino acid occurs in protein surface and whole protein ...38
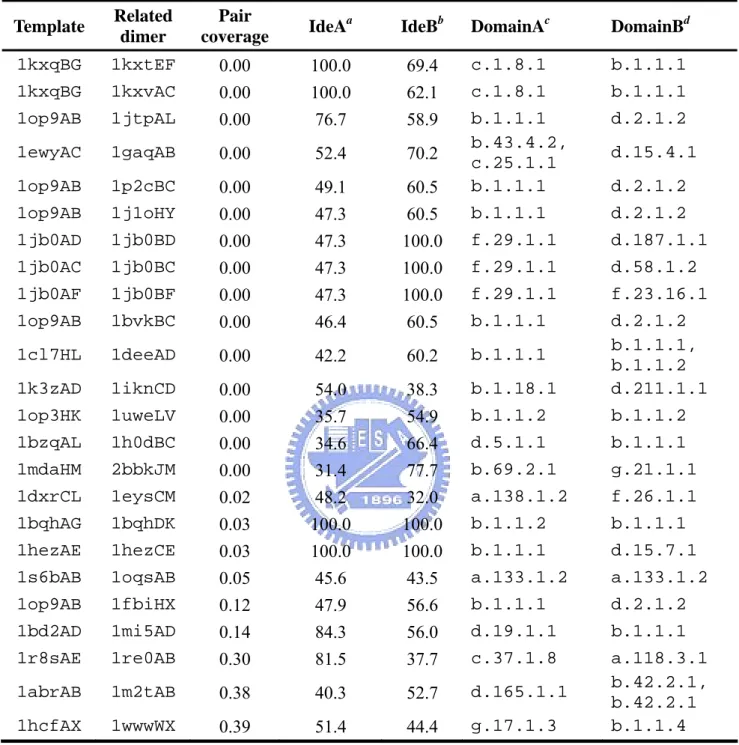
Table 3. 24 pairs of related heterodimers with > 30% identity but pair coverage < 0.4 ...39
Table 4. AP and FP on 182 queries where the unannotated candidates considered as negatives ...40
Table 5. AP and FP on 101 queries where the unannotated candidates are removed ...45
Table 6. The result of 1a2kAD to search yeast proteome ...48
Table 7. The pairPSSM of protein complex 1a2kAD ... 50
Table 8. Statistic of our predictions for seven common organisms ...52
List of Figures
Figure 1. The 3D structure and domain architecture of protein complex P47/P97 ... 54 Figure 2. The comparison of our and previous methods ... 55 Figure 3. The flow chart of our method... 56 Figure 4. The standard deviations of contact residue potentials in the clusters of amino acid
... 57 Figure 5. The relationship between sequence identity and pair coverage of 459 pairs of
related hetero dimers ... 58 Figure 6. The relationship between sequence identity and pair coverage of 1412 pairs of
related homo dimers... 59 Figure 7. The average pair coverage in different sequence identity interval ... 60 Figure 8. The relationship between sequence identity and pair coverage of the two-chain
dimers... 61 Figure 9. The interactive types of two hydrolase-antibody complexes 1op9AB and 1jttAL
... 62 Figure 10. Sequence identity threshold of aligning contact residues ... 63 Figure 11. Determining the threshold of specific interfacial energy on distinguishing the true
protein complex and unreasonable protein pairs... 64 Figure 12. Determining the threshold of general interfacial energy on distinguishing the true
protein complex and unreasonable protein pairs... 65 Figure 13. The relationship between number of contact residues in 3D-dimers and its specific
interfacial energies which are calculated from pairPSSM ... 66 Figure 14. The relationship between number of contact residues in 3D-dimer and its general
Figure 15. Determining the threshold of normalized specific interfacial energy on distinguishing the true protein complex and unreasonable protein pairs... 68 Figure 16. The mean average positions and mean false positive rate of 182 queries. The
unannotated candidates are considered as negatives... 69 Figure 17. The mean average positions and mean false positive rate of 101 queries. The
unannotated candidates are removed ... 70 Figure 18. Model for cycling transport factors proposed by Koepp and Silver ... 71 Figure 19. The multiple sequence alignment result of the 14 candidates to their corresponding
template proteins of 1a2kAD ... 72 Figure 20. 3D-structure of 1a2kAD... 73 Figure 21. Distributions of the correlation coefficients of gene expression profiles for four
interacting protein sets ... 74 Figure 22. The 3D-structure of 1evtBD and multiple sequence alignment of seven
Chapter 1
INTRODUCTION
1.1 Background
Many biological processes involve different types of interactions among proteins. Listing the proteins in the cell is not enough to fully understand the cellular machinery and all the interactions between them need to be delineated as well(1). Recently, systematic identification of protein-protein interactions had been constructed by high throughput experimental methods (large scale yeast two-hybrid analysis or proteomics immunoprecipitation e.g.) for diverse organisms, such as the yeast Saccharomyces cerevisiae, the fruitfly Drosophila melanogaster and the nematode worm Caenorhabditis elegans(2-4). Simultaneously, a lot of computational methods had also developed to predict protein-protein interactions genome-widely, such as gene fusion events(5), gene expression profiles(6), phylogenetic profiles(7), known 3D complexes(8,9), interologs mapping(10) (two proteins will interact with each other if their othologous proteins do as well), domain-pair profiles(11), conservation of gene neighborhood(12) and co-evolution strategy(13). The interaction data obtained from these methods were being collected by DIP(14), BIND(15), MIPS(16) and STRING database(17). In the postgenomic era, the ability to identify protein-protein interactions on a genomic scale is very important to determine protein interaction networks. Genome sequencing projects are in progress for more than 644 organisms, and complete sequences are now available for more than 160 prokaryotic and eukaryotic genomes. The NCBI Reference Sequence Project(18) collects 2,631,538 proteins for major research organisms. Most protein
sequences are without annotation of interaction. Facing the enormous protein sequences with unknown function, how to determine the protein interaction networks genome-scalely has become an important issue.
A research group presented “interologs mapping”(10) — the transfer of interaction annotation from one organism to another by using comparative genomics. For any given protein in one organism, all of its homologs in another organism are consider as a homolog family; both families of two interacting proteins are called interacting families and all possible protein pairs between two interacting families are considered as protein-protein interaction candidates.
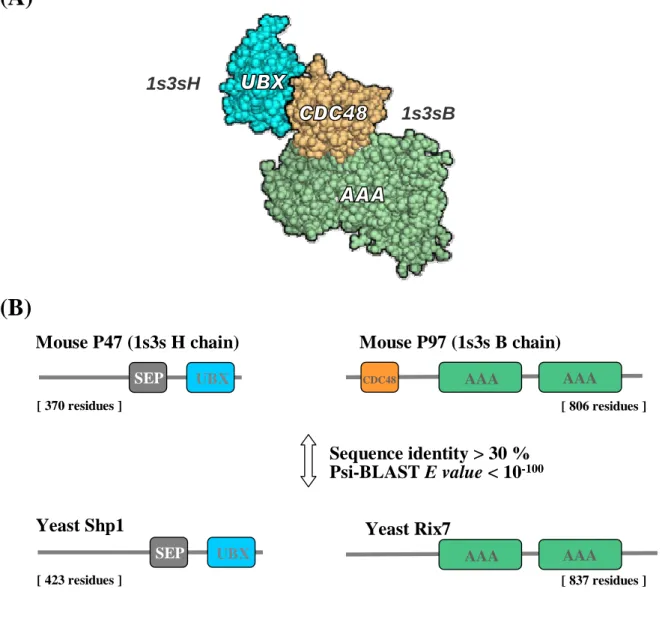
Behind protein interactions there are protein domains interacting physically with one another to perform the necessary functions. Interactive domains can recruit the formation of multi-protein signaling complexes, and control the conformation, activity, and substrate specificity of enzymes(19). However, almost all large scale method to explore interacting proteins can not respond how a protein interacts with another one in molecular detail (which domains bind directly), whether experimental or computational methods. There are two major strategies to study domain-domain interactions. The first strategy was to identify the domain pairs that are highly correlated with interacting proteins pairs and estimated the domain-domain interaction probability by using known protein-protein interactions as training data(20,21). These estimated probabilities of domain-domain interactions may be used to predict the probabilities of protein-protein interactions. The other strategy was to identify interacting domain from three-dimensional structural information. They exploited structural information to provide interacting domains and atomic details for thousands of direct physical interactions between proteins(8,22). The knowledge about interacting domains of a given protein interaction is very important for predicting new protein interactions. For example, p97, a member of AAA+ family (ATPases associated with various cellular activities) are involved
in different cellular pathways by interacting with various adaptor proteins(23). The membrane fusion adaptor p47 forms a tight complex with p97 and mediates p97 binding to its t-SNARE (soluble NSF attachment protein receptor) syntaxin5 for another round of membrane fusion (24). The interaction between p47 and p97 in Mus musculus could be transferred to other species by interologs mapping (two proteins will interact with each other if their othologous proteins do as well). According to the result of PSI-BLAST, we obtain the yeast Shp1p similar to p47 (E value: 10-114) and the yeast Rix7p protein similar to p97 (E value: 10-122). Both the two homologous proteins in Saccharomyces cerevisiae are very similar to the template (both
E value smaller than 10-100 and sequence identity greater than 30%) and might interact with
each other. Nevertheless, it may be not true in reality. Although both p97 and Rix7p belongs to type II AAA+ proteins which containing two ATPase domains, the Rix7p lacks the important binding domain – CDC48_N domain and not involved in the process of membrane fusion. Rix7p seems to be required for restructuring nucleoplasmic 60S pre-ribosomal particles to make them competent for nuclear export(25) (Figure 1). Therefore, the interaction between Rix7p and Shp1p should be an incorrect prediction result from lack of the knowledge about interactive domains.
According to the increasing number of solved structures involving protein complexes, it is ripe to test putative interactions on complexes of known 3D structure. In this study, we address these questions using a new concept, the “3D-domain interologs mapping” which is similar to “generalized interologs mapping”. The 3D-domain interologs mapping, the core idea of our method, is defined as “Domain a (in chain A) interacts with domain b (in chain B) in a known 3D complex, their inferring protein pair A' (containing domain a) and B' (containing domain b) in the same species would be likely to interact with each other if both protein pairs (A' and A as well as proteins B and B') are homologous”. Based on the concept of 3d-domain interologs mapping, we can infer lots of protein interactions across
different species quickly and automatics map interacting domains for our predicted interactions.
Our method can successfully distinguish the true protein complexes and non reasonable protein pair up to 90% accuracy. We evaluated our method in yeast proteome and get about 10% improve than previous methods. The mean correlation of the gene expression profiles of our predictions is significantly higher than that for non-interacting protein pairs in S.
cerevisiae. Although our method uses structure information, it does not require that the
structures of the modeling proteins be solved. For this reason, we can apply our method to predict protein interactions in the large protein database which contains several hundreds of complete genome sequences. Finally, the method applies to seven organisms commonly used in molecular research, including Homo sapiens, Mus musculus, Rattus norvegicus,
Caenorhabditis elegans, Drosophila melanogaster, Saccharomyces cerevisiae and Escherichia coli. In these seven organisms, our method predicts ~450,000 new protein
interactions in which the interacting domains and residues (binding sites) are automatically modeled. These visualized interacting residues are useful for the detailed analysis of protein-protein interactions.
1.2 Related works
1.2.1 Generalized interologs mapping
One concept of interologs, first proposed by Walhout et al.(26), is if interacting proteins A and B in one organism have interacting orthologs A’ and B’ in another species, the pair of interactions A-B and A’-B’ are called interologs. Protein-protein interactions can be predicted by maps known interactions in the source organism onto target organism. Yu et al.(10)
extended this idea to a large scale quantitative assessment on conservation of protein-protein interactions between proteins and organisms. They proposed “generalized interologs mapping: for any given protein in one organism, all of its homologs in another organism are consider as a homolog family; two families of two interacting proteins are called interacting families and all possible protein pairs between two interacting families are considered as protein-protein interaction candidates”. By using the interaction information of from Saccharomyces
cerevisiae, Caenorhabditis elegans, Drosophila melanogaster, and Helicobacter pylori, they
quantitatively assessed the interactions can be reliably transferred between species as a function of the sequence similarity of the corresponding interacting proteins and find a joint sequence identity > 80% or a joint E-value <10−70 to make a reliable transformation.
1.2.2 Structural-based prediction of protein-protein interactions
Some methods had paid attentions to known 3D-complexes in the PDB(27) to infer protein-protein interactions. Aloy et al.(8) used a 3D complex and alignments of homologues of the interacting proteins to access the fit of any possible interacting pairs on the complex by using empirical potentials. The MULTIPROSPECTOR, proposed by Lu et al.(22), attempts to study more distantly related protein sequences by threading sequences onto a library of interacting templates and scores based on the threading Z-score and the magnitude of the interfacial energy which is similar the first approach. The statistical interfacial pair potentials were developed from a dimer database (selecting the cocrystallized records from the PDB) with using of the following formula:
⎟⎟ ⎠ ⎞ ⎜ ⎜ ⎝ ⎛ − = ) , ( ) , ( log ) , ( exp i j N j i N j i P obs (1)
where P(i , j) is the interfacial pair potential between interacting residue pair i and j; Nobs(i , j)
is the observed number of interacting residue pairs of i , j between two chains; Nexps(i , j) is the
expected number of interacting residue pairs of i , j between two chains if there are no preferential interactions among them; The Nexps(i , j) is calculated from:
Nexp(i,j)=Xi⋅X j⋅Ntotal (2)
where Xi is the mole fraction of residue i in total surface residues. Ntotal is the number of total
interacting residue pairs. Both two methods applied the ratio of the observed frequencies to expected frequencies of pairings between two residue types to examine the two homologues if interacting with each other.
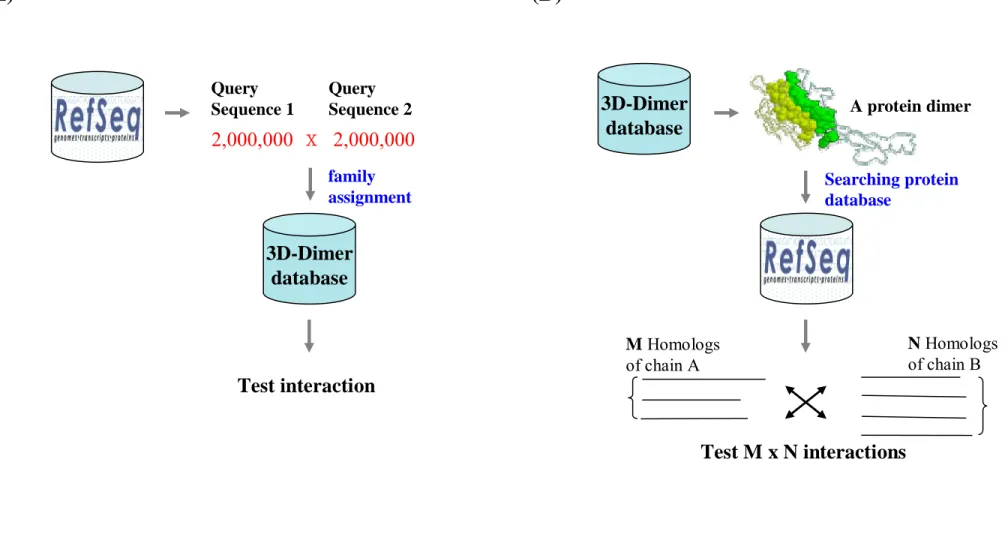
1.3 Motivations
The previous methods(8,22) focused on giving a pair of query proteins to search the 3D-dimer database library and then found a best fit template to score how well the pair of query proteins fit the template structure (Figure 2A). However, the technology of sequencing makes a might advance in the post-genomic era. There are more than two millions protein sequences across more than three thousands species in NCBI Reference Sequence database. It is hard to test all the protein pair (more than 1 billion) to search a dimer of known structure suitable to model them by homology. Here we combine the concept of generalized interologs mapping and structure based prediction of protein interactions to propose a new concept “3D-domain interologs mapping”, defined as “Domain a (in chain A) interacts with domain b (in chain B) in a known 3D complex, their inferring protein pair A' (containing domain a) and
B' (containing domain b) in the same species would be likely to interact with each other if
known structure as template, we can predict lots of domain annotated protein-protein interactions across different species (Figure 2B).
The statistical interfacial pair potentials were used to score how well the query protein pair fit the template structure by previous methods. This is a general empirical matrix for all the dimers of known structures to model the pair of query protein. However, although binding sites are mainly hydrophobic, protruding, and electrostatic complementary, no general patterns are observed(28). It had been found that the free energy of binding is not evenly distributed across interfaces; instead, there are hot spots of binding energy made up of a small subset of residues in the interface of complexes(29). Keskin et al. had found there is a correspondence between the experimental identified energy hotspot and the structurally conserved residues(28). Therefore, we consider the general empirical matrix cannot characterize all binding site correctly. Many researches had been proven that conservative residues may perform specific functional (e.g. catalysis, recognition, binding) role(30,31). In our study, we also develop a method to estimate the probabilities with witch residue pairs occur at various contact positions by evolutionary profiles, leading to a more sensitive scoring system. We consider our pair Position Specific Scoring Matrix (pairPSSM) can automatically characterized each interface of complexes and achieve a good performance for predicting protein-protein interactions.
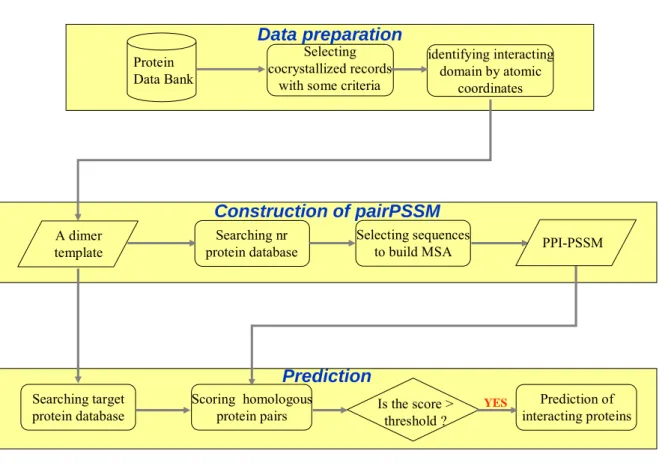
1.4 Thesis overview
In this study, we use “3D-domain interologs mapping” to predict domain annotated protein interactions. The flowchart shows in Figure 3. We collect dimers of known structure from Protein Databank. For each 3D-dimer, we estimate the probabilities with witch residue pairs occur at various contact positions and construct a pairPSSM to assess the fit of any
possible interacting protein pairs. And then we use these dimers as queries to search target protein database and predict many candidates of protein-protein interaction. We evaluate our method on three datasets; one is the multiple complex structures with the same interacting SCOP domains(32); one is protein-protein interactions in yeast proteome; and the other is yeast gene expression profiles. We finally apply our method to seven organisms commonly used in molecular research, including Homo sapiens, Mus musculus, Rattus norvegicus,
Caenorhabditis elegans, Drosophila melanogaster, Saccharomyces cerevisiae and Escherichia coli. In these seven organisms, our method predicts ~450,000 new protein
interactions in which the interacting domains and residues (binding sites) are automatically modeled. These visualized interacting residues are useful for the detailed analysis of protein-protein interactions.
Chapter 2
METHODS AND MATERIALS
2.1 Overview
We apply 3D-domain interologs mapping to infer domain annotated protein-protein interactions from 3D protein complexes. Step by Step of our method is showed as follows: (i)preparing the database of dimer template: we consider two contact chains in a 3D protein complex as 3D-complex template. We identify the contact residues of a 3D-complex template (containing chains A and B) in the PDB and define domain boundary by the SCOP database; (ii)for each dimer template, build a protein-protein interaction position-specific matrix (pairPSSM); (iii)generating candidates: we use a dimer template to search two protein families (A’ and B’) which contain the corresponding domains (a and b) from the target protein database and consider all the protein pairs between the two family as candidates of interacting proteins; (iv)scoring: we project the contact residue positions from a dimer template to its homologous protein pair. Then, summation of energy of all contact residue pairs in the homologous protein pair based on pairPSSM is considered the interactive energy of the homologous protein pair. If the interactive energy exceed to a threshold, we predict the two proteins interact with each other.
2.2 Preparation of data sets
2.2.1 Database of 3D-dimer
The PDB database (Protein Data Bank, http://www.rcsb.org/pdb/)(27) stores many three-dimensional structure of macromolecules, some of which are cocrystallized records. We select the cocrystallized proteins with using the criteria listed below:
1. The resolution of the PDB records should be smaller than 3.0Å.
2. Each chain of the cocrystallized proteins should be comprised more than 35 amino acids to be considered as domains. If the protein is consisted of the cross-chain domain defined by SCOP, we also regard it.
3. The number of interacting residue pairs is set to be greater than 25 and each chain must contain more than 5 contact residues to make sure that the dimer is reasonably extensive(20). Interacting residue pairs are defined as a pair of residues from different chains that have at least one pair of heavy atoms within 4.5Å with each other.
4. Elimination of artificial packing complexes rather than biologically functional multimers by using PQS server(33), where adopt the reduction of solvent accessibility (ASA) due to oligomerisation.
From 35343 records in PDB (20060204), 29369 dimers of known structures are selected including 8018 heterodimers and 21351 homodimers. Then, we remove redundancy by sequence identity > 50% and leave 1122 heterodimers and 3514 homodimers, respectively.
2.2.2 Definition of protein domain
Proteins, http://scop.berkeley.edu/)(32). In 1.69 releases, there are 70859 domains from 25973 PDB entries. The SCOP database is based on evolutionary relationships and on the principles that govern their three-dimensional structure. Strong sequence similarity alone is considered to be sufficient evidence for common ancestry. Close structural and functional similarity together is also accepted as sufficient evidence for distant homology between proteins that lack significant sequence similarity. But neither structural nor functional similarity alone is considered to be strong evidence. Therefore, the SCOP database is organized on a number of hierarchical levels, with the principle ones being family, superfamily, fold and class. Families contain protein domains that share a clear common evolutionary origin, as evidenced by sequence identity or extremely similar structure and function. Superfamilies consist of families whose proteins share very common structure and function, and therefore there is reason to believe that the different families are evolutionarily related. Folds consist of one or more Superfamilies that share a common structure core structures. Depending on the type and organization of secondary structural elements, folds are grouped into four main classes (all α, all β, α+β, α/β).
2.2.3 Data set of related 3D-dimers
We want to explore whether the two similar dimers possess the similar protein interaction type. Modeling protein interactions by homology is reasonable only when this hypothesis is valid. Here we defined the two 3D-dimers contain the same interacting SCOP domain (more than three contact residues within the domain boundary) are related-dimer pairs. From our database of 3D-dimer, we first remove the dimers with no definition of SCOP domain then leave 5553 heterodimers and 15026 homodimers. Second, the dimers are clustered by BlastCluster(34) according sequence identity more than 80% and both sequence
coverage more than 0.8. We choose one representative dimer from each cluster if the number of interacting residue pairs more than the mean of the cluster and the resolution of crystallization is smallest. In this way, a representative set of 3D-dimers is selected, which contains 999 heterodimers and 2837 homodimers. Third, the representative set of 3D-dimers is grouped based on the domain definition in SCOP. We group the dimers which possess the same interacting domain pair in family level. Totally, there are 540 types of interacting domain pair in the 999 heterodimers and 1425 types of domain-pair in the 2837 homodimers, respectively. 189 groups of heterodimer and 488 groups of homodimer contain more than 1 member. We choose one representative member for each group and pair the representative one for the all other members in the group. These pairs of dimer are considered as related dimer pairs. In this way, we select 459 related dimer pairs from the 189 groups of heterodimer and 1412 related dimer pairs from 489 groups of homodimer, respectively.
On the other hand, we define a subset from database of 3D-dimer which include the dimers should be in two-chain PDB records (there are only two proteins in the PDB entry). The rationale is interaction between two proteins may be bothered by other proteins if there are more than three proteins cocrystallized at the same time. There are 897 two-chain heterodimers and 3665 two-chain homodimers selected from the database of dimer template. Finally, we can get 114 pairs of two-chain heterodimer and 616 pairs of two-chain homodimers.
2.2.4 Data set of true protein complexes and unreasonable protein pairs
Our method is based on a 3D-dimer to model all potential protein interactions and used a specific pairPSSM to determine whether the two proteins interact in nature. Here we construct a data set include the protein pairs which really form complexes in living thing and the protein
pairs don’t interact with each other (the unreasonable protein pairs). From 189 representative 3D-dimers (exclude the antibody-antigen complex), we used the PSI-BLAST to search our database of 3D-dimer which remove dimers with > 80% sequence identity and get homologous protein pair with E value threshold 0.1. If the protein pair is cocrystallized in PDB and it contains the same interactive SCOP domains for the query dimer, we consider the protein pair as positive that means this protein pair should be predicted by the 3D-dimer. In the other word, if the protein pair is not cocrystallized in PDB and it does not contain the same interactive SCOP domains for the query dimer, we consider the protein pair as negative. In this way, we can select 224 positive protein pairs and 282 negative protein pairs.
2.2.5 Data set of yeast proteome
We test our method to predict interactions in baker’s yeast (Saccharomyces cerevisiae).
Being a model system relevant to human biology, yeast has attracted special interest from the scientific community. There are 6000 proteins but the estimated number of actual interactions is smaller than 100,000 in Saccharomyces cerevisiae(1). Recently, high-throughput interaction screens of protein interactions in S. cerevisiae had been conductive by yeast two-hybrid(2,35) and affinity purification followed by mass spectroscopy(36,37). At the same time, many large-scale experiment of gene expression for S. cerevisiae proteome are also carried
out(38,39). The public available data of functional genomics in Saccharomyces cerevisiae are
most comprehensive.
The yeast proteome is obtained from the web site of the SGD (Saccharomyces Genome
Database, http://www.yeastgenome.org)(40). The corresponding amino acid sequences of
total 5877 open reading frames (ORFs) are subsequently downloaded. The comprehensive protein-protein interactions are downloaded from the DIP database (Database of Interacting
Protein, http://dip.doe-mbi.ucla.edu/)(14). The DIP database catalogs experimentally
determined interactions between proteins. It combines information from a variety of sources to create a single, consistent set of protein-protein interactions. The data stored within the DIP database were curated, both, manually by expert curators and also automatically using computational approaches that utilize the knowledge about the networks of protein-protein interaction extracted from the most reliable, core subset of the DIP data. There are total 5882 reliable interactions downloaded from DIP and considered as positive set.
Because no directly information about which proteins do not interact, Jansen et al.(6) assumed that proteins in different compartments do not interact with each other and generate 2,708,746 non-interacting protein pairs from lists of proteins in separate subcellular compartments(41). We used these protein pairs as gold negative set.
2.2.6 Data set of yeast gene expression
The gene expression profiles of two interacting proteins were also used to access the accuracy of our method according to the basic assumption: “the gene pair with similar expression profiles is likely to encode an interacting protein pair”(42). The Rosetta compendium set consisting of the expression profiles of 300 deletion mutants and under chemical treatments(39) was used to measure the similarity of gene expression profiles of two genes
2.2.7 Performance criteria
We used two common metrics to assess the quality of our method, including mean average precision (MAP) and mean false positive rate (MFP). The mean average precision is
defined as: AP
(
A i T)
A i i h / / 1∑
= = (3a) MAP(
M AP)
M i 1 i /∑
= = (3b) where Thi is the number of compounds in a hit list containing i correct interactions; A is total number of true hits in the databases; M is the total number of template.The mean false positive rate is defined as:
FP=
(
∑
hA=1(
Th −Ah) (
/ T −A)
)
/A (4a)MFP
(
M FP)
Mi 1 i /
∑
== (4b) where Ah is the number of active ligands among the Th highest ranking compounds; T is the total number of candidates from PSI-BLAST; A is total number of true hits in the T; M is the total number of template.
In this study, the similarity of two gene-expression is defined by the Pearson correlation coefficient between the two gene-expression profiles (see 2.2.6). To test whether the mean of correlation coefficient for candidates of protein-protein interactions higher than that of non-interacting protein pairs, we calculate the T-score and the P-value for the null hypothesis of the sample mean (our prediction) smaller than the mean of gold negative set. We apply standard two sample T-test statistics:
2 ) 1 ( ) 1 ( 1 1 2 1 2 2 2 2 1 1 2 1 2 1 − + − + − + − = n n S n S n n n u u T (5) where u is mean of samples, and S is the standard deviations of the samples:
∑
= − − = n i u x n S i 1 2 ) ( 1 1 (6)2.3 Construction of pairPSSM
Here we want to develop a method to estimate the probabilities with witch residue pairs occur at various contact positions by evolutionary profiles, leading to a more sensitive scoring system. The probabilities with witch residue pairs occur at various contact positions are transformed to energy of contact residue pair (pair Position Specific Scoring Matrix called pairPSSM). The energy calculated from pairPSSM is the specific interfacial energy. On the other hand, the energy calculated from empirical matrix is the general interfacial energy.
2.3.1 Building comprehensive and non-redundant protein database
To obtain the evolutionary profiles from multiple sequence alignment, our alignment result should be come from a comprehensive and non-redundant protein database. The protein database is obtained from the web site of the NCBI Reference Sequences database (Release 16, http://www.ncbi.nlm.nih.gov/RefSeq/). The Reference Sequence (RefSeq) collection aims to provide a comprehensive, integrated, non-redundant set of sequences, including genomic DNA, transcript (RNA), and protein products, for major research organisms. In Release 16, Refseq includes 2,273,764 protein sequences across 3244 organisms. Table 1 shows the protein sequence composition in Refseq database. Although RefSeq aims to provide a non-redundant set of sequences for users, two major source of redundancy occur in RefSeq. One is alternative splicing; the other is duplication of genes (paralog). Therefore, we used BlastCluster to remove redundancy with both the sequence identity and coverage as high as
90% in the same species. In this way, 2,109,945 protein sequences are selected into our non-redundant protein database.
2.3.2 Scoring matrix architecture
For a 3D-dimer with the number of contact residue pairs M, the empirical energy matrix of dimension 20 × 20 is replaced by a protein-protein interaction position-specific matrix (pair PSSM) of dimension M × 20. The residue pair in a contact position is considered as a single symbol. The advantage of this matrix is estimation of the probabilities with witch residue pairs occur at various contact positions, leading to a more sensitive scoring system.
2.3.3 Construction of multiple sequence alignment
To produce a multiple sequence alignment from the PSI-BLAST output, we simply collect all RefSeq sequence segments that have been aligned to the two proteins of 3D-dimer with E value below a threshold, by set to 10-9 to assure the members are similar enough to the 3D-dimer. The two proteins of 3D-dimer are used as a master for constructing two multiple sequence alignments, respectively. Any row that is > 95% identical to 3D-dimer is purged. To ensure that all the sequences found by PSI-BLAST are likely to be structurally related to the dimer template, we set a similarity threshold described by Batalov & Abagyan(43,44) was used, defined as follows:
( )≤31.8 −0.102+ ×17.4 −0.29 L m L L t (7)
where t(L) is the percentage sequence identity threshold dependent on alignment length L, and
(the identity threshold at least above 25%) to make sure all the sequences found by PSI-BLAST with similar interactive type to their dimer template (see section 3.1).
Because most the interacting proteins belong to the same species, the proteins in the two multiple sequence alignments must be arranged in order by species. For example, the 1st protein in a multiple sequence alignment is a human protein, and the 1st protein in the other must be a human protein. The 2nd protein in a multiple sequence alignment is a mouse protein, and the 2nd protein in the other must be a mouse protein.
2.3.4 Target frequency estimation
Given two multiple sequence alignment from a 3D-dimer, we generate score matrices with the theoretical foundation is that the scores for a specific contact position be of the form log (Qij/Pij), where Qij is the estimated probability for contact residue pair i&j to be found in
the column and Pij is the expect probability of i&j to be found in the column. The estimate of
Qij for a specific contact position should converse simply to the observed frequency of residue
pair i&j in that column. However, it is complicate estimating the Qij include small sample size
and prior knowledge of relationships among the residues should be considered. We implemented the data-dependent pseudocount method introduced by Tatusov et al.(45). It is relative simplicity and often performs nearly as well comparing the Dirichlet mixtures(46).
We slightly modify the data-dependent pseudocount method by using the prior knowledge of amino acid relationships embodied in the substitution matrix to generate residue pair pseudocount frequencies gij. For a given position pair of contact residues C, we construct
pseudocount frequencies gij using the formula:
Sij
j i ij PPe
where Sij is the interactive energy of residue i&j contact in empirical energy matrix. Pi is the
background probability of residue i. The rationale is that we use the prior knowledge of interactive energy between residue i&j to estimate pseudo frequency. We then estimate Qij
followed as: β α β α + + = ij ij ij g f Q (9)
where the α and β are the relative weights given to observed and pseudocount residue frequency. In our study, we let α = the number of different residue-pair types in column -1 and β = 5. If the β is larger, the greater the emphasis is given to prior knowledge. Pij is the expect probability of i&j to be found in the column and is calculated from:
Pij = Pi ⋅Pj (10) where Pi is the expect probability of residue i occurring in protein surface. The residue
composition of the protein interface is obtained from Lu et al.(47)(Table 2).
2.3.5 Amino acid classification
The sequence variability at each contact position could be estimated from the two multiple sequence alignment of dimer template. However, by not making concessions for conservative mutations the scheme becomes too rigid. Unlike unconservative mutations, conservative ones preserve the essential nature of the side chain. Therefore, we make some tolerances for such mutations. Saha et al.(48) made a classification based on the similarity of the environment of each amino acid residue in protein structures to the nine groups:
(vi) His; (vii) Arg and Lys; (viii) Asp and Glu; (ix) Asn and Gln. We test this classification of amino acid whether suitable for access the contact residue potential by calculating the standard deviation of contact residue potential in the cluster of amino acid. Figure 4A shows that the three groups {A, V}, {P, F, Y, W} and {R, K} have high standard deviations of intra contact residue potential. Therefore, we slightly modify the group as follows:
(i) Ala and Gly; (ii) Val, Met, Leu and Ile; (iii) Pro, Ser and Thr; (iv) Phe, Tyr and Trp; (v) Cys; (vi) His and Arg; (vii) Lys; (viii) Asp and Glu; (ix) Asn and Gln. In this way, all the standard deviations of intra contact residue potential are smaller than 0.4 (Figure 4B). We consider this amino acid classification is more reasonable for measuring the contact residue potential.
2.3.6 pairPSSM evaluation
The pairPSSM is evaluated by two data sets. First, we test whether the energy calculated from pairPSSM could distinguish the true protein complexes and unreasonable protein pairs (data set described in section 2.2.4). Second, we apply our method to predict protein-protein interactions in yeast proteome (data set described in section 2.2.5) and used two common metrics (MAP and MFP described in 2.2.6) to assess the performance of pairPSSM and compare the empirical matrix used by previous method. Then, we test the similarity of gene expression profiles for the candidates of protein-protein interactions. Finally, we give two true biological examples to illustrate the operation and power of our method.
Chapter 3
RESULTS and DISCUSSIONS
In this study, we first explore the relationship between sequence similarity and interactive similarity in protein-protein interactions. Modeling protein interactions by homology is reasonable only when the correlation is high enough. Second, because the structures of proteins are unsolved, we are only able to use the method of sequence alignment to align the template and target proteins. The consistence ratio between sequence alignment and structure alignment must also be studied. Third, our method is verified in two data sets: one is true protein complexes and unreasonable protein pairs. The other is protein-protein interactions in yeast proteome. Finally, we applied 3D-domain interologs mapping to predict protein interactions for seven organisms commonly used in molecular research.
3.1 Two issues in modeling interactions by homology
3.1.1 Similar 3D-dimers imply similar interactive types
The data set (459 pairs of related heterodimers and 1412 pairs related homodimers) described above provide all instances of a particular interaction type occurring within different complex structures, that we then wish to compare to each other and correlate with sequence similarity. To compare the binding of different instances of the two dimers with the same interacting domains, we devise an index, pair coverage, to calculate binding site overlap from the number of shared interacting residue pairs. Given a pair of related dimers A-B and
A’-B’, where A-A’ and B-B’ contain same SCOP domains. we use a structural alignment tool, CE(49), to align the A-A’ and B-B’, respectively. The pair coverage is defined as:
' ' 2 cov B A AB NCP NCP NCPM erage Pair ⋅ = (11)
where the NCPM is the matching number of contact residue pairs between the structural alignment of A-A’ and B-B’; NCPAB is the number contact residues pairs of dimer A-B;
NCPA’B’ is the number contact residues pairs of dimer A’-B’.
The value of pair coverage is range from 0 ~ 1. The interactive types of two dimers are very alike in the pair coverage of a pair of related dimers is greater than 0.4. This threshold is chosen after visual inspection of many pairs of related dimers. On the other hand, the percentage sequence identity is calculated by the number of identical residues divided by the number of structurally equivalent residues. In following discussion, the sequence identity between two dimers is defined as the minimum of sequence identity in A&A’ and B&B’. The rationale is that the interacting partners with the lower sequence identity would tend to be the better indicator for the diversity of the interaction.
Figure 5 shows the relationship between sequence identity and pair coverage of 459 pairs of related hetero dimers. It is clear that the interactions tend to be similar when sequence identity is above 30%. The pairs of related dimers in the gray box are the exceptions of the related dimer pair with > 30% sequence identity but pair coverage < 0.4. In the 280 out of 459 pairs of related heterodimers with > 30% sequence identity, there are only 24 pairs with pair coverage < 0.4. The rate of exception is 8%.
On the other hand, Figure 6 shows the relationship between sequence identity and pair coverage of 1412 pairs of related homodimers. The trend which gives a guide to the degree of sequence similarity needed to be confident in a similar interaction is also observed. However,
there are much more exceptions in the pairs of homodimers than heterodimers. In the 640 out of 1412 pairs of related homodimers with > 30% sequence identity, there are 189 pairs with pair coverage < 0.4. The rate of exception is about 30%. Figure 7 shows the average pair coverage in different sequence identity. It is clear that the pair coverage of heterodimers higher than that of homodimers in difference sequence identity. It means the specificity of interaction in heterodimer is more conserved than homodimers. For this reason, we think heterodimers are more suitable used to template to model protein interactions than homodimers.
There are many PDB record with more than two proteins cocrystallized. Here we want to study whether the interactions bothered by other proteins. 114 pairs of related two-chain heterodimers and 616 pairs of related two-chain homodimers are selected (see 2.2.3). Figure 8 shows that the relationship between sequence identity and pair coverage is not much different from heterodimers or homodimers. 4 out of 90 of related two-chain heterodimers and 78 out of 255 related two-chain homodimers with > 30% sequence identity but with pair coverage < 0.4. The rates of exception are 4.5% and 30.5%, respectively. From the above result, we think the conservative of interactive specificity is bothered slightly by other proteins.
There are 24 exceptions out of 280 pairs of related heterodimers with sequence identity > 30% but pair coverage < 0.4. Table 3 shows the type of interacting domains in these 24 cases. Surprisingly, 11 out of 24 cases contain the b.1.1.1 domain (V set antibody variable domain). That means the interactive types of antigen-antibody complex need not conserve. Figure 9 shows an example of two much similar antigen-antibody complex but their interactive types are completely different. 1op9 (PDB id) is a hydrolase-antibody complex in human and 1jtt (PDB id) also is a hydrolase-antibody in chicken. The A chain of 1op9 and A chain of 1jtt both contain the V set antibody variable domain (SCOP id, b.1.1.1) and the sequence identity between the two proteins is as high as 77%. The B chain of 1op9 and B chain of 1jtt both
contain the C-type lysozyme domain (SCOP id, d.2.1.2) and the sequence identity between the two proteins is as high as 61%. By study the interactive site of the two complexes, we discover both the binding area of 1op9A and 1jttA at the variable region of V set antibody variable domain. However, the binding sites of 1op9B and 1jttL are very different. We superimpose the 1op9B and 1jttL and discover the binding site of the two proteins at two different sides (Figure 9). Therefore, the pair coverage between the two complexes is very low.
In summary, we find the related dimers indeed keep similar interactive type. Sequence similarity needed to be confident in a similar interaction. We suggest one must be careful with identity below than 30% to model interactions by homology. Because the specificity of interaction in heterodimer is more conserved than homodimers, we consider the heterodimers are more suitable used to templates to model interactions. Finally, we find the interactive types of antigen-antibody complexes often differ completely, they may be not suitable for used to as templates.
3.1.2 Sequence identity threshold of aligning contact residues
To model interactions for the proteins with unknown 3D structures, we need use the method of sequence alignment to align protein sequences between the template (3D-dimer) and target proteins (unknown 3D structure). Here we would likely to study if the performance of PSI-BLAST (a method of sequence alignment)(34) is as better as the performance of CE (a method of structure alignment)(49) in matching of contact residues. We devise an index, consistence ratio, to calculate the accuracy of PSI-BLAST in match of contact reside by using alignment result of CE as reference. The consistence ratio is defined as:
NCM NCM Ratio e Consistenc = BLAST (12) where the NCMCE is the number of contact residue matching in CE alignment; NCMBLAST is
the number of contact residue matching occur both in PSI-BLAST and CE alignment.
286 pairs of related heterodimers whose pair coverage greater than 0.5 are used for our study to ensure the contact residue equivalent with biological meaningful. Figure 10A shows the relationship between the consistence ratio and sequence identity. The higher sequence identity, the higher consistence between PSI-BLAST and CE alignment. Figure 10B shows the mean of consistence ratios in different sequence identity. When the sequence identity is greater than 25%, the consistence is very high. Furthermore, there is a twilight zone between sequence identity between 20%~25%. The result conforms to the traditional twilight zone that already known for sequence and structure relationships(50). If the sequence identity below than 20%, it is much different in sequence and structure alignment result.
3.2 Verification in true protein complexes and unreasonable protein pairs
To verify our method, the two dataset should be collected. The one is positive dataset which contains the protein pairs indeed interact with each other and the other one is negative dataset which contains the protein pairs which do not interact. Here we would likely to study whether the specific interfacial energy calculated from pairPSSM could distinguish the two datasets. From above sections, 224 pairs of homologous, non-identical 3D-heterodimers are collected into positive dataset and 282 pairs of homologous protein pair are collected into negative dataset. We can use one dimer to score the other one by our specific empirical matrix (pairPSSM) and general empirical matrix.
specific interfacial energy intervals. The threshold is determined by result in minimum false positives and minimum false negatives. We calculate the error rate by averaging the number of false positive divided by number of positive set and the number of false negative divided by number of negative set. Figure 11B shows that when the specific interfacial energy is set to 50, we can obtain the minimum error rate 18%. We also apply the general interfacial energy to the positive set and negative set. The result is in Figure 12B. When the general interfacial energy is set to 10, we can obtain the minimum error rate 17%.
We are interested in the distribution of positive and negative dataset is not high concentrated in the two sides (positives in high energy and negatives in low energy) when using the specific interfacial energy (Figure 11A). That is why the error rate higher in using specific interfacial energy than in using general interfacial energy. We find there it is a high correlation between the specific interfacial energy and the number of contact residues in 3D-dimers (Figure 13). The correlation coefficient is 0.9321. The correlation between general interfacial energy and the number of contact residues (Figure 14) is not as high as the correlation between the specific interfacial energy and the number of contact residues. The correlation coefficient is only 0.6753.
Because specific interfacial energy is highly dependent on the characteristic of dimer template, we design a method to normalize the specific interfacial energy. When a homologous protein pair is modeled by a 3D-dimer and gets a specific interfacial energy scored by pairPSSM, we normalize the energy defined as follow:
template predict normalized E E E = (13)
where the Epredict is the specific interfacial energy of the homologous protein pair and the
interfacial energy, we can find the distribution of positive and negative dataset is much more concentrated in the two sides (Figure 15A) than the unnormalized (Figure 11A) and the error rate reduce from 18% to 13% (Figure 15B). For this reason, we consider the normalized specific interfacial energy equal set to 0.4 is a good threshold for predicting protein interactions.
3.3 Verification in yeast proteome
The yeast (Saccharomyces cerevisiae) is a simple, unicellular eukaryote developed to a unique powerful model system for biological research. Its prominent useful features are the cheap and easy cultivation, short generation times, the detailed genetic and biochemical knowledge accumulated in many years of research. Therefore, this organism provides a highly suitable system to study basic biological processes that are relevant for many other higher eukaryotes including human. There are about 6000 proteins in this organism. Up to present, 5882 reliable protein-protein interactions in yeast are collected in DIP database (see 2.2.5). Here we predict protein interactions in this organism and used two indices, average precisions and false positive rate, to verify our method. The two indices are common used to evaluate the quality of database searching. From the dataset of 8018 heterodimers, we remove the redundancy with sequence identity > 50% and then select 1122 representative heterodimers as queries to search database of yeast proteome by PSI-BLAST. We defined the proteins searched out with E value smaller than 10-3 is homologous to the query protein. Given a query of heterodimer A-B, A’ is the homologous protein for A and B’ is the homologous protein for B. All the homologous protein pairs A’-B’ are considered as candidates of protein-protein interactions. The known interactive protein pairs among the candidates are considered as positives and the others are considered as negatives.
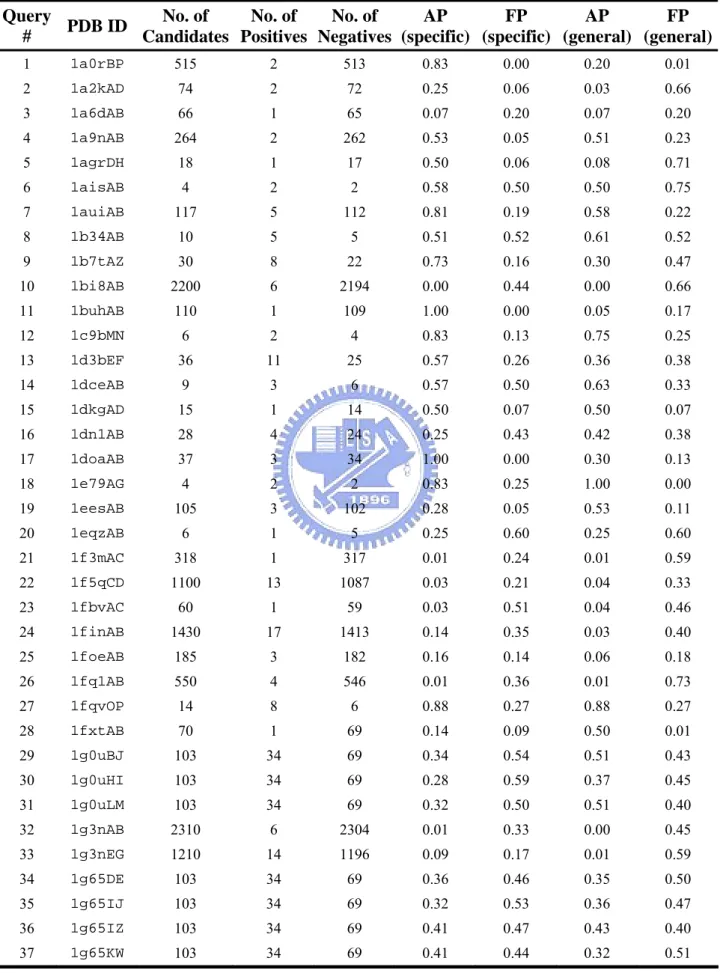
182 out of 1122 queries have both positive candidates and negative candidates, and then these queries could calculate the average precisions and false positive rate. All the detail result of the 182 queries is listed in Table 4. Figure 16 shows the mean average precisions (MAP) and mean false positive rate (MFP) of the 182 queries. The MAP is 0.42 and the MFP is 0.31 by using specific interfacial energy. On the other hand, the MAP is 0.35 and the MFP is 0.37 by using the general interfacial energy. In order to avoid our method merely predict protein interactions with high sequence identity, we set the sequence identity limit to remove the candidates if one protein of candidates with sequence identity > sequence identity limit. Figure 16 shows our method using pairPSSM is much better than the general empirical matrix even though in predicting remote protein interactions.
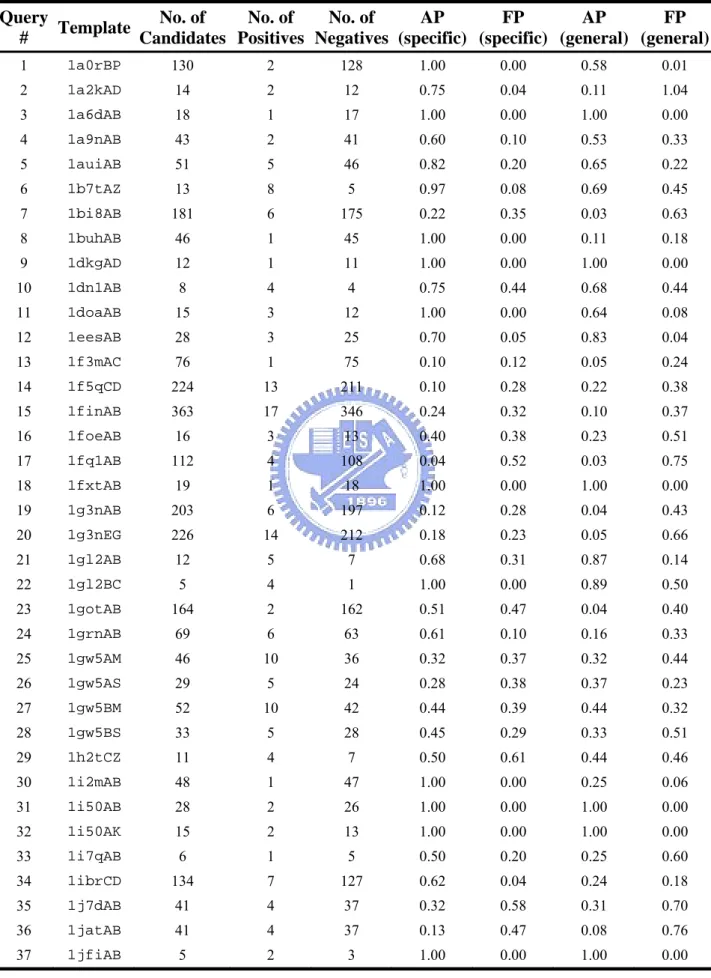
In the above section, the candidates which are not included in the known interactive protein pairs are considered as negatives. However, it may be somewhat unreasonable because many candidates are indeed interacting proteins in nature but have not proven by experimental methods in the past. Therefore, we only consider the candidates overlapping with 2708,746 (see 2.2.5) non-interacting protein pairs defined by Jasen et al. as negatives. The candidates without any annotations are removed for calculate average precisions and false positive rates. In this way, our method using pairPSSM is about 10 % improvement than the general empirical matrix (Figure 17).
3.4 A search example: 1a2kAD
We give an example using the 3D-dimer, 1a2kAD, to search database of yeast proteome and illustrate the accuracy and operation of our method. The A chain of 1a2k is a rat nuclear transport factor 2 (NTF2) and the D chain of 1a2k is a dog GTP binding protein ran(51). The transportation between nucleus requires to the nuclear pore complexes (NPC) in the nuclear
envelope and several key factors including importin α and β, which recognize proteins with a nuclear localization sequences (NLS), the small GTP binding protein ran and nuclear transport factor (NTF)(52,53). Both RNA export and nuclear protein import depend on ran. The molecular details of the export of transport factors had been speculated by Koepp and Silver(52) in Figure 18. Once inside the nucleus, importin α must dissociate from the NLS-bearing substrate, which may be accomplished by competition with RNA-binding proteins. Ran may move out of the nucleus as a complex of Ran-GTP–importin β. Dissociation of these two proteins could be a result of the GAP activity of Rna1p, either inside the NPC or on the cytoplasmic face of the NPC. There is evidence that Rna1p can interact with importin β(53). The precise signal for an irreversible step of export is unclear, but it is possible that free importin β could dissociate importin α from RNA-binding proteins. Thus, the key players in nuclear protein import would be regenerated for another round of transport.
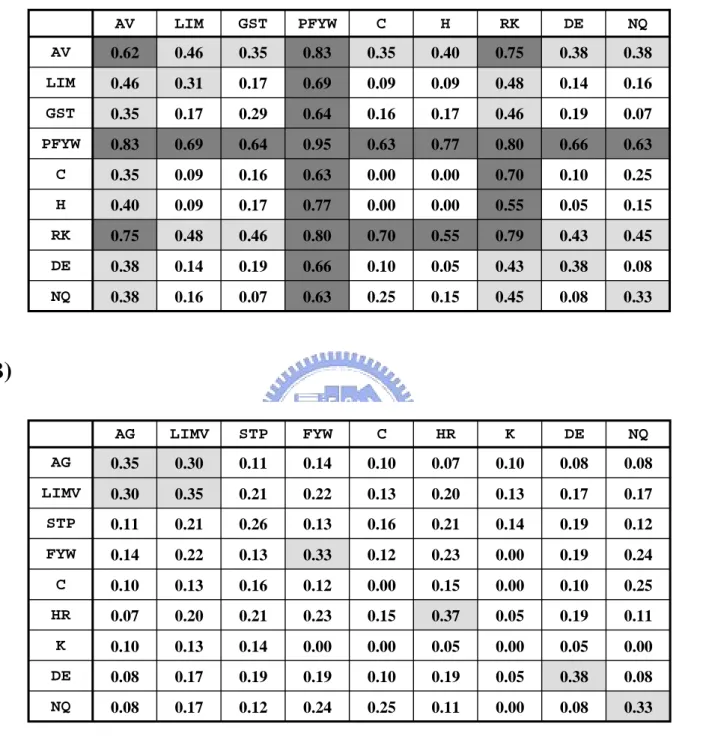
Here we use the 3D-dimer of 1a2kAD to query database of yeast proteome and then obtain 14 pairs of homologous proteins (Table 6). The two protein pair, NTF2&GSP1 and NTF2&GSP2, has been proven to bind with each other by yeast two hybrid test(54,55) and the other twelve protein pairs are non-interacting proteins due to locate in different compartments The specific interfacial energies calculated from pairPSSM (Table 7) of the two positive protein pairs are both above the threshold 0.4 and the twelve negative protein pairs are below the threshold (Table 6). It shows that our score is good for predicting protein interactions. However, the general interfacial energies of the two positive protein pairs are both above the threshold -15 (the more negative are more favor to bind)(47). And ten out of twelve negative protein pairs are above the threshold. In summary, 12 out of 14 protein pairs are predicted incorrectly with general interfacial energy an all the 14 interactions are predicted correctly by our specific interfacial energy.
Figure 19 shows the multiple sequence alignment result of the 14 candidates to their corresponding template, A chain of 1a2k or D chain of 1a2k. The interface involves primarily the putative switch II loop of ran (residue 65 to 78, Figure 19B orange box) and the hydrophobic cavity surrounding surface of NTF2(51). The interaction made by the switch II loops accounts for the ability of NTF2 to discriminate between GDP and GTP bounds forms of Ran. A striking feature of the interactive interface was the aromatic ring of Phe72 of ran (Figure 19B, orange star site and Figure 20B, orange residue). It inserts into the hydrophobic cavity of NTF2 where it was surrounded by the hydrophobic side chains of Trp41, Leu59, Phe61, Ile64, Leu89, Ala91, Met97, Phe119 and Leu121. The GSP1 and GSP2 of two positive protein pairs are conservative in this important site (Figure 19). On the other hand, the interactive interface on NTF2 involved this molecule’s characteristic hydrophobic cavity. Hydrophobic residues in the upper portion of the NTF2 cavity, together with negatively charged residues, Glu42, Asp92 and Asp94, are surrounding the cavity (Figure 19A, yellow boxes and Figure 18A, yellow residues) made significant contributions to the interface with GDP-Ran. The three important negatives residues are conservative from A chain of 1a2k (rat NTF2) to the yeast NTF2. However, the three important sites are mutated to Threonine in BRE5 (Figure 19A). The BRE5 is an ubiquitin protease cofactor which forms deubiquitination complex with ubp3p that coregulates anterograde and retrograde transport between the Endoplasmic Reticulum and Golgi compartments. The three important residue mutated may be resulted in BRE5 does not interact with GSP1 and GSP2. Encouragingly, we give poor score to the 2 candidates (0.08) and successfully identify the true interactions GSP1&NTF2 and GSP2&NTF2.
3.5 Verification in yeast expression profiles
Recently, many scientists consider that genes with similar expression profiles are likely to encode interacting proteins(56). Therefore, we compare the distribution of gene expression profiles for the two gold standard sets and our predicted protein-pairs by 3D-domain interolog mapping with the score exceeding 0.4 and 0.6 (Figure 20). The protein pairs composed of the same protein are not used to calculate the gene expression profiles because their expression profiles must be identical and should not be taken account of. Figure 21 shows that the distribution of the correlation coefficients of our predicted protein pairs is similar to the core set of DIP (Positives) and right shift to non-interacting protein pairs (Negatives).
Then we used standard two sample T-test to test the mean of correlation coefficient for our predicted protein-pairs to non-interacting protein pairs. The E values of the two sets are 10-30 and 10-26, respectively. The result indicates that the prediction based 3D-domain interolog yields many reliable interacting protein pairs indicates whose mean is significant higher than that for non-interacting protein pairs.
3.6 Application: Prediction of protein interactions in seven common
organisms
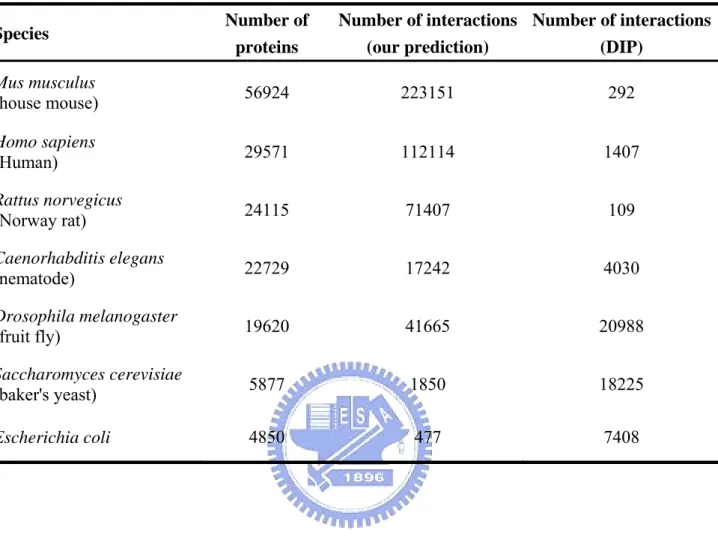
In the above section, we have verified our method in two data sets and obtained a reasonable threshold for normalized specific interfacial energy about 0.4~0.5. Here we apply 3D-domain interologs mapping to prediction protein interactions in seven organisms commonly used in molecular research, including Mus musculus (house mouse), Homo sapiens (Human), Rattus norvegicus (Norway rat), Caenorhabditis elegans (nematode), Drosophila