國 立 交 通 大 學
材料科學與工程學系碩士班
碩士學位論文
準分子雷射處理對於二氧化鈦奈米管陣列之型態與結構之影響
Structural and morphological transformation of titania nanotube arrays
induced by excimer laser treatment
研 究 生:阮文勝
指導教授:呂志鵬 博士
準分子雷射處理對於二氧化鈦奈米管陣列之型態與結構之影響
Structural and morphological transformation of titania nanotube arrays induced by excimer laser treatment
研 究 生:阮文勝 Student: Nguyen Van Thang 指導教授:呂志鵬 博士 Advisor: Dr. Jihperng (Jim) Leu
國立交通大學 材料科學與工程學系
碩士論文
A Thesis
Submitted to Department of Materials Science and Engineering
College of Engineering
National Chiao Tung University
In partial Fulfillment of the Requirements
for the Degree of
Master
in
Materials Science and Engineering
August, 2010
Hsinchu, Taiwan, Republic of China
I 準分子雷射處理對於二氧化鈦奈米管陣列之型態與結構之影響 研 究 生:阮文勝 指導教授:呂志鵬 博士 國立交通大學 材料科學與工程學系碩士班
摘要
結晶型二氧化鈦奈米管陣列(TNAs)近年來受到廣大的矚目與應用;其中在各種 結晶技術中,準分子雷射退火由於其快速與低溫的特性,而成為受重視的退火技術。 而在此研究中,將對於雷射退火之功率(fluence)與頻率 (number of laser pulses)等退火條 件對於二氧化鈦奈米管陣列的結晶性,表面形態和電子架構進行研究與討論。在此研究中,以 0.5 wt% NH4F 和 3 wt% H2O 的乙二醇(ethylene glycol, EG)溶液為電解 質,進行陽極處理以形成高深寬比的二氧化鈦奈米管陣列。實驗在室溫下使用兩個電 極式電化學系統(陰極為 SS304 不鏽鋼),在 20V 恆定的直流電壓為反應 24 小時。之後, 在室溫與大氣下進行二氧化鈦奈米管陣列之準分子雷射退火。處理完之樣品將以 X 光 繞射 (XRD)、掃描電子顯微術(SEM) , X 光近緣結構(XANES) 與以及拉曼光學進行材料 分析與討論。 XRD 結果顯示準分子雷射之頻率少於 9000 shots,在功率為 0.067 和 0.133 Jcm-2 之間所形成的 TNAs 為 anatase 相,當從 0.133 Jcm-2增加到 0.4 Jcm-2時,TNAs 的相轉 變成 anatase 和 rutile 相。另外,TNAs 以雷射在 0.1 Jcm-2的功率下,頻率少於 9000 時
II
將從非晶相改變到 anatase。換句話說,當頻率比 9000 高時,在 TNAs 上的雷射退火從 非晶相轉變到 anatase 和 rutile 相。FESEM 表面型態顯示 TNAs 表面的損害隨著功率增 加與頻率增加而更加嚴重。經由上述結果,雷射所引起的相轉變機制將以雷射理論和 結晶動力學來討論。另外,TNAs 結晶像的定量分析將使用 XRD 結果與理論加以計算 與討論。此外,我們將提出一種新實驗方式來降低表面損壞和改進準分子雷射並增加 的 TNAs 的結晶性. 最後,在此研究中,以準分子雷射進行二氧化鈦奈米管陣列退火處 理功率在大於或等於 0.042 Jcm-2時,較低的價數:二價(TiO)以及三價(Ti 2O3)也會因退 火處理轉變成四價(TiO2) 。
III
Structural and morphological transformation of titania nanotube arrays induced by excimer laser treatment
Student: Nguyen Van Thang Advisor: Dr. Jihperng (Jim) Leu
Department of Materials Science and Engineering
National Chiao Tung University
Abstract
Crystallization of TiO2 nanotube arrays (TNAs) has received extensive interest for their attractive applications. Among various crystallization techniques, excimer layer
annealing is one of prominent technologies because it is a fast and effective low-temperature
annealing technique for forming crystalline TNAs. The influence of laser annealing
conditions such as fluence and number of laser pulses on the crystallinity, surface morphology
and electronic structure of TNAs were investigated.
In this study, TiO2 nanotube arrays with high aspect-ratio have been prepared by anodic oxidation in an electrolyte including ethylene glycol, 0.5 wt% NH4F, and 3 wt% H2O. All anodization experiments were carried out at room temperature using a two-electrode
electrochemical cell consisting of a stainless steel foil (SS304) as the cathode and a Ti foil as
the anode, at constant DC potential at 20 V for 24 hours. Subsequently, TNAs were irradiated
by laser in air at room temperature. Samples are analyzed using following techniques: X-Ray
Diffraction (XRD), Scanning Electron Microscopy (SEM), X-Ray Near Edge Spectroscopy
IV
The XRD results show that TNAs annealed by laser at fluence between 0.067 and
0.133 Jcm-2 under 9000 shots yield anatase phase, while at fluence from 0.133 to 0.4 Jcm-2, 9000 shots, TNAs possess both of anatase and rutile phases. In addition, TNAs annealed by
laser at fluence of 0.1 Jcm-2 and shots less than 9000 will be transformed from amorphous to anatase. On the other hand, when shots are higher than 9000, laser annealing on TNAs leads
to phase transformation from amorphous to anatase and rutile. FESEM images show that
damage of TNAs surface increases with increasing fluence as well as the number of shots.
Moreover, the mechanism for laser-induced structural transformation will be proposed in
terms of laser-matter theory and crystallization kinetics. In addition, the phase composition of
TNAs has been calculated based on XRD results and the matrix flushing method. Then, a new
experimental mode was designed to reduce the surface damage as well as improve the
crystallinity of TNAs induced by ELA. Finally, ELA process with fluences at 0.042 Jcm-2 or above results in all of lower charge state Ti+2 (TiO) and Ti+3 (Ti2O3) of Ti cations transferred toTi4+ (TiO2). The physical mechanisms responsible for this conclusion were proposed.
V
Acknowledgements
This thesis was carried out in the duration from September 2008 until August 2010 at
the Department of Materials Science and Engineering, National Chiao Tung University under
the supervision of Dr. Jihperng (Jim) Leu.
First of all, I would like to express my gratitude to my advisor Dr. Jihperng (Jim) Leu
who was always willing to stimulate my ideas and provide me great guidance for completing
this thesis. I thank him very much.
I would also like to thank Dr. Fu-Ming Pan, Dr. Li Chang, and Dr. Tsang-Shiew Huangfor kindly participating in my thesis committee.
In addition, I would like to thank all of my friends in Nano-Interconnect & Package
(NIP) laboratory for their help. For these years, NIP lab has already been my second home
during my study in Taiwan. I feel very happy and comfortable to be one of NIP member.
Moreover, I also thank to seniors at NIP Lab: special thanks to Mr. Ming-Yi Hsu for
his guidance, experimental assistance, and many useful discussions, special thanks to Mr.
Chih Wang for laser beam-time arrangement, for his help of XRD and XAS measurement. I
would like to thank to everyone in my NIP Lab for being so friendly. I would like to thank to
Gavin Liu, Yu-Hen Chen, Kuo-Yuan Hsu, Kima Che, Hsin- Ling Hsu, Alan Tu, Tai In Lin,
Po-Cheng Lai, Christine Chiu for nice office atmosphere, and the fellowship at work and
during life events.
I would like to thank Bao Dong, Hong Hanh, Thuy Chi, who are excellent colleagues
and friends. To my Vietnamese friends, I am very grateful for having you as my friends.
Last but not least, I would like to thank my grandmother, my parents, and my sisters
VI
Contents
摘要 ... I Abstract ... III Acknowledgements ... V Contents ... VI Table Captions ... IX Figure Captions ... X Abbreviations ... XIII Chapter 1 Introduction ... 1Chapter 2 Literature Review... 4
2.1 Introduction of TiO2 Materials ... 4
2.1.1 Crystal Structure, and Properties of Titanium Dioxide ... 4
2.1.2 Review on TiO2 nanotube Arrays: Fabrication, Properties, and Applications ... 6
2.2 Excimer Laser Crystallization of TiO2 ... 9
2.2.1 Laser-Solid Interaction ... 9
2.2.2 Eximer Laser Crystallization of TiO2 ... 10
2.3 Applications of ELA for Flexible Substrate Devices, and other Applications ... 11
Chapter 3 Experimental ... 13
3.1 Sample Preparation ... 13
3.2 Film Annealing ... 14
3.2.1 Excimer Laser Annealing (ELA) System ... 14
3.2.2. The Post-annealing Treatment of TNAs/Ti by Furnace ... 17
3.3Analytical Techniques ... 18
VII
3.3.2 X- ray Absorption ... 19
3.3.3 Raman Spectroscopy ... 20
3.3.4 Scanning Electron Microscopy (SEM) ... 22
Chapter 4 Results and Discussion ... 23
4.1 Structure of Titaniananotube Arrays (TNAs) ... 23
4.2 The Effect of Excimer Laser Annealing Conditions on Microstructure and Surface Morphology of TNAs ... 25
4.2.1 The Effect of Laser Fluence on TNAs ... 25
4.2.1.1 The Effect of Laser Fluence on the Crystallization of TNAs ... 25
4.2.1.2 The Effect of Laser Fluence on Surface Morphology of TNAs ... 28
4.2.2 The Effect of the Number of Laser Pulses (shots) on TNAs ... 30
4.2.2.1 The Effect of the Number of shots on the Crystallization of TNAs ... 30
4.2.2.2 The Effect of the Number of shots on the Surface Morphology of TNAs ... 31
4.3 Quantitative Analysis of TNAs Multi-phase Structure based on XRD Results ... 33
4.4 The Transformation of Impurities TiO, Ti2O3 in TNAs to TiO2 induced by ELA ... 36
4.4. 1 XRD Results ... 36
4.4.2 XANES Results ... 37
4.5 The Improvement of Crystallinity and the Reduction of Surface Damage of TNAs Induced by Excimer Laser Treatment with new Experimental Mode ... 46
4.6 The Explanation of Microstructure and Surface Morphology Modification of TNAs Induced by Laser annealing ... 52
Chapter 5 Conclusions and Suggestions for Future Work ... 57
5.1 Conclusions ... 57
5.2 Suggestions for Future Work ... 59
IX
Table Captions
Table 2-1 TiO2 rutile and anatase structures and physical properties ... 5 Table 4-1 The anatase, rutile X-Ray peaks intensities and weight percentage of anatase,
rutile in samples annealed by furnace and laser. A: anatase, R: rutile ... 36
Table 4-2 Intensity ratios of the orbitals for Ti L3 edge of TNAs prepares by anodic oxidation as grown in NH4F solution, followed by laser annealing with fluences of 0.042 Jcm-2, and 0.1 Jcm-2 at 9000 shots ... 40 Table 4-3 Fitting results for the amount of crystalline and amorphous phases and
impurities of TNAs as-grown in NH4F solution and followed by post annealing at 400oC, and laser annealing with fluences of 0.042 Jcm-2, and 0.1 Jcm-2 at 9000 shots ... 46
Table 4-4 The experimental parameters used in parallel and tilted modes ... 47
Table 4-5 The anatase X-Ray peaks intensities and weight percentage of anatase in TNAs
X
Figure Captions
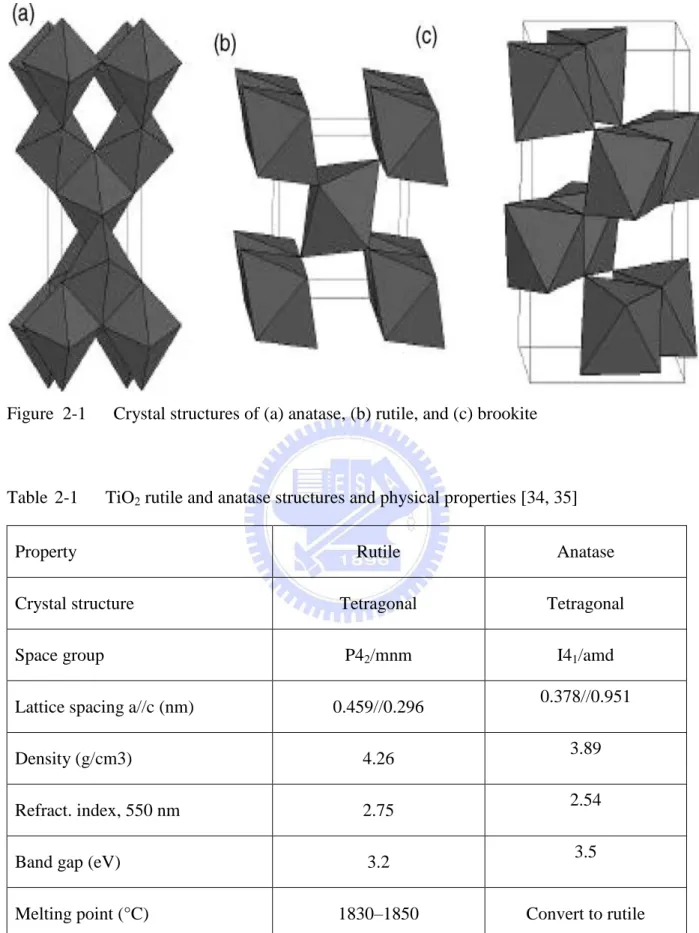
Figure 2-1 Crystal structures of (a) anatase, (b) rutile, and (c) brookite ... 5
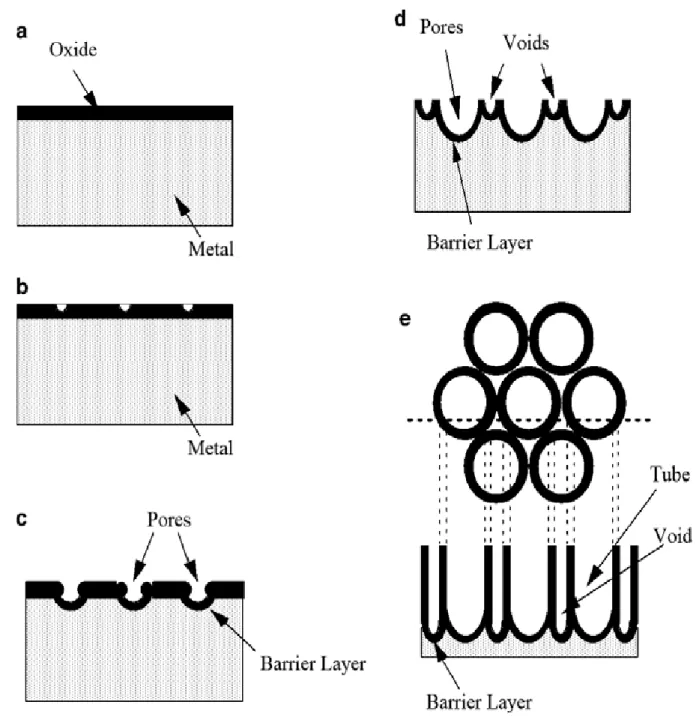
Figure 2-2 Schematic diagram of nanotube evolution at constant anodization voltage: (a) Oxide layer formation, (b) pit formation on the oxide layer, (c) growth of the pit into scallop shaped pores, (d) the metallic region between the pores undergoes oxidation and field assisted dissolution, and (e) fully developed nanotubes with a corresponding top view ... 8
Figure 3-1 Schematic diagram of anodization reaction system ... 14
Figure 3-2 Schematic of the experimental setup for laser anneal of TNAs/Ti samples ... 15
Figure 3-3 Schematic of laser anneal of TNAs/Ti samples in parallel mode ... 15
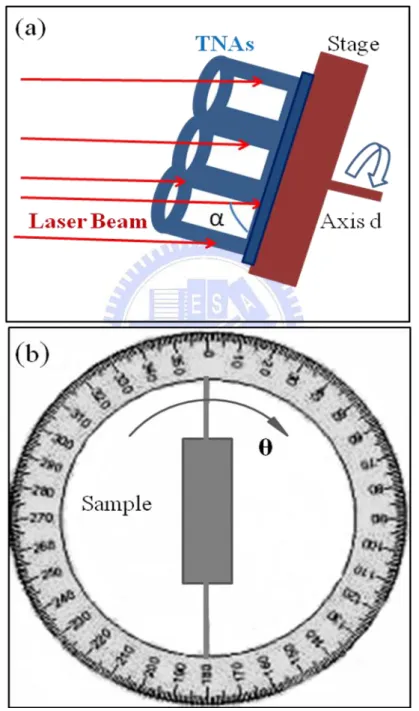
Figure 3-4 Schematic of laser anneal of TNAs/Ti samples: (a) side view and (b) top view in tilted mode ... 16
Figure 3-5 Schematic diagram of furnace with 3-zone temperature controllers ... 17
Figure 3-6 Temperature profile in the furnace annealing ... 18
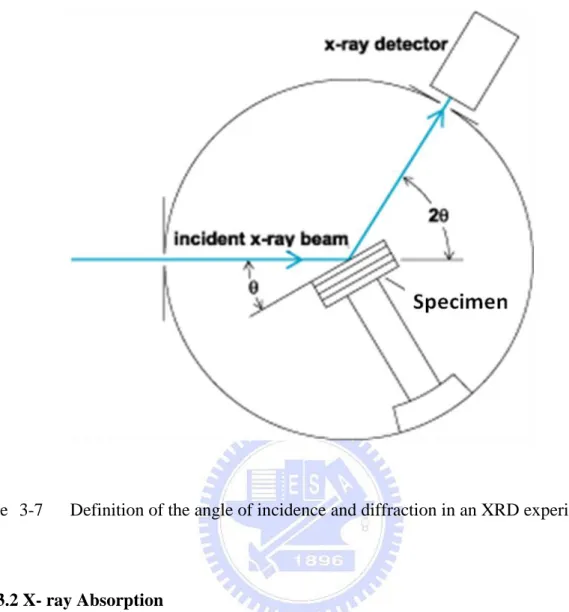
Figure 3-7 Definition of the angle of incidence and diffraction in an XRD experiment .... 19
Figure 3-8 Energy level diagrams showing the states involved in Raman signal ... 22
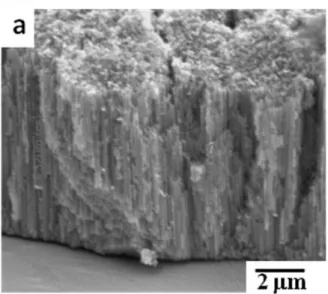
Figure 4-1 FESEM images of TiO2 nanotubes arrays prepared by anodic oxidation in NH4F solution. (a) Cross sectional image and (b) top view image ... 24
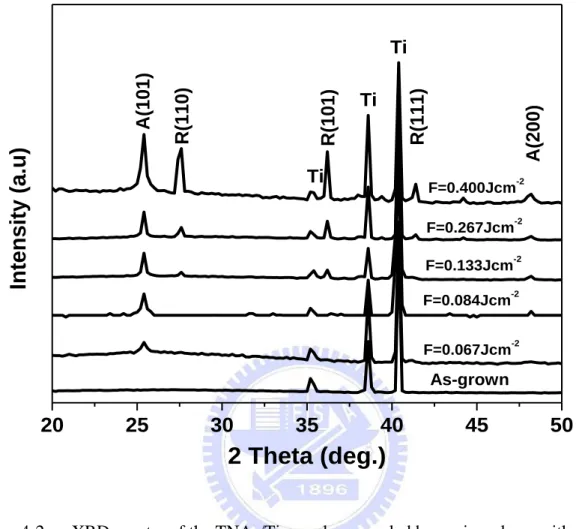
Figure 4-2 XRD spectra of the TNAs/Ti samples annealed by excimer laser with various fluences at 9000 shots ... 26
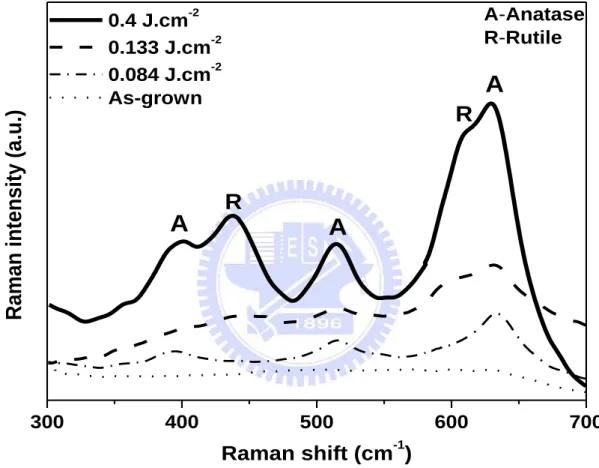
Figure 4-3 Raman spectra of TNAs/Ti samples as-grown and annealed by laser with various fluences at 9000 shots (Raman laser radiation: 632.8 nm) ... 27
Figure 4-4 Surface morphology and cross sectional images of TNAs annealed by laser with different fluences: (a) 0.067 Jcm-2, (b) 0.084 Jcm-2, (c) 0.133 Jcm-2, (d) 0.267 Jcm-2, and (e) 0.4 Jcm-2 at 9000 shots ... 29
XI
Figure 4-5 XRD spectra of the TNAs/Ti samples annealed by laser with various shots at
0.1 Jcm-2 of fluence ... 31 Figure 4-6 Surface morphology and cross sectional images of TNAs annealed by laser with
(a) 3000 shots, (b) 9000 shots, and (c) 18000 shots at 0.1 Jcm-2 of fluence ... 32 Figure 4-7 XRD spectra of the TNAs/Ti samples annealed by the furnace and by laser with
different conditions ... 35
Figure 4-8 XRD spectra of TNAs/Ti samples annealed by laser with fluences of 0.042 and
0.1 Jcm-2 at 9000 shots ... 36 Figure 4-9 Ti L2,3 edge XANES spectra of TiO2 nanotube arrays prepared by anodic
oxidation in NH4F solution: as-grown, and annealed by laser at different
fluences of 0.042 Jcm-2 and 0.1 Jcm-2 at 9000 shots ... 39 Figure 4-10 O K-edgeXANES spectra of TiO2 nanotube arrays prepared by anodic
oxidation in NH4F solution: as-grown and annealed by by laser at different fluences of 0.042 Jcm-2 and 0.1 Jcm-2 at 9000 shots ... 42 Figure 4-11 Fitting results for O K-edge XANES spectrum of as-grown TNAs ... 44
Figure 4-12 Fitting results for O K-edge XANES spectrum of TNAs annealed by laser with
fluence of 0.042 Jcm-2 at 9000 shots ... 44 Figure 4-13 Fitting results for O K-edge XANES spectrum of TNAs annealed by laser with
fluence of 0.1 Jcm-2 at 9000 shots ... 45 Figure 4-14 Fitting results for O K-edge XANES spectrum of TNAs annealed at 400o C ... 45 Figure 4-15 Schematic of experimental modes for laser anneal of TNAs/Ti samples: (a)
parallel mode and (b) tilted mode. ... 47
Figure 4-16 Surface morphology of TNAs annealed by laser in (a) parallel mode, tilted
mode at tilted angle of (b) 60o, (c) 15o, and (d) 5o. ... 49 Figure 4-17 Surface morphology of TNAs annealed by laser in tilted mode at tilted angle 5o,
XII
Figure 4-18 The XRD spectra of TNAs/Ti samples irradiated by laser using parallel mode
and tilted mode, and post-annealed by furnace at 400oC ... 51
Figure 5-1 Schematic diagram of original laser beam profile ... 60
Figure 5-2 Schematic diagram of the laser annealing system ... 61
Figure 5-3 Schematic diagram of Imaging Homogenizer system ... 62
Figure 5-4 Line–shaped and homogenized of laser beam ... 63
XIII
Abbreviations
ELA: Excimer Laser Annealing
TNAs: Titania Nanotube Arrays
XRD: X-ray Diffraction
SEM: Scanning Electron Microscopy
XAS: X-ray Absorption Spectroscopy
XANES: X-ray Absorption Near Edge Structure
A: Anatase
1
Chapter 1 Introduction
On a technological point of view, TiO2material presents a lot of interest because of its wide range of applications, including photocatalytic devices [1], electrochromic [2], sensors
[3], and dye-sensitized solar cell (DSSC) application [4]. The applications of TiO2 are primary determined by its properties, such as crystallite structure, specific area, particle size, porosity
and thermal stability. In recent years, various forms of nanostructure TiO2, such as nanoparticles, nanorods, nanowires and nano-tubes, have attracted significant research interest
[5-6]. Nano-tubes arrays have a higher specific surface area than nanowires or nanorods of
1-D structure due to the additional surface area. In this research, TiO2 nano-tubes were developed by anodic oxidization. The first report on electrochemical anodization was given
by Zwilling et al. [7] with nano-tube arrays up to a length of 500nm (10:1 aspect ratio) grown
in a HF-based aqueous electrolyte. Besides, several neutral electrolytes also have recently
been employed to prepare anodized titania nano-tubes with higher aspect ratio [8-9]. These
studies have shown that high-aspect-ratio, self-organized TiO2 nano-tubes with 100:1 aspect ratio could be obtained from ethylene glycol solution.
In addition, focusing on photocatalytic applications, anatase TiO2 has the highest specific surface area among the TiO2 structural phases (rutile, anatase, brookite) making anatase TiO2 the most desired structure [10]. Furthermore, anatase TiO2 with higher crystalline is preferred for photocatalysis, because higher crystalline means fewer defects for
the recombination of electrons and holes [11-12]. Hence, many research efforts have focused
on how to control the TiO2 crystallite structures. Post-annealing treatment has been often used to transform amorphous TiO2 to crystalline phases [13-14]. Yet, conventional annealing by means of furnace, which typically takes minutes to hours to obtain phase transition at high
temperature around 600oC, cannot be used in low-temperature processing [15]. Thus, there is
low-2
temperature for applications such as flexible devices or sensors. Excimer laser annealing
(ELA) technique is one of the preferred low temperature processing technologies for several
advantages [16-26]. First, the treatment time using ELA technique is in the 25 ns range for
TiO2 transformation, which is ten orders of magnitude faster than the conventional annealing method. Second, under treatment by ELA, large amount impurities of TiO, and Ti2O3 inside as-grown TNAs prepared by anodic oxidation in NH4F solution have found to be converted to TiO2. Third, ELA offers selective absorption and low processing temperature [16-18], so it has been widely used in the semiconductor technology. For instance, laser annealing has
gained interest for the fabrication of ferroelectric thin films at low the temperature and short
duration of treatment [19]. In addition, laser annealing of Pb(Zr, Ti)O3 (PZT), PbTiO3 (PT), SrTiO3, SrBi2Ta2O9 (SBT) thin films showed that the thin films could be crystallized at a lower temperature and have a good dielectric properties [20-24]. Poly-Si thin film transistors
(TFTs) also can be formed on glass substrates by using excimer laser annealing without
thermal damage [25], etc. Finally, ELA might improve electrical properties of TiO2 [26]. In this thesis, the microstructures and impurities of TiO2 nanotube arrays induced by ELA were investigated as a function of laser annealing conditions including fluence and shots.
The mechanism of phase transformation, impurities evolution and the surface morphology
modification of TNAs induced by laser irradiation were examined and proposed. After that a
new experimental mode was designed and carried out to eliminate the surface damage as well
as improve the crystallinity of TNAs induced by ELA. In addition, the phase composition of
TNAs has been calculated based on XRD results and the matrix flushing method. Finally, the
effect of ELA on the charge transfer for Ti cations from lower charge state Ti+2 and Ti+3 of impurities TiO and Ti2O3 to Ti4+ (TiO2) is investigated by using X-ray absorption near-edge structure spectroscopy (XANES). Physical mechanisms responsible for their difference in
3
This thesis consists of five chapters. Chapter 1: Introduction, Chapter 2: Literature
Review, Chapter 3: Experimental Techniques, Chapter 4: Results and Discussion, and
Chapter 5: Conclusions and Suggestions for Future Work.
4
Chapter 2 Literature Review
2.1 Introduction of TiO2 Materials2.1.1 Crystal Structure, and Properties of Titanium Dioxide
Titanium dioxide, also known as titanium (IV) oxide or titania, is the naturally
occurring oxide of titanium, chemical formula TiO2. Titanium dioxide may exist in amorphous or polycrystalline structure. Titanium dioxide occurs in nature as well-known
minerals rutile, anatase and brookite. The structures of rutile, anatase and brookite can be
discussed in terms of (TiO62-) octahedrals. The three crystal structures differ by the distortion of each octahedral and by the assembly patterns of the octahedral chains. Anatase can be
regarded to be built up from octahedrals that are connected by their vertices, in rutile, the
edges are connected, and in brookite, both vertices and edges are connected (Figure 2-1).
However, only rutile and anatase are commercially important. In bulk form and with a large
crystallite size, rutile is the thermodynamically stable form at normal pressure and at all
temperatures up to its melting point. With a very small crystallite size, anatase is shown to be
the stable form. Anatase is the usual product in inorganic syntheses. Anatase formation from
an amorphous solid is reported to occur at around 400-450ºC [27, 28, 29], and direct synthesis
from a molecular precursor in solution is common knowledge [30]. The anatase to rutile
transformation is a metastable to stable transition which has been studied for some decades
[31, 32]. There is no unique transformation temperature but in the experimental studies the
transition has occurred at 400-1000ºC with the rate and ignition temperature being critically
dependent on synthesis conditions. However, a transition temperature of 600ºC at normal
pressure for bulk TiO2 was presented in the experimental phase diagram [33]. Properties of the important TiO2 polymorphs of rutile and anatase are presented in Table 2-1 [34, 35].
5
Figure 12-1 Crystal structures of (a) anatase, (b) rutile, and (c) brookite
Table 12-1 TiO2 rutile and anatase structures and physical properties [34, 35]
Property Rutile Anatase
Crystal structure Tetragonal Tetragonal
Space group P42/mnm I41/amd
Lattice spacing a//c (nm) 0.459//0.296 0.378//0.951
Density (g/cm3) 4.26 3.89
Refract. index, 550 nm 2.75 2.54
Band gap (eV) 3.2 3.5
6
2.1.2 Review on TiO2 nanotube Arrays: Fabrication, Properties, and Applications
In recent years, nanostructural TiO2 is one of the most widely studied materials due to its unique and excellent properties in optics, electronics, photochemistry and biology, as well
as its applications in photovoltaic cells, sensors, and photocatalysis [36–38]. Among the
various forms of nanostructural TiO2 such as nanoparticles, nanorods, nanowires and nano-tubes, TiO2 nano-tubes arrays has attracted increasing interest due to its highly ordered structure, high specific surface area and the convenient controlling of the size. Fabrication,
properties, and applications of TiO2 nanotubes have been reviewed, and the highly ordered TiO2 nanotube arrays made by anodic oxidation in fluoride-contained electrolytes highlighted. The first report on electrochemical anodization was given by Zwilling et al. [7] with
nano-tube arrays up to a length of 500nm (10:1 aspect ratio) grown in a HF-based aqueous
electrolyte. Besides, several neutral electrolytes also have recently been employed to prepare
anodized titania nano-tubes with higher aspect ratio [8-9]. These studies have shown that
high-aspect-ratio, self-organized TiO2 nano-tubes with 100:1 aspect ratio could be obtained from ethylene glycol solution.
The mechanism of TiO2 nannotube arrays formation is presented as following. As the anodization started, the initial oxide layer [39], formed due to interaction of the surface Ti4+ ions with oxygen ions (O2-) in the electrolyte, can be seen to homogeneously spread across the surface. At the anode oxidation of the metal releases Ti4+ ions and electrons, shown as [40]:
Ti + H2O = TiO2 + 2H+ + 4e- (1) At the cathode hydrogen evolution occurs:
8H+ + 8e- = 4 H2 (2) The overall process of oxide formation is given by:
Ti + 2H2O = TiO2 + 2H2 (3) The ions being mobile in the anodic layer under the applied electric field react with Ti4+
as
7
TiO2 + 6F- + 4H+ = TiF62- + 2H2O (4)
Ti(OH)4 +6F- = TiF62- + 4OH- (5) Ti4+ + 6F- = TiF62- (6) Schematic diagram of nanotube evolution at constant anodization voltage is illustrated in
Figure 2-2. As seen in Figure 2-2 (b) , small pits formed due to the localized dissolution of the
oxide as represented by the (4), act as pore forming centers, after which these pits convert into
pores with increasing pore density, uniformly, over the surface (Figure 2-2 (c)). The pore
growth occurs due to the inward movement of the oxide layer at the pore bottom (barrier layer)
[39, 43]. As the pores grow deeper the electric field in these protruded metallic regions
increases, enhancing field assisted oxide growth and oxide dissolution, and hence inter-pore
voids start forming (Figure 2-2 (d)). Both voids and tubes grow in equilibrium. The thickness
of the tubular structure stops increasing when the chemical dissolution rate of the oxide at the
mouth of the tube becomes equal to the rate of inward movement of the metal/oxide boundary
at the base of the tube. Higher anodization voltages increase the oxidation and field-assisted
dissolution and hence, a greater nanotube layer thickness can be achieved before equilibrating
8
Figure22-2 Schematic diagram of nanotube evolution at constant anodization voltage: (a)
Oxide layer formation, (b) pit formation on the oxide layer, (c) growth of the pit into scallop shaped pores, (d) the metallic region between the pores undergoes oxidation and field assisted dissolution, and (e) fully developed nanotubes with a corresponding top view [42]
The excellent biocompatibility of TiO2, the high orientation, the large surface area with tunable pore sizes, as well as the high electron transfer rate along with the nanotubes
9
make TiO2nanotube arrays an ideal substrate for a lot of applications. TiO2 nanotubes can use in photocatalytic devices [1], electrochromic [2], sensors [3], dye sensitized solar cells [4].
Furthermore, the nanotube arrays have demonstrated great utility in biomedical related
applications including biosensors, molecular filtration, drug delivery, and tissue engineering
[44–50]. To obtain these applications the crystallization of TiO2 nanotube arrays is required.
2.2 Excimer Laser Crystallization of TiO2
2.2.1 Laser-Solid Interaction
Electromagnetic radiation with wavelength ranging from ultraviolet to infrared
interacts exclusively with electrons, as atoms are too heavy to respond significantly to the
high frequencies (ν > 1013
Hz) [51]. Therefore, the optical properties of material are
determined by the energy states of its valence electrons. Bond electrons normally weakly
respond to the external electromagnetic wave and affect only its phase velocity. However, free
electrons can be accelerated and therefore extract energy from the field. Since the field is
periodically changing, the oscillating electrons reradiate their kinetic energy or collide with
the atoms, giving their energy to the lattice.
Absorption of incident energy fundamentally dictates the resultant thermal state of the
material and therefore is a suitable point to begin an analysis of laser-solid interactions. The
mechanisms involved in absorption of incident radiation in materials are defined by the
electronic structure of the material, and therefore it is useful to discuss exclusively
semiconductors. In semiconductors, five distinct mechanisms for the absorption of light can
be identified [52].
1) Photons with energy (hν) much less than the band-gap energy (Eg) can excite lattice vibrations directly.
10
2) Free or nearly free carriers can be excited by absorption of light with hν < Eg; such carriers will always be present as a result of finite temperature and doping.
3) An induced metallic-like absorption due to free carriers generated by the laser radiation
itself can occur.
4) For photon energies are larger than Eg, absorption will take place by direct and indirect (photon-assisted) excitation of electron-hole pairs.
5) Absorption induced by broken symmetry of the crystalline lattice is possible.
When a beam of photons of energy hν > Eg is absorbed in a semiconductor, excited carriers, which results in lattice heating [53], is a complicated process and an field of active
research [54]. As incident radiation is converted to increasing lattice temperatures, the
thermophysical properties of the material dictate temperature distribution and phase changes.
This aspect of laser annealing area has been actively investigated [55-59].
2.2.2 Eximer Laser Crystallization of TiO2
The basic mechanism of laser heating proceeds is through photon absorption and the
subsequent rapid transfer of energy from the electrons to the lattice [60-62]. During laser
annealing a beam of photons is focused on a sample. Simply put, the photons interact with the
electrons in the sample which then transfer the energy to the lattice. This causes localized
heating in the area where the photons hit the sample. More specifically, the wavelength of this
light determines how the energy will be absorbed in the TiO2. The energy of the beam, or incident photon energy, is determined by the equation:
E = hc/λ
with h equal to Planck’s constant, c equal to the speed of light, and equal to the wavelength of the laser. With the bandgap of TiO2 around 3 eV, laser energy greater than this bandgap results in absorption via band-to-band transitions, which results in the desired heating of the
11
amorphous to anatase TiO2, it is necessary to overcome an activation energy (Eα-A) of 137 kJ/mol [64]. In contrast, higher activation energy (EA-R), 350 to 500 kJ/mol [65-66] is required to enable the phase transition from anatase to rutile.
2.3 Applications of ELA for Flexible Substrate Devices, and other Applications
High temperature processing steps such as thermal annealing that are incompatible
with plastic substrates are still a major hindrance. Laser annealing permits localized energy
input without affecting the underlying substrate and can help overcome this problem.
In semiconductor technology, laser crystallization has been widely used for advantages of
selective absorption and low substrate temperature.Moreover, the scanning area can be freely
selected without heating other regions. The adoption of this technique can incorporate the
fabrication of ferroelectric thin films into large scale integrated circuit processing and make
mass production possible. For example, the ferroelectric perovskite phase in PbZr0.44Ti0.56O3 (PZT) films on glass substrates were carried out by using laser annealing [63]. The substrates
were kept at room temperature during the whole fabrication process. This work has made the
processing of ferroelectric films compatible with Si integrated circuit technology. The other
advantage of laser annealing technique is that ferroelectric films with random patterns can be
made without heating other parts of a device due to the controllability of the scanning laser
spot. In addition, laser annealing at 200° C substrate temperature of SrTiO3 films deposited at
200° C shown the improvement of the crystallinity of the films [67]. Several reports also have
been presented on the study of the laser annealing of Pb(Zr, Ti)O3, PZT, PbTiO3(PT) thin films. The reported data on these materials showed that the thin films could be crystallized at
a low temperature [20-24].
In industry, production of low temperature p-Si back plates for LCDs by high power
12
process, one of the major advantages of excimer laser annealing is the opportunity to make
use of low cost glass substrates due to the low temperature of the annealing process [68].
Beside two excellent major advantages of selective absorption and low substrate
temperature of eximer laser annealing technique, the improvement of electrical properties of
materials induced by excimer laser irradiation is presented. Recently, Heng Pan [69] et al
demonstrated the excimer laser annealing of metal oxide (ZnO) nanoparticles to improve the
electrical properties in producing field effect transistors (FETs). In addition, good dielectric
properties of Pb(Zr, Ti)O3, PZT, PbTiO3 (PT) thin films obtained after excimer laser irradiation. The influence of laser treatment on electrical properties of TiO2 thin films has been reported by J. H. Kim et al [26]. This research showed that the permittivity of TiO2 films increase with increasing laser powers and the number of laser shots at constant laser power. It
can be explained that laser-irradiation of TiO2 films at room temperature produced oxygen vacancies at the film surface and new Ti valences. The electrons and space charges produced
through the defect chemistry increased permittivity in laser-irradiated TiO2 films. It opens commercially applications of high permittivity TiO2 films for polymer metal-insulator-semiconductor field-effect transistors (MISFETs).
13
Chapter 3 Experimental
This chapter will cover the experimental method for TNAs preparation, annealing
techniques and characterization of the TNAs. The first section will describe the procedures for
preparing the TNAs samples. All samples used in this work were made with two-electrode
electrochemical cell consisting of a stainless steel foil (SS304) as the cathode and a Ti foil as
the anode, at constant DC potential at 20 V for 24 hours. In addition, annealing systems were
introduced for solid phase crystallization and excimer laser crystallization. The following
section will explain the techniques used to measure the properties of the TNAs. Various
analytic tools were employed to investigate the microstructure, impurities, and morphology of
the TNAs. These techniques include X-ray diffraction (XRD), X-ray absorption spectroscopy,
Raman spectroscopy, and scanning electron microscopy (SEM).
3.1 Sample Preparation
Titanium foil (99.9% purity, 0.05 cm thick) was used as the substrate for forming TiO2 nanotubes by anodic oxidation. Prior to anodization, the Ti foil was ultrasonically cleaned
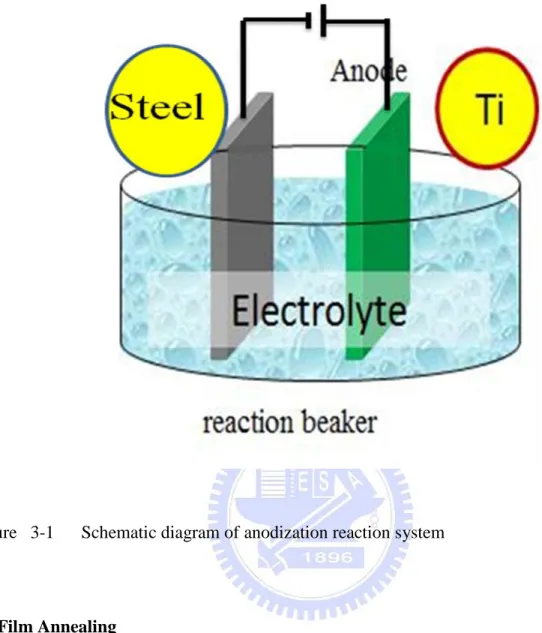
with acetone, ethanol, rinsed with distilled water and then dried by purging N2 gas. All anodization experiments were carried out at room temperature using a two-electrode
electrochemical cell consisting of a stainless steel foil (SS304) as the cathode and a Ti foil as
the anode, at constant DC potential at 20 V for 24 hours. The electrolyte is a mixture of
ethylene glycol, 0.5 wt% NH4F, and 3 wt% H2O. Schematic diagram of anodization reaction system is illustrated in Figure 3-1.
14
Figure 3 3-1 Schematic diagram of anodization reaction system
3.2 Film Annealing
3.2.1 Excimer Laser Annealing (ELA) System
Laser annealing was performed with a Lambda Physik Complex 201 excimer laser
operating at 248 nm wavelength (KrF) and pulse width ~ 25 ns (FWHM). Energy of source
was varied in the laser control system to alter the beam energy and hence energy density on
the sample. Frequency of laser was also varied to change the number of pulses per unit time.
Duration of laser treatment was measured by timer. Schematic diagrams of the laser setup for
15
Figure 4 3-2 Schematic of the experimental setup for laser anneal of TNAs/Ti samples
We designed two modes of experiments: (1) parallel mode and (2) tilted mode. In the
parallel mode, the angle α is set equal 90o
and the stage is fixed as illustrated in Figure 3-3.
16
In the tilted mode, as illustrated in Figure 3-4, the angle α between laser beam and
sample can vary from 0o to 90o. In addition, sample can turn rotate around an axis d, which is perpendicular to sample plane (stage) with a turning angle θ of ranging from 0 to 3600 (Figure 3-4 (b)).
Figure63-4 Schematic of laser anneal of TNAs/Ti samples: (a) side view and (b) top view in tilted mode
17
3.2.2. The Post-annealing Treatment of TNAs/Ti by Furnace
The TNAs/Ti samples were annealed in ambient using a conventional furnace. A
tungsten wire heater was rolled around the quartz tube to create a homogeneous temperature
in the furnace. The schematic of the furnace is shown in Figure 3-5. Moreover, Figure 3-6
shows the diagram of temperature profile for annealing of TNAs/Ti samples in the furnace.
18
Figure83-6 Temperature profile in the furnace annealing
3.3Analytical Techniques
3.3.1 X-ray Diffraction (XRD)
X-ray diffraction (XRD) is a non-destructive tool for analyzing material properties
such as crystallinity, the phase identification, and orientation. In addition, grain size and strain
can also be easily analyzed with this technique.
XRD was utilized to analyze the crystallinity, the phase identification of TNAs/Ti
samples. The samples were scanned by Siemens Diffractometer D5000 (NCTU) with Cu Kα
(λ=1.5405Å) source and using synchrotron beamline 17 B1 at National Synchrotron Radiation Research Center in Hsinchu, Taiwan (NSRRC). During scanning period, X-ray beam of
wavelength λ was irradiated to the sample at an angle θ, and the diffracted intensity at an angle 2θ was recorded by a detector as illustrated in Figure 3-7. All of scans use θ-2θ mode with 2θ ranging from 20o
19
Figure93-7 Definition of the angle of incidence and diffraction in an XRD experiment
3.3.2 X- ray Absorption
The XANES measurement were performed using the beam line 20 A of National
Synchorotron Radiation Research Center (NSRRC), Hsinchu, Taiwan. The XANES spectra
were collected in the vicinity of titanium L-edge (445-480 eV) and oxygen K-edge (520-570
eV) regions. All spectra in this thesis were measured in total electron yield mode (TEY) using
a high-energy spherical grating monochrometer with energy resolution of about 1/8000 [70],
by monitoring the total sample photocurrent as a function of photon energy scanned through
Ti L2,3-edge. The overall experimental resolution around the Ti L2,3 edge was 100 meV. All spectra were collected at room temperature and the chamber pressure was about 2x10⁻⁸ Torr or better. The incoming radiation flux was monitored by the total photocurrent produced in a
20
During XANES measurement, the incident X-ray beam was irradiated directly to the
surface of samples. Moreover, X-ray beam was only absorbed by the surface layer sample.
Therefore, the XANES results will describe the characteristics of the surface layer of sample.
With the TNAs were annealed by furnace, the heating sample was homogeneously leading to
the crystalline structure of sample was uniformly. In this case, the properties in entire sample
can be the analyzed basing on XANES results. On the other hand, when the TNAs were
irradiated by laser in parallel mode, the surface layer of sample was annealed by laser first and
following by internal parts of sample. Hence, the XANES results will only explain the
properties of the surface layer of sample annealed by laser.
The incident photo intensity (Io) was calibrated by aligning the Ti L2,3 and O K-edges of a SrTiO3. All the X-ray absorption spectra were then normalized to Io. To perform the fitting for the amount of crystalline, amorphous phases and impurities in TNAs grown in
NH4F solutions and after using excimer laser annealing with specific conditions, we used the intensity ratios of orbitals in the O K-edge according to the published spectra [71-75] to
determine the oxidation states of Ti. The fitting of a mode with various orbitals performed
with a program with the Maximum Likelihood (ML) estimator to match spectra for
experimental spectra [76]. Then the edges from TiO, Ti2O3, TiO2 (anatase) and TiO2 (amorphous) were added to the background. The fitting mode comprises a power-law
background AF-r, where E is the photon energy, A and r are tow parameters to be estimated the amount of oxidation states, crystalline and amorphous phases [76]. More details about
creating a model and its fitting procedure can be found in the literature [76-77].
3.3.3 Raman Spectroscopy
Raman spectroscopy is a spectroscopic technique used in condensed matter physic and
21
on inelastic scattering, or Raman scattering, of monochromatic light, usually from a laser in
the visible, near infrared, or near ultraviolet range. The laser light interacts with phonons or
other excitations in the system resulting in the energy of the laser photons being shifted up or
down. The shift in energy gives information about the phonon modes in the system. The
Raman Effect occurs when light impinges upon a molecule and interacts with the electron
cloud of the bonds of that molecule. The incident photon excites the molecule into a virtual
state. For the spontaneous Raman Effect, the molecule will be excited from the ground state to a
virtual energy state, and relax into a vibrational excited state, which generates Stokes Raman scattering. If the molecule was already in an elevated vibrational energy state, the Raman
scattering is then called anti-Stokes Raman scattering as shown Figure 3-8. A change in the
molecule polarization potential or amount of deformation of the electron cloud with respect to
the vibrational coordinate is required for the molecule to exhibit the Raman Effect. The
amount of the polarizability change will determine the Raman scattering intensity, whereas
the Raman shift is equal to the vibrational level that is involved.
In this research Jobin Yvon Horiba Scientific Raman Spectrometer was used. All the
Raman spectra were recorded with a double grating spectrometer in backscattering geometry,
at room temperature; the He–Ne laser (632.8 nm) was used for the excitation. The diameter of
22
Figure103-8 Energy level diagrams showing the states involved in Raman signal [78]
3.3.4 Scanning Electron Microscopy (SEM)
Field emission scanning electron microscopy (FESEM) (JEOL 6700F) was employed
to examine the surface structure and the cross sectional morphology of the TiO2 nano-tubes films annealed by the furnace and excimer laser. The JEOL 6700F was operated at 15kV,
while the emission current was set at 10 µA and the operating pressure was under 9.6 x10⁻⁵ Torr.
23
Chapter 4 Results and Discussion
4.1 Structure of Titaniananotube Arrays (TNAs)Figure 4-1 illustrates the surface and cross-section morphology of TNAs prepared by
anodic oxidation in NH4F solution. As seen in Figure 4-1 (a) self-organized regular porous TiO2 structure consists of pore arrays with a uniform pore diameter of approximately 50 nm, wall thickness of 20 nm. TNAs of 7 µm (140:1 aspect ratio) in length were obtained using a
high viscosity ethylene glycol electrolyte with 0.5 wt% NH4F, and 3 wt% H2O as shown in Figure 4-1 (b). It has been proposed that neutral solutions suppress the chemical dissolution of
oxidized TiO2 in comparison with acidic aqueous solutions like aqueous HF [79-80]. Dimethyl sufoxide and ethanol mixed solutions were found to yield TO2 nano-tubes with approximately 2 µm length after 70 h anodization [79], displaying a rather low growth rate for
neutral non-aqueous electrolytes. In addition, Cai et al [80] reported that TiO2 nano-tubes of 4.4 µm in length was prepared by adding more H2SO4 and citric acids. It clearly showed that both the electrolyte and pH value are critical factors controlling the nano-tube morphology
and its growth rate. The key for obtaining high-aspect-ratio growth is to adjust the ionic
diffusion coefficient of electrolyte, which was responsible for maintaining a high H+ concentration at the pore bottom with a protective environment maintained along the pore
24
Figure114-1 FESEM images of TiO2 nanotubes arrays prepared by anodic oxidation in NH4F solution. (a) Cross sectional image and (b) top view image
25
4.2 The Effect of Excimer Laser Annealing Conditions on Microstructure and Surface Morphology of TNAs
4.2.1 The Effect of Laser Fluence on TNAs
4.2.1.1 The Effect of Laser Fluence on the Crystallization of TNAs
Figure 4-2 shows the XRD spectra of TNAs/Ti samples annealed by laser with various
laser fluence values at 9000 shots. As-grown TiO2 nanotube arrays prepared in NH4F solution at room temperature are completely amorphous. When TNAs were irradiated by laser with
fluence between 0.067 and 0.133 Jcm-2, A (101) and A (200) peaks of anatase (A) appeared and no rutile (R) peak was visible. It implies that the amorphous structure was transformed to
polycrystalline anatase after laser irradiation. When fluence range was between 0.133 and 0.4
Jcm-2, anatase peaks became stronger and rutile peaks such as R (110), R (101), and R (111) appeared. Hence, in this case, the ELA process made TNAs transform from amorphous to
anatase and then anatase phase continues transforming to rutile. However, intensities of
anatase peaks are stronger than rutile peaks, indicating that anatase is still the dominant phase.
Moreover, the intensities of anatase peaks as well as rutile peaks increase with the increasing
26
20
25
30
35
40
45
50
R(11 1) As-grown F=0.400Jcm-2 F=0.267Jcm-2 F=0.133Jcm-2 F=0.084Jcm-2 F=0.067Jcm-2 Ti Ti Ti A(20 0) R(10 1) R(11 0) A(10 1)Inte
ns
ity
(a
.u)
2 Theta (deg.)
Figure124-2 XRD spectra of the TNAs/Ti samples annealed by excimer laser with various fluences at 9000 shots
The Raman spectra of as-grown TNAs/Ti samples and annealed by laser with different
fluences of 0.084 Jcm-2, 0.133 Jcm-2, and 0.4 Jcm-2 at 9000 shots are illustrated in Figure 4-3. The vibrational bands corresponding to the four active fundamental modes of anatase are
recorded at 397 cm-1 (B1g), 518 cm-1 (A1g and B1g unresolved) and 640 cm-1 (Eg). No Raman peak is observed in the case of the as-grown sample. Evidence of a crystalline phase started to
show after laser irradiation at fluence of 0.084 Jcm-2. Further increase of laser fluence to 0.133 Jcm-2, the anatase active fundamental modes became stronger and two rutile’s Raman active modes also appeared at 448 cm-1 (Eg) and 613 cm-1 (A1g). It shows more clearly in the case of sample annealed by laser with fluence of 0.4 Jcm-2, all of the Raman active modes of
27
anatase and rutile become higher. It implies that the amorphous phase was continuously
transformed to crystalline phases when fluence increased from 0.133 Jcm-2 to 0.4 Jcm-2. Therefore, we can conclude that the TNAs annealed by laser with fluence of 0.133Jcm-2 or below 9000 shots still remain amorphous phase.
300 400 500 600 700 A-Anatase R-Rutile
R
R
A
A
A
Raman intensity
(a.u.)
Raman shift (cm
-1)
0.4 J.cm-2 0.133 J.cm-2 0.084 J.cm-2 As-grownXRD and Raman results indicate that TNAs irradiated by laser with fluence is less than 0.133 Jcm-2 at 9000 shots contain anatase and amorphous phases, while fluence is higher than 0. 133 Jcm-2, TNAs possess all of amorphous, anatase and rutile phases.
Figure134-3 Raman spectra of TNAs/Ti samples as-grown and annealed by laser with various fluences at 9000 shots (Raman laser radiation: 632.8 nm)
28
4.2.1.2 The Effect of Laser Fluence on Surface Morphology of TNAs
Figure 4-4 shows the surface morphology and cross sectional images of TNAs
annealed by laser with various laser fluences at 9000 shots. When TNAs irradiated by laser
with fluence are less than 0.133 Jcm-2, almost no damage is observed as shown in Figures 4-4 (a) and (b). In contrast, with fluence higher than 0.133 Jcm-2 (Figures 4-4 (c-e)), the surface morphology of TNAs appears to be strongly modified. The cross sectional images of TNAs
show that the damage of tubes appeared only on the top of tubes. Since the laser beam is
irradiated directly to the top of TNAs in parallel mode, the laser energy is transferred from the
top to bottom of tubes, leading to the surface of TNAs received larger energy and was
29
Figure144-4 Surface morphology and cross sectional images of TNAs annealed by laser with different fluences: (a) 0.067 Jcm-2, (b) 0.084 Jcm-2, (c) 0.133 Jcm-2, (d) 0.267 Jcm-2, and (e) 0.4 Jcm-2 at 9000 shots
30
4.2.2 The Effect of the Number of Laser Pulses (shots) on TNAs
4.2.2.1 The Effect of the Number of shots on the Crystallization of TNAs
Figure 4-5 presents XRD spectra of the TNAs/Ti samples annealed by laser with
fluence at 0.1 Jcm-2 and different shots from 3000, 9000 to 18000. The anatase peaks appear in XRD spectra of the TNAs/Ti samples annealed by laser with 3000 or 9000 shots, and no
rutile peaks is observed. It shows that TNAs amorphous is transformed to anatase under these
laser annealing conditions. However, when the shot number is increased to 18000, the rutile
peaks are visible along with the dominant anatase peaks. It suggests that laser anneal of
TNAs/Ti samples with shots higher than 9000 result in transformation of amorphous phase to
anatase and rutile phases. A comparison of TNAs irradiated by 3000 and 9000 shots revealed
that the peak height of anatase A (101), i.e. amount of anatase increases with increasing shot
31
20
25
30
35
40
45
50
A (2 00 ) R(10 1) Ti Ti Ti R(110) A(101)In
tensity
(a.u
)
2 Theta (deg.)
3000shots 18000shots 9000shotsFigure154-5 XRD spectra of the TNAs/Ti samples annealed by laser with various shots at 0.1 Jcm-2 of fluence
4.2.2.2 The Effect of the Number of shots on the Surface Morphology of TNAs
Figure 4-6 shows the surface morphology and cross sectional images of TNAs
irradiated by laser with different shots from 3000, 9000 to 18000 at fluence of 0.1 Jcm-2. As seen in Figure 4-6(a), TNAs irradiated by laser with 3000 shots, few tubes are destroyed.
However, as the shot number is increased to 9000 or 18000 shown in Figure 4-6 (b) and (c),
the broken tubes increase and combine together. As a result, the melting layer is formed on
the top of nanotube arrays. The damage of TNAs surface increases with increasing number of
32
Figure164-6 Surface morphology and cross sectional images of TNAs annealed by laser with (a) 3000 shots, (b) 9000 shots, and (c) 18000 shots at 0.1 Jcm-2 of fluence
33
4.3 Quantitative Analysis of TNAs Multi-phase Structure based on XRD Results
The phase composition of TNAs calculated basing on quantitative analysis of XRD
results. Quantitative analysis of diffraction data usually refers to the determination of amounts
of different phases in multi-phase samples. In this paper, an effort is made to determine
structural characteristics and phase proportions with quantifiable numerical accurateness from
the experimental data. New X-ray diffraction method for quantitative mixture structure
analysis, for example, matrix flushing method has been developed. This is much simpler and
faster than, yet as reliable as, the conventional internal-standard method [81] because the
matrix flushing theory gives a precise relationship between intensity and concentration free
from matrix effect. The analytical procedures are described briefly below.
For specimen containing many components, such as 1, 2, etc., a simple relationship
between intensity and concentration free from matrix effect, can be expressed by Eq. (1)
1 1 2 2
I
I
(1) with 1 2k
k
Where:I1 is intensity of X-rays diffracted by a selected plane (hkl) of component 1;
1
is weight fraction of component 1; k1 is a constant which depends upon the geometry of diffractometer and the nature of component 1.Similarly, I2,2, and k2 parameters are corresponding to component 2.
For comparison and calculation reference, conventional annealing of TNAs/Ti sample
was carried out by a furnace at 400oC for 1 hr. Anatase phase was obtained for
1
A
W = 86 % of
weight (see XANES results). For this sample with two components anatase (A1) and Ti, the relationship can be described by Equation (2) based on Equation (1):
1 1 Ti Ti A A
I
I
(2)34
XRD and SEM results show that all of TNAs/Ti samples irradiated by laser will contain
anatase phase (Aj). Similar to equation (2) for these samples:
j j Ti Ti A A
I
I
(3) Combining Equation (2) with Equation (3):1 1 1 1 j j j j A A A A A A A A W W
I
m
I
m
This leads to 1 1 j j A A A A W WI
I
(4) WhereW
Ajis the weight percentage of anatase in the samples j.For the case of samples including anatase and rutile components, the weight percentage of
rutile, j R W , is calculated through j A W as following: R AR R AR R A A A
I
m
I
m
leads to j j AR R R R A A A W WI
I
where mA and mR are the masses of anatase and rutile, respectively.
This leads to
1
j AR j R R A R A W AI
WI
or finally1.14
j j R R A A WI
WI
(5) where αAR is 0.8 from literature [82], and σ is the density of TiO2 with σA = 3.89 g.cm-3 for anatase and σR = 4.26 g.cm-3 for rutile [34, 35].Figure 4-7 shows XRD spectra of the TNAs/Ti samples annealed by furnace and laser
with different conditions. Accurate values of anatase and rutile peaks can be obtained from
35
20
25
30
35
40
45
50
A(101) R(110) Ti R( 101 ) Ti A(004) A(200) TiInte
nsi
ty
(a.
u)
2 Theta (deg.)
(c)
(b)
(a)
(a) 400oC (b) 0.400 J.cm-2,9000shots (c) 0.084 J.cm-2,9000shotsFrom XRD results (Figure 4-5 and Figure 4-7) and Equations (4) and (5), the anatase
and rutile peaks intensities and weight percentage of anatase, rutile in the samples annealed by
furnace and laser are summarized in the Table 4-1 below.
Figure174-7 XRD spectra of the TNAs/Ti samples annealed by the furnace and by laser with different conditions
36
Table 24-1 The anatase, rutile X-Ray peaks intensities and weight percentage of anatase, rutile in samples annealed by furnace and laser. A: anatase, R: rutile
Annealing conditions
Peaks intensities Weight percentage (%)
IA IR A R
4000 C, 1 hr 243 ---- 86 ---
Various fluences at 9000 shots
0.084 86.9 ---- 30.75 ---- 0.100 87.9 ---- 31.20 ---- 0.400 125.0 68 42.24 26.20 Various shots at 0.1 Jcm-2 3000 59.9 ---- 21.20 ---- 9000 87.9 ---- 31.20 ---- 18000 88.6 58 31.40 20.56
From above results, we conclude that 0.1 Jcm-2 of fluence and 9000 shots should be the optimal ELA condition for achieving polycrystalline anatase phase with the high weight
percentage. On the other hand, when fluence is higher than 0.133 Jcm-2 or shots is over 9000, ELA of TNAs results in multi-phase structure containing both of polycrystalline anatase and
rutile. Moreover, weight percentage of anatase and rutile get higher with increasing fluence or
shots.
4.4 The Transformation of Impurities TiO, Ti2O3 in TNAs to TiO2 induced by ELA
4.4. 1 XRD Results
Figure 4-8 shows the XRD spectra of TNAs/Ti samples annealed by laser with two
laser fluences of 0.042 and 0.1 Jcm-2 at 9000 shots. TNAs irradiated by laser with fluence of 0.042 Jcm-2, week anatase (A) A(101) peak is forming. Therefore, the amorphous structure
37
started transforming to polycrystalline anatase after laser irradiation at 0.042 Jcm-2 of fluence. When fluence increase to 0.1 Jcm-2, the intensities of anatase (A) A(101) and A(200) peaks rise sharply but no rutile (R) peak is visible. It indicates that the amorphous structure was
strongly transformed to polycrystalline anatase under laser irradiation at 0.1 Jcm-2 of fluence.
4.4.2 XANES Results
During XANES measurement, the incident X-ray beam was irradiated directly to the
surface of samples. Moreover, X-ray beam was only absorbed by the surface layer sample.
Therefore, the XANES results describe the characteristics of the surface layer of sample.
When the TNAs were irradiated by laser in parallel mode, the surface layer of sample was
annealed by laser first and following by internal parts of sample. Hence, the XANES results
will only explain the properties of the surface layer of sample annealed by laser.
20 25 30 35 40 45 50
Inte
nsi
ty
(a
.u)
2 Theta (deg.)
Ti Ti Ti A(20 0) A(10 1) F=0.042Jcm-2 F=0.1Jcm-238
Ti L2,3 edge XANES spectra of TiO2 nanotube arrays prepared by anodic oxidation in NH4F solution, subsequently annealed by excimer laser at different fluences of 0.042 Jcm-2 and 0.1 Jcm-2 at 9000 shots are shown in Figure 4-9. As seen in Figure 4-9, there are four dominant features, which can be attributed to excitations of Ti 2p3/2 (L3 edge) and Ti 2p1/2 (L2 edge) core levels into empty Ti 3d states. For TiO2 nano-tube arrays as-grown in NH4F solution at room temperature, the L2,3-edge shows broad features with low intensities in t2g and structureless eg, which are indicative of amorphous TiO2 [83]. When as- grown TiO2 was annealed by laser, the spectra instead show definite crystalline structures as indicated by the
sharpness and higher t2g orbitals and double features of eg orbitals in L3 edge. Moreover, the leading edge of TNAs annealed by laser also has shifted to higher energy (0.6 eV). It indicates
that Ti has changes from lower charge state Ti0, Ti+2, Ti+3 to Ti4+ (TiO2) [84, 85]. This suggested that TNAs prepared at room temperature contain not only amorphous TiO2 but also some impurities such as TiO, Ti2O3 and after annealing by laser, the impurities TiO, Ti2O3 were transferred to TiO2, thus causing the Ti L-edge shift to higher energy.
39 455 460 465 470 475 480
L
2L
3 b2 b1 e g eg t2g t2g Ti L2,3 edgeIn
te
n
s
ity
(a
.u
.)
Photon Energy (ev)
F = 0.1 Jcm-2
F = 0.042 Jcm-2
As-grown Ti2O3
TiO
Figure194-9 Ti L2,3 edge XANES spectra of TiO2 nanotube arrays prepared by anodic oxidation in NH4F solution: as-grown, and annealed by laser at different fluences of 0.042 Jcm-2 and 0.1 Jcm-2 at 9000 shots
Table 4-2 summarizes the intensity ratios of orbitals for Ti L3 edge of TNAs prepares by anodic oxidation as grown in NH4F solution, subsequently annealed by laser at different fluences of 0.042 Jcm-2 and 0.1 Jcm-2 at 9000 shots
40
Table 34-2 Intensity ratios of the orbitals for Ti L3 edge of TNAs prepares by anodic oxidation as grown in NH4F solution, followed by laser annealing with fluences of 0.042 Jcm-2, and 0.1 Jcm-2 at 9000 shots
Samples I(t2g)/ I(eg) I(b1)/ I(b2)
As-grown 0.90 ----
ELA (F=0.042 J.cm-2, 9000 shots) 1.02 1.05
ELA (F=0.100 J.cm-2, 9000 shots) 1.04 1.04
TiO2 (anatase) 0.93 1.21
TiO2 (rutile) 1.20 0.89
As seen in Figure 4-9 and Table 4-2, for all TiO2 polymorphs, the intensity ratio of I(L3 -t2g)/ I(L3-eg) increases from 0.9 for as-grown sample, to 1.02 and 1.04 as samples annealed by laser at 0.042 and 0.1 J.cm-2 of fluence, respectively. Because the intensity of the L-edge features varies with the density of empty d-states, an increase of I(L3-t2g)/ I(L3-eg) intensity ratio implies an empty state in t2g orbitals, which is consistent with an increase in Ti4+ cations. The eg related peak of the L3 edge is split into two peaks at 461 eV as the fluence of 0.042 J.cm-2 and above. This shows that the major difference between Ti L2,3 spectra of amorphous and crystalline phases of TiO2 is significant change in positions, intensities and widths of eg -related peak b1 and b2. For example, with anatase peak b1 is substantially stronger than that of peak b2; while with rutile, the intensity of peak b2 is substantially stronger than that of peak b1. In addition, when the fluences is increased from 0.042 to 0.1 J.cm-2, the I(b1)/ I(b2) intensity ratio is increased 1.04 and 1.05. It means that TNAs annealed by laser with increasing fluence,
41
Oxygen 1s (K-edge) absorption edges, which consist of the excitation of an oxygen 1s
electron into unoccupied 2p-states, are employed to map out the oxygen 2p-projectd density
of unoccupied states in order to examine the oxidation states and crystalline phases of TNAs.
The O K-edgeXANES spectra of TiO2 nanotube arrays prepared by anodic oxidation in NH4F solution: As-grown, and annealed by excimer laser at different fluences of 0.042 Jcm-2 and 0.1 Jcm-2 at 9000 shots as shown in Figure 4-10.
In general, there are two dominant features in lower energy, 530-536 eV in the O K-edge
spectra, which can be assigned to the transitions into Ti 3d t2g and eg levels. Broad peaks are observed for as-grown TNAs due to slight variation in bond lengths and angles, in hearent to
spectra of amorphous TiO2 solid [82]. However, after annealing by laser at different fluences of 0.042 Jcm-2 and 0.1 Jcm-2, the Ti 3d t2g and eg features become more distinct and narrow shapes of Ti and new peak at higher energy (539.3 eV), which can be attributed to transitions
into 4sp orbitals, indicative of anatase phase TiO2 [85]. In addition, it is interesting to note that the energy separation of both t2g and eg orbitals provides a direct measure of ligand-field splitting (LFS) of TiO2. The LFS can be obtained from the corresponding oxygen k-edge spectra, revealing a decrease in sequence of TiO2 (2.6-2.7 eV), Ti2O3 (2.2 eV), and TiO (1.5 eV) [87, 88]. The spectrum of as-grown sample reveals a ligand-field splitting of 2.2 eV.
Upon annealing by laser at fluences of 0.042 Jcm-2 and 0.1 Jcm-2, LFS increases to 2.6 eV. It indicates that the lower LFS for as-grown sample is due to remaining charge transfer to Ti4+. On the other words, as-grown sample still contain some impurities and annealing by laser
42
528
531
534
537
540
543
546
549
552
2.2 2.6 2.6e
gt
2gO K edge
Inte
ns
ity
(a
.u.
)
Photon Energy (ev)
F=0.1 Jcm-2 F=0.042 Jcm-2 As-grown Ti 2O3 TiO
Figure204-10 O K-edgeXANES spectra of TiO2 nanotube arrays prepared by anodic oxidation in NH4F solution: as-grown and annealed by by laser at different fluences of 0.042 Jcm-2 and 0.1 Jcm-2 at 9000 shots
Figure 4-11 shows the fitting results for O K-edge XANES spectrum of as-grown
TNAs by anodic oxidation in NH4F solution. As seen in the Figure 4-11, the spectra shows
that as-grown TNAs at room temperature processes 82 % TiO2 amorphous phase, 11 % Ti2O3, and 7 % TiO. The low percentage of amorphous TNAs prepared in NH4F solution can be attributed to low oxygen ion formation from only 3 wt% H2O addition. After that, the TNAs annealed by laser at fluences of 0.042 J.cm-2 and 0.1 J.cm-2 or post- annealed at 400oC.

![Figure 10 3-8 Energy level diagrams showing the states involved in Raman signal [78]](https://thumb-ap.123doks.com/thumbv2/9libinfo/8584364.189488/37.893.134.802.117.692/figure-energy-diagrams-showing-states-involved-raman-signal.webp)