Phase Separation and Melting Behavior in Poly(
-caprolactone)-Epoxy Blends Cured by 3,3
ⴕ-dimethylmethylene-di(cyclohexylamine)
Jyh-Luen Chen, Feng-Chih Chang
Institute of Applied Chemistry, National Chiao Tung University, Hsinchu, Taiwan, Republic of China
Received 5 October 2002; accepted 18 December 2002
ABSTRACT: The morphology and the melting behavior of poly(-caprolactone)/epoxy blends (PCL/epoxy) have been investigated by SEM and DSC. The mechanism of phase separation varies with the curing temperature and PCL con-tent, which can be deduced from the cured morphology of the blend. Higher temperature leads to lower blend viscosity and a higher curing rate, and the final morphology is deter-mined by the competition of these two factors. The PCL melting behavior of the blend is influenced by the extent of
phase separation and crystallization during curing. The dual melting behavior of the PCL blend can be ascribed to the interference of the epoxy, which results in the formation of less perfect PCL crystallites melted at lower temperature. © 2003 Wiley Periodicals, Inc. J Appl Polym Sci 89: 3107–3114, 2003
Key words:epoxy; poly(-caprolactone); blends; phase
sep-aration; phase diagram
INTRODUCTION
In heterogeneous thermoplastic/epoxy blends, misci-bility varies with curing temperature and the epoxy molecular weight during the curing reaction, which results in phase separation. The phase transformation involves (i) onset of phase separation, (ii) gelation, (iii) fixation of the dimension of the phase-separated struc-ture, (iv) end of phase separation, and (v) vitrifica-tion.1 During the process of phase transformation,
morphologies of the blend in progress are determined by the competition between the rate of the curing and rate of phase separation.2,3 Phase separation is
com-pletely inhibited when the blend is vitrified, and may result in none or incomplete phase separation if the curing rate is the dominant factor on the finally cured morphology. In our previous study on phenoxy/ep-oxy blends,3 the curing rate was controlled by the amount of catalyst employed, and a series of homo-geneous and heterohomo-geneous end products were achieved with various transparencies.
The phase separation process in thermoplastic/ep-oxy blends has been studied extensively,4 –7 and spi-nodal decomposition (SD), nucleation and growth (NG), or the mixed mode of both can occur. The mech-anism of phase separation is determined by the blend composition and curing condition.5–7 When the
ther-moplastic content of the blend is lower than the critical point, phase separation will be initiated by the
ther-moplastic component segregating from the blend, and will result in the thermoplastic-rich phase dispersed in the epoxy-rich matrix. In contrast, when the thermo-plastic content is higher than the critical level, the epoxy-rich phase will segregate from the blend, and the final cured morphology will depend on the blend composition. Temperature-dependent phase behavior has also been investigated by the morphologies of the blends at the same epoxy conversion, but different curing temperatures.5 When the blend is
homoge-neous at higher temperature and heterogehomoge-neous at lower temperature, the upper critical solution temper-ature (UCST) behavior can be concluded. The phase separation initiation at different temperatures can also be utilized to determine the phase behavior.6,7 Both
UCST and lower critical solution temperature (LCST) behaviors can be interpreted by the equation-of-state theory,8,9 in which the interaction parameter is
di-vided into three parts: (i) segmental interaction; (ii) free-volume effect, contributing to LCST behavior; (iii) size effect, contributing to UCST behavior.
Poly(-caprolactone) (PCL) can be combined with a number of other polymers, and the resulting binary blends are either miscible or mechanically compati-ble.10 –12PCL is miscible with several amine-cured
ep-oxy resins,13–15however, a two-phase morphology has
been observed in PCL/anhydride-cured epoxy
blends.14 The observed miscibility difference can be interpreted as the presence of hydroxyl groups in the amine-cured epoxy, which are capable of forming hy-drogen bonds with the PCL ester groups. For homo-geneous amine-cured epoxy, the addition of PCL de-creases the elongation and fracture energy, while the opposite results are reported in heterogeneous PCL/ Correspondence to: F.-C. Chang ([email protected]).
Journal of Applied Polymer Science, Vol. 89, 3107–3114 (2003) © 2003 Wiley Periodicals, Inc.
anhydride-cured epoxy blends.14 In this study, the morphologies of PCL/epoxy blends cured by an ali-phatic amine at different temperatures are character-ized by SEM. The mechanism of phase separation is deduced from the finally cured morphology. Addi-tionally, the melting behavior of the PCL in the blends with various compositions and morphologies is also be investigated.
MATERIALS AND METHOD Materials
The epoxy monomer DER 332, a low molecular weight liquid diglycidyl ether of bisphenol-A (DGEBA) with an epoxide equivalent weight of 172–176, was pur-chased from Dow Chemical Company (USA). The PCL used in this study is the TONE威 Polymer P-787 with Mn⫽ 80000 g/mol, purchased from Union
Car-bide Corporation (USA). The aliphatic amine used as a hardener is 3,3⬘-dimethylmethylene-di(cyclohexyl-amine) (3DCM), which was obtained from BASF (Ger-many). Chemical structures of DGEBA, PCL, and 3DCM are illustrated in Scheme 1, where “R” repre-sents an aliphatic segment in PCL structure.
Blending procedures and characterizations
The homogeneous mixture of PCL/DGEBA ⫽ 30/70
(wt%)was prepared by adding PCL pellets to the stirring epoxy resin at 150°C under nitrogen gas for 1 h. After cooling to 80°C, a calculated amount of additional epoxy resin and hardener were added to bring the mixture to a desired composition. The mixture was then cast imme-diately into steel molds and controlled at 20, 60, and 80°C, respectively. After the specimens were vitrified, a Hitachi model S-570 scanning electronic microscopy (SEM) (Japan) was employed to examine morphologies of the fractured surfaces of these cured specimens. The specimens were then cooled at⫺25°C for three days to
promote the crystallization of PCL. The PCL melting behavior in these cooled blends were investigated by a DSC 910S differential scanning calorimeter (DSC) from TA Instruments (USA) by a heating rate of 5°C/min from 20 to 100°C.
RESULTS AND DISCUSSION Morphologies
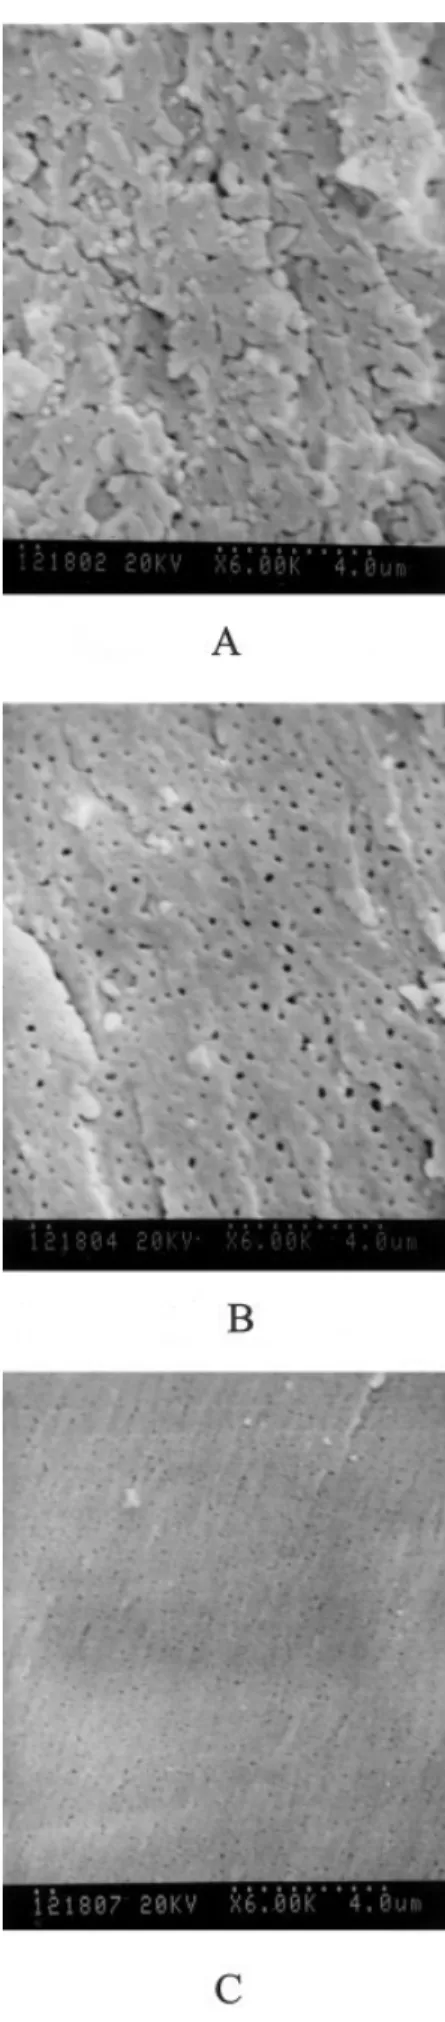
Figure 1 displays final morphologies of the blend
PCL/DGEBA/3DCM ⫽ 9/68/23 (PCL9) cured
ini-tially at 20, 60, and 80°C, respectively. The PCL9 blend cured at 20°C [Fig. 1(a)] displays the etched phase as longish domains, while the epoxy-rich phase contains numerous spherical holes. This morphology implies that the PCL phase separation follows the NG mech-anism initially and then gradually shifts to the SD mechanism during later stages of curing. However, the SD separation mechanism is still considered in-complete based on the observed longish morphology. The SEM micrograph of the PCL9 blend cured at 60°C [Fig. 1(b)] clearly shows the evenly dispersed PCL-rich particles from the NG mechanism. Figure 1(c) illus-trates the morphology of the PCL9 blend cured at 80°C, in which the particle size is significantly smaller than the blend at 60°C [Fig. 1(b)]. Therefore, we can conclude that the NG mechanism cured at 80°C can proceed to a earlier stage than that at 60°C. Figure 2(a) displays the morphology of the PCL15 blend cured at 20°C, in which the phase boundary is blurry. The longish phase is also observed in the PCL15 blend cured at 60°C [Fig 2(b)], but the phase boundary is relatively clearer than that at 20°C. This means that both systems proceed under the SD mechanism, but the phase separation is more complete at 60°C than at 20°C. The obscure morphology is observed in the PCL15 blend cured at 80°C [Fig. 2(c)], in which the phase separation mechanism cannot be identified clearly. Various stages of phase separations via SD
Scheme 1
Figure 1 SEM micrographs taken on the fractured surfaces of the PCL9 blends cured at (a) 20°C, (b) 60°C, and (c) 80°C.
Figure 2 SEM micrographs taken on the fractured surfaces of the PCL15 blends cured at (a) 20°C, (b) 60°C, and (c) 80°C.
mechanism can be illustrated in Figure 3. The mor-phological difference between PCL9 and PCL15 blends can also be illustrated by the proposed phase diagram, shown in Figure 4.
The SD mechanism of phase separation
Figure 3 illustrates various stages of the phase sepa-ration taking place via SD mechanism from curves A to D. The small PCL concentration gradient wave exists even in the homogeneous solution before phase separation (Fig. 3, curve A). The amplitude of this concentration wave grows continuously with curing time until its miscibility limit (dashed line in Fig. 3), and phase separation begins (Fig. 3, curves B to D). When the PCL concentration in the PCL-rich phase is still below its critical concentration (or its miscibility limit), the PCL-rich region can not be etched out cleanly in the cured specimens because the system is still macroscopically homogeneous. The PCL15 blend cured at 20°C [Fig. 2(a)] shows that phase contrast is blurry, an indication of SD separation at a very early stage. The PCL9 blend cured at 20°C [Fig. 1(a)] and the PCL15 blend cured at 60°C [Fig. 2(b)] display better separation of the longish PCL-rich phase, which im-plies that the SD phase separation proceeds only to the later stage (Figure 3, curve C). Both PCL9 and PCL15 blends resulted in homogeneous final product cured
at 100°C.13The mechanism of phase separation of the blends described above is listed in Table I.
Different extents of SD separations [Figs. 1(a), 2(a), and 2(b)] can be attributed to the viscosity of the blends. Higher viscosity by the higher PCL content blend (PCL15 blend) and lower temperature (20°C) results in the SD mechanism proceeding to earlier stage.
Phase diagram
The morphological difference of the PCL9 and PCL15 blends cured at 20 to 100°C can be explained by the proposed phase diagram (Fig. 4) in terms of the epoxy conversion and the PCL weight content. The solid, dashed, and bold dashed curves in Figure 4 represent the binodal, spinodal, and separation curves, respec-tively. The UCST behavior is proposed such that both binodal and spinodal curves shift upward with the increase of temperature6(Fig. 4, sections A–D). Mean-while, the separation curve also shifts up to higher conversion from lower (20°C) to higher (100°C) tem-perature, but the relative conversion of separation curve to the binodal/spinodal curves varies with tem-perature (Fig. 4, sections A–D). Both the PCL9 and PCL15 blends proceed phase separation at all temper-atures by either the NG or SD mechanism of the PCL content as described above, thus the critical point of
Figure 3 Phase separation process via the SD mechanism. Curve A: concentration wave before phase separation; curve B: early stage of SD; curve C: mid-stage of SD; curve D: late stage of SD.
phase diagram should be located at a PCL content higher than PCL155(Fig. 4). The PCL9 blend at 20°C
follows the NG mechanism initially and the SD mech-anism in the later stage of phase separation [Fig. 1(a)]. The PCL15 blend at 20°C obeys the SD mechanism, which is halted in the early stage [Fig. 2(a)]. Figure 4, section A can be employed to interpreted the mecha-nisms of the PCL9 and PCL15 blends at 20°C. The critical point is far to the PCL9 than the PCL15 blend (Fig. 4, section A), which implies that the conversion interval between the binodal and spinodal curves at the PCL9 blend is longer than that at the PCL15 blend. When the conversion of the PCL9 blend at 20°C grows up to higher than the binodal curve (Fig. 4, section A), the phase separation takes place via the NG mecha-nism by a slow rate because of high viscosity at low temperature. After the conversion is higher than the spinodal curve (Fig. 4, section A), the SD mechanism is also obeyed and both the etched holes and longish shape domains are observed in the fractured surface
[Fig. 1(a)]. On the other hand, the shorter conversion interval and higher viscosity of the PCL15 blend re-tard the phase separation to the SD region (Fig. 4, section A), thus the early stage of SD is observed in Figure 2(a).
The blend viscosity at 60°C is lower than that at 20°C, which implies that phase separation at 60°C should be carried out at the conversion higher than and close to the binodal/spinodal curves (Fig. 4, section B). The NG and SD mechanisms of the PCL9 and PCL15 blends [Figs. 1(b) and 2(b)], indicate that the separation curve should intersect with the spi-nodal curve between the PCL9 and PCL15 content (Fig. 4, section B). The separation conversion of the PCL9 blend at 60°C locates at between the binodal and spinodal curves (Fig. 4, section B), thus the NG mechanism is observed in Figure 1(b). On the other hand, the separation conversion of the PCL15 blend at 60°C still locates at above the spinodal curve (Fig.
Figure 4 Phase diagram at section (A): 20°C, section (B): 60°C, section (C): 80°C, and section (D): 100°C. (——) binodal curve, (- - - - -) spinodal curve, (– – – –) separation curve.
TABLE I
Mechanism and Stages of Phase Separation in the PCL9 and PCL15 Blends Cured at 20, 60, 80, and 100°C
Blend composition
Curing temperature (°C)
20 60 80 100
PCL9 NG/SD (mid) NG (late) NG (early) none
PCL15 SD (early) SD (mid) none none
4, section B), and results in the SD mechanism in Figure 2(b).
Higher temperature (80°C) lowers the relative con-version of the phase separation to those of the binodal and spinodal curves. Figures 1(c) and 2(c) display the NG mechanism of the PCL9 blend at 80°C and the obscure morphology of the PCL15 blend, implying that the separation curve intersects with the binodal curve between the PCL9 and PCL15 blends (Fig. 4, section C). The epoxy molecular weight increases slowly at lower conversion and quickly at higher con-version close to the gel concon-version (p⫽ 0.577 theoret-ically5); thus the higher increasing rate of the epoxy viscosity is shown. The binodal/spinodal curves at 80°C locate at a higher conversion (Fig. 4, section C), which indicates the higher blend viscosity at the be-ginning of phase separation. The conversion interval at 80°C between the beginning and end of phase sep-aration should be shorter than that at 60°C,7thus the PCL dispersed phase of the PCL9 blend at 80°C cannot grow to a larger particle size than that at 60°C [Fig. 1(b) and (c)]. On the other hand, the higher viscosity and curing rate of the PCL15 blend at 80°C at the conversion near to the binodal curve inhibits the phase separation process; thus, the obscure morphology is observed in Figure 2(c). A similar explanation for the PCL15 blend at 80°C can be applied to the
morphol-ogies at 100°C.13 High conversions of the binodal/ spindal curves at 100°C imply high blend viscosities of the PCL9 and PCL15 blends close to the binodal curves. The high curing rates promoted at higher tem-perature (100°C) is responsible for the observed ho-mogeneous morphologies of both PCL9 and PCL15 blends (Fig. 4, section D).
Melting behavior of PCL in the blends
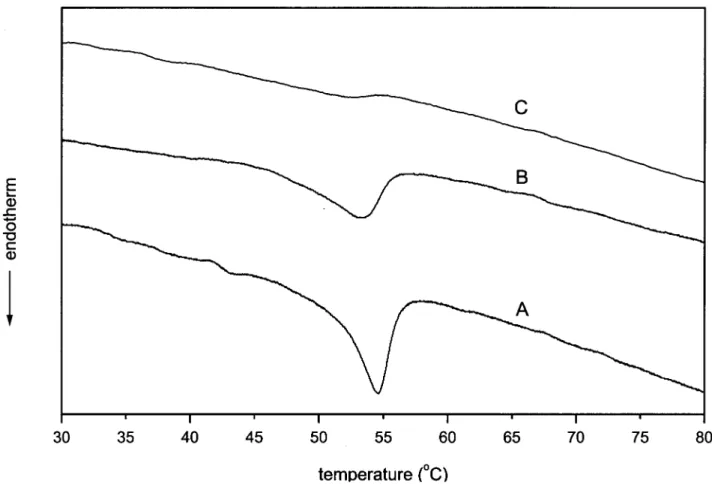
Figure 5 displays the DSC thermograms of the PCL9 blend cured at three different temperatures where the melting endotherm of PCL decreases with the increasing curing temperature. Phase separation in the PCL9 blend at lower temperature can proceed for a longer time and will result in higher extent of phase separation. Higher PCL concentration in the dispersed phase at lower temperature can better promote more of the PCL crystallization, thus the PCL melting endotherm decreases with the increase of the curing temperature.
Dual PCL endotherms are observed in the PCL15 blend cured at relatively lower temperatures (Fig. 6, curves A and B). The presence of a second compatible polymer (the epoxy) may disrupt the packing of the crystalline component (PCL) and result in less perfect and lower melting crystallites16 –18(Tm1⫽ 51°C). When Figure 5 Melting endotherms of the PCL9 blends cured at curve A: 20°C, curve B: 60°C, and curve C: 80°C.
the PCL15 blend was cured at 20°C, the obscure phase boundary is observed in the SEM micrograph [Fig. 2(a)], implying that the PCL crystallization is dis-rupted more seriously. Therefore, the second melting peak (Tm2 ⫽ 55.7°C) from the sample cured at 20°C
(Fig. 6, curve A) is smaller than that cured at 60°C (Fig. 6, curve B). The PCL endotherm is not observed in the PCL15 blend cured at 80°C (Fig. 6, curve C) because of PCL polymers locked in the epoxy netwoks, which is consistent with the obscure morphology observed in the SEM micrograph [Fig. 2(c)].
CONCLUSION
The cured morphology of the PCL/epoxy blend is influenced dramatically by the curing temperature. Lower temperature leads to higher viscosity and lower curing rate, thus the mixing mode of phase separation can be observed in lower PCL content, and the earlier stage of phase separation is achieved in higher PCL content. Higher temperature can reduce the blend viscosity and result in easier diffusion of all components, and the phase separation should be able to proceed to later stages. However, the curing rate can also be promoted by higher cure temperature, and a homogeneous morphology is achieved when the
curing rate becomes the dominant factor and halts the phase separation effectively.
The melting behavior of PCL in the blend is in-fluenced by the extent of phase separation and the disruption by the epoxy. Higher PCL concentration in dispersed phase resulting from better phase sep-aration can more effectively promote the PCL crys-tallization. Dual-melting endotherms of PCL can be attributed to crystallization interfered by the epoxy surrounding the PCL polymers and will result in a portion of less perfect PCL crystallites which will melt at lower temperature in the dual-melting peaks.
This research is financially supported by the National Sci-ence Council, Taiwan, R.O.C., under contact no. NSC 91-2216-E-009-017. The authors wish to thank the Epolab Chemical Co. (Taiwan) for their donation of material.
References
1. Kim, B. S.; Chiba, T.; Inoue, T. Polymer 1993, 34, 2809. 2. Verchere, D.; Sautereau, H.; Pascault, J.-P.; Moschiar, S. M.;
Riccardi, C. C.; Williams, R. J. J. In Toughened Plastics I; Riew, C. K.; Gillham, J. K., Eds.; Adv Chem Ser 233; American Chem-ical Society: Washington, DC, 1993, p 335.
3. Teng, K. C.; Chang, F. C. Polymer 1993, 34, 4291.
Figure 6 The melting endotherms of the PCL15 blends cured at curve A: 20°C, curve B: 60°C, and curve C: 80°C.
4. Kim, B. S.; Chiba, T.; Inoue, T. Polymer 1989, 60, 1839. 5. Chen, J. L.; Chang, F. C. Macromolecules 1999, 32, 5348. 6. Williams, R. J. J.; Rozenberg, B. A.; Pascault, J.-P. Adv Polym Sci
1997, 128, 95.
7. Chen, J. L.; Chang, F. C. Polymer 2001, 42, 2193.
8. Kammer, H. W.; Inoue, T.; Ougizawa, T. Polymer 1989, 30, 888.
9. Kammer, H. W.; Kressler, J.; Kummerloewe, C. Adv. Polym. Sci. 1993, 106, 31.
10. Olabisi, O.; Robeson, L. M.; Shaw, M. T. Polymer–Polymer Miscibility; Academic Press: New York, 1979.
11. Brode, G. I.; Koleske, J. V. J. Macromol Sci 1972, 6, 1109. 12. Koleske, J. V. In Polymer Blends; Paul, D. R.; Newman, S., Eds.;
Academic Press: New York, 1978; Vol. 2, Chap. 22.
13. Chen, J. L.; Huang, H. M.; Li, M. S.; Chang, F. C. J Appl Polym Sci 1999, 71, 75.
14. Clark, J. N.; Daly, J. H.; Garton, A. J Appl Polym Sci 1984, 29, 3381.
15. Garton, A. Polym Eng Sci 1983, 23, 663.
16. Runt, J. P.; Rim, P. B. Macromolecules 1982, 15, 1018. 17. Rim, P. B.; Runt, J. P. Macromolecules 1983, 16, 762. 18. Rim, P. B.; Runt, J. P. Macromolecules 1984, 17, 1520.