Chronic Exposure to Particulate Matter and Risk of Cardiovascular Mortality: Cohort Study from Taiwan
Eva Tseng1, MD, MPH; Wen-Chao Ho2, PhD; Chang-Fu Wu3, PhD; Wen-Harn Pan4, PhD; Tsun-Jen Cheng3, MD, PhD; Pau-Chung Chen3, MD, PhD; Hsien-Ho Lin5, MD, MPH, ScD
Affiliations
1. Division of General Internal Medicine, Johns Hopkins University, Baltimore, Maryland, United States
2. Department of Public Health, China Medical University, Taichung, Taiwan
3. Institute of Occupational Medicine and Industrial Hygiene, National Taiwan University, Taipei, Taiwan
4. Institute of Biomedical Sciences, Academia Sinica, Taipei, Taiwan
5. Institute of Epidemiology and Preventive Medicine, National Taiwan University, Taipei, Taiwan
Correspondence to:
Hsien-Ho Lin, MD, MPH, ScD
Institute of Epidemiology and Preventive Medicine, National Taiwan University, 17 Xu-Zhou Road, Rm706, Taipei, 100, Taiwan
Associate Professor Tel: +886-2-33668023 Fax: +886-2-33668023 E-mail: hsienho@ntu.edu.tw
Abstract Background:
It is unclear if long-term exposure to air pollution is associated with increased cardiovascular and cerebrovascular mortality in Asian countries. The evidence has been limited to several cohort studies conducted in China and Japan with conflicting results.
Methods: We conducted a cohort study on the association between fine particulate matter (PM2.5) and cardiovascular mortality using 43,227 individuals in a civil servants health service in Taiwan. Each participant was assigned an exposure level of particulate matter based on their district of residence using air pollution data collected by the Taiwan Environmental Protection Agency and with modeling using geographic information systems. The participants were followed up from 1989 to 2008 and the vital status was ascertained from death records. Cox regression models were used to adjust for confounding factors.
Results: After a median follow-up of 18 years, 1992 deaths from all causes including 230 cardiovascular deaths occurred. After adjustment for potential confounders, PM2.5 levels were not significantly associated with mortality from cardiovascular disease [Hazard Ratio (HR) 0.80; 95%Confidence Interval (CI): 0.43, 1.50 per 10μg/m3 increase in PM2.5] or all causes (HR 0.93; 95%CI: 0.73, 1.18 per 10μg/m3 increase in PM2.5). The results were similar when the analysis was restricted to the urban areas and when the PM2.5 measurement was changed from the period average (2000-2008) to annual average.
Conclusions: In this population-based cohort study in Taiwan, long-term exposure to PM2.5 was not associated with increased all-cause or cardiovascular mortality.
Introduction
Substantial research has been performed examining the adverse health effects of air pollution, specifically fine particulate matter with a diameter of 2.5 μm or less (PM2.5), which is primarily produced from the combustion of fossil fuels. The size of these fine particles allows them to be deposited deep down in the alveoli of the lung, resulting in prothrombotic states, endothelial dysfunction, progression of atherosclerosis, and increased systemic oxidative stress (1, 2). Previous studies showed that extended exposure to fine particulate matter is an important predictor of mortality for cardiopulmonary disease (3, 4). Moreover, PM has been established as a trigger of cardiovascular events occurring within hours to days after exposure (5). A recent updated review by the American Heart Association writing group concluded that PM2.5 exposure is a “modifiable factor contributing to cardiovascular morbidity and mortality” (6). Studies conducted outside the United States such as the Air Pollution and Health: A European Approach also found that PM air pollution was significantly associated with an increase in all-cause, cardiovascular and respiratory mortality (7).
Studies on short-term PM exposure in Asian countries, including Taiwan, Japan, South Korea, Thailand and China, have found similar results (6). However, most of the studies have used a case-crossover approach or time-series analysis. Few cohort studies in Asia have studied the effects of long-term exposure to PM with conflicting results, such as from China and Japan (8-10). Compared to Western countries, Asian countries have higher air pollution levels with different emission sources. Higher population density and increasing urbanization in Asian countries mean that city residents have a greater exposure to air pollution than their counterparts in Western countries. Additionally, East Asian countries tend to have a lower coronary heart disease mortality but higher stroke mortality compared to Western countries (11). Given the
limited evidence on the long-term effects of air pollution on cardiovascular/cerebrovascular mortality in Asia, we used the Civil Servants Cohort Study, a retrospective cohort study in Taiwan to examine this issue further.
METHODS
Study population
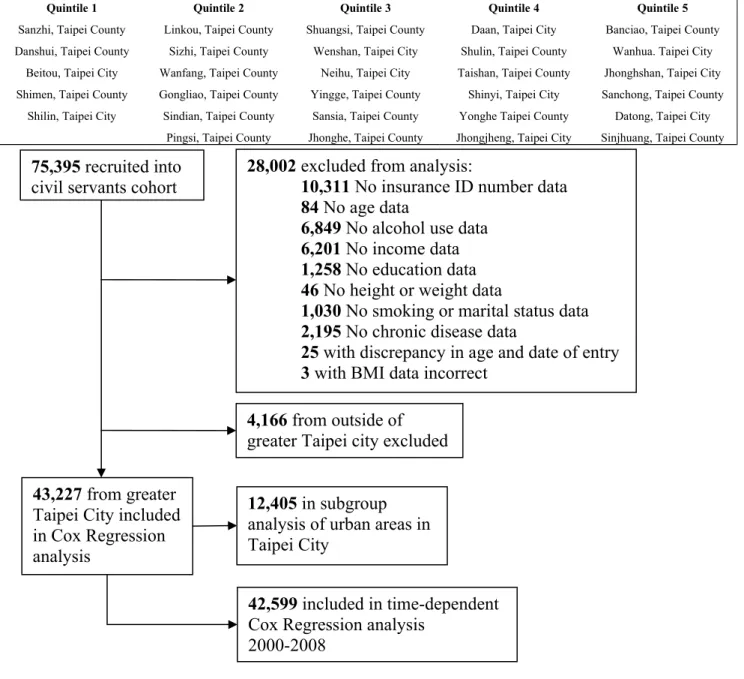
The study population was derived from a cohort of 75,395 individuals who were civil service employees and teachers. These individuals underwent an annual physical examination at the Taipei Outpatient Service Center as part of the government employee insurance program from 1989 to 1992 (12, 13). Of the 75,395 individuals enrolled in the civil servants cohort, we excluded from analysis 28,002 people with missing data on insurance identification number (10,311), age (109), alcohol use (6,849), income (6,201), education level (1,258), height or weight (46), body mass index (3), marital or smoking status (1,030), and chronic diseases (2,195). Additionally, we excluded 4,166 individuals who resided outside of greater Taipei city, which is defined as the area including New Taipei City and Taipei City. Within greater Taipei City, 29 districts were represented out of a total of 41 districts. After these exclusions, 43,227 subjects (24,630 males and 18,597 females) were included in the final study (Figure 1). The study cohort was followed from 1992 up until December 31st of 2008.
Exposure assessment of ambient air pollution
We obtained data on air pollution levels of PM2.5 from the Taiwan Environmental Protection Agency’s Taiwan Air Quality Monitoring Network, which was established in 1990 and began collecting data in September 1993. The Air Quality Monitoring Network collects air pollution data from 76 stations in seven established districts. Mean pollution levels of PM2.5 were
calculated over the period 2000-2008 and used as the primary exposure variable in the Cox regression analysis. Although PM2.5 measurements began in 1995, nationwide survey of PM2.5 was not implemented until August 2005 (14). Therefore, the PM2.5 data for greater Taipei City prior to August 2005 was estimated using backward prediction based on historical trends. Specifically, we used data about other pollutants (PM with a diameter of 10 μm or less, sulfur dioxide, nitric oxide, ozone and carbon monoxide) and temperature levels to estimate station-specific levels of PM2.5. We then used geographic information systems to estimate the PM2.5 level at the district and township level using the station-specific data and estimates for the period 2000-2008. Each participant was assigned an average PM2.5 level of exposure based on their district of residence which was determined by their phone number listed on the baseline questionnaire survey. For the time-dependent Cox regression analysis, we used the annual average PM2.5 levels from 2000-2008 as the time-varying exposure.
Measurement of covariates
Information on known cardiovascular risk factors was obtained through self-administered questionnaires at baseline, including socioeconomic and demographic data such as marital status, income, education level, alcohol consumption, smoking, and selected baseline illnesses
(hypertension, diabetes). Total cholesterol and triglyceride levels were determined by fasting venous blood sampling. The abbreviated Modification of Diet in Renal Disease Study formula was used to assess glomerular filtration rate (GFR): estimated GFR (mL/min/1.73m2) = 186 × (SCr)−1.154 ×(age)−0.203 ×(0.742 if female), where SCr is serum creatinine level in mg/dL and age is in years.
The primary outcome of the study was cardiovascular and all-cause mortality. Vital status was determined by death records which are collected by the Taiwan Department of Health and have been computerized since 1971. The underlying cause of death was coded according to the International Classification of Disease 9th revision (ICD-9) and 10th revision (ICD-10). We used the following ICD codes to assess deaths from cardiovascular disease: ischemic heart disease (ICD-9 410-414, ICD-9 429.2, ICD-9 429.7, and ICD 10 I20-25) and cerebrovascular disease (ICD-9 430-438 and ICD-10 I60-69). This study was approved by the Institutional Review Board of National Taiwan University.
Statistical analysis
We used Cox proportional hazards model to estimate the hazard ratio and 95%
confidence interval for all-cause and cardiovascular mortality due to ambient air pollution. The primary exposure variable was the average PM2.5 level over the period 2000-2008. The 29 districts in greater Taipei City were ranked based on their average PM2.5 levels and then divided into quintiles with the reference group being the quintile with the lowest average. The ages of the subjects when they entered and exited the cohort were used to define the time variable for the Cox models. We adjusted for confounders by creating indicator variables for never, current or former smokers, habitual alcohol use, married or other, less then high school education, diabetes, hypertension, and body mass index (BMI) (with cutoffs at 20.1 and 27.5 based on data from a study suggesting that the lowest risk of mortality for East Asians is in that range) (15). We did not adjust for a history of cerebrovascular disease or heart disease because they are
intermediaries between air pollution and the outcome of interest.
We conducted stratified analyses by sex, smoking status, diabetes, and BMI in order to test for effect modification of the association between PM2.5 and mortality. We performed
additional analyses using time-dependent cox regression to examine the effect of sub-chronic exposure to PM2.5 over the period of 2000-2008. We were concerned that averaging the PM2.5 levels over time may have decreased the variability of exposure. Therefore, we wanted to examine time-varying exposures of one year in duration. Participants who died prior to 2000 were excluded and the remaining cohort was followed for events between 2000 and 2008. Additionally, we conducted a subgroup analysis of the urban areas within greater Taipei City because we were concerned if there was confounding from area-level factors such as access to medical care, assuming that people living in less urban areas would have limited access to medical care. This subgroup included a total 12,405 individuals from 8 districts that were selected by the authors and deemed as “urban” areas (Figure 1). In addition, we performed a sensitivity analysis to see if adjusting for triglyceride, total cholesterol and GFR measurements in the participants with this data available would change the association. Finally, we also examined the effect of other air pollutants including carbon monoxide (CO), nitric oxide (NO), nitrogen dioxide (NO2), nitrogen oxides (NOX), sulfur dioxide (SO2), and ozone (O3) in several two-pollutant models. Statistical significance levels were determined by 2-sided P value of 0.05. All statistical analyses were carried out with SAS (Version 9.2, SAS Institute, Inc., Cary, NC).
RESULTS
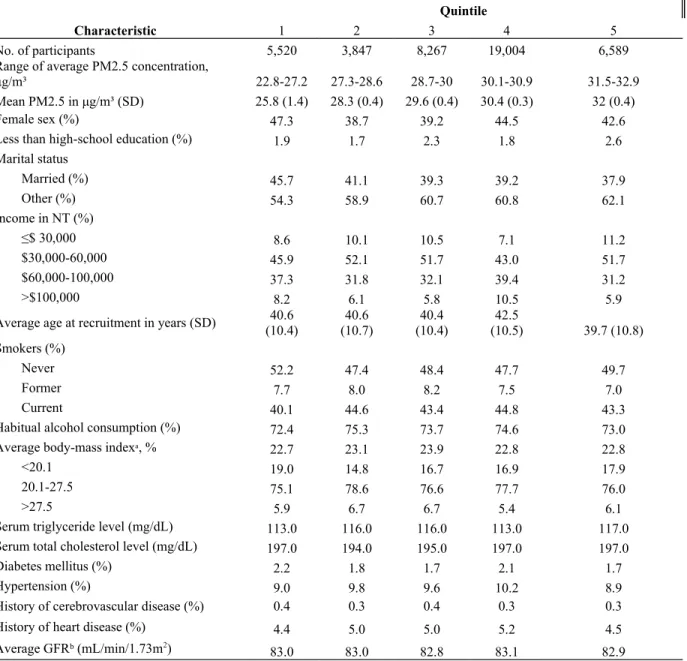
The baseline characteristics of the cohort and air pollution measures are listed in Table 1. The average PM2.5 levels across the five quintiles ranged from 25.8μg/m³ to 32μg/m³. The age and sex distributions were similar among the quintiles with women representing about 40-45% of the cohort. Only around 2% of participants had lower than high-school education. The
Current smoking levels, habitual alcohol consumption, baseline total cholesterol, triglyceride and GFR measurements were also consistent across the quintiles. Baseline comorbid conditions were also similar, with only about 2% of individuals reporting a history of diabetes, 0.3% reporting cerebrovascular disease, 9% reporting hypertension and around 5% reported having heart disease.
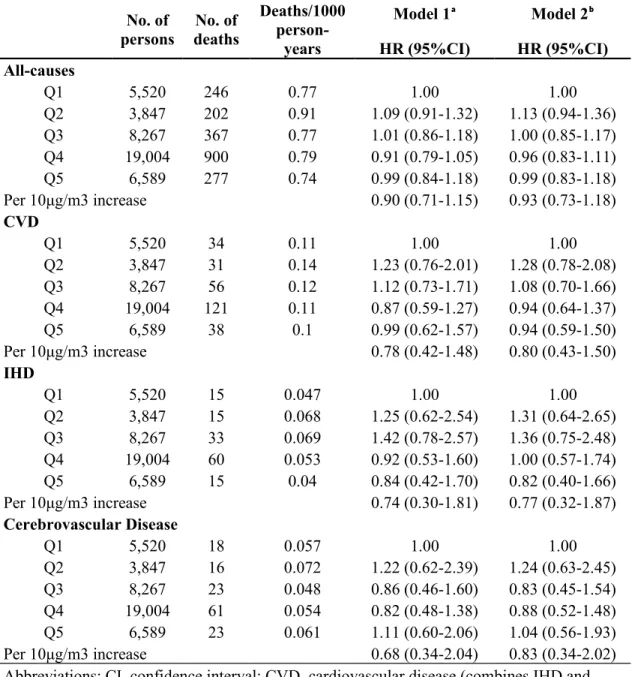
During the median 18-year follow-up, 280 deaths from cardiovascular disease (including 139 from ischemic heart disease and 141 from cerebrovascular disease) occurred. The crude mortality rate (all-cause and cardiovascular) did not reveal a strong dose-dependent pattern across quintiles of PM2.5 (Table 2). After adjusting for sex, age, education, marital status, income, smoking, alcohol consumption, BMI, diabetes, and hypertension, the level of PM2.5 was not significantly associated with all-cause (HR per 10µg/m3 increase in PM2.5: 0.93, 95%CI: 0.73, 1.18) and cardiovascular mortality (HR per 10µg/m3 increase in PM2.5: 0.80, 95%CI: 0.43, 1.50). The mortality rate-ratios did not change considerably in the crude versus multivariable-adjusted model (Model 1 and Model 2 in Table 2), suggesting that there was not much confounding present. Increased cardiovascular mortality was significantly associated with males (HR 2.35, 95%CI: 1.60, 3.46), and hypertension (HR 1.87, 95%CI: 1.45, 2.42) and inversely associated with higher than high school education (HR 0.48, 95%CI: 0.32, 0.71).
In the subgroup analysis of solely the urban areas within greater Taipei City (Figure 1), results were similar to our prior analysis in that both crude and multivariable adjusted
cardiovascular and all-cause mortality were not significantly associated with air pollution (data not shown). Given our concern that using the average PM2.5 level as the exposure variable may not be sensitive enough to show any association, we performed a time-dependent Cox regression analysis to investigate the sub-chronic effect of annual PM2.5 exposure. We found that the annual
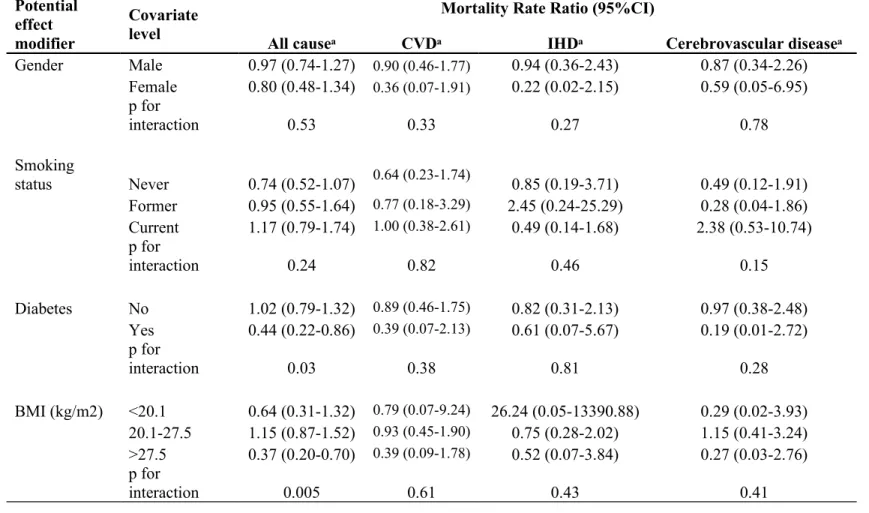
level of PM2.5 was not associated with cardiovascular mortality (HR 0.56, 95%CI: 0.27, 1.16 per 10µg/m3 increase in PM2.5). In the stratified analysis, we found that the association between PM2.5 and all-cause mortality was modified by diabetes (P for interaction: 0.03) and BMI (P for
interaction: 0.005). PM2.5 was inversely associated with all-cause mortality among participants with diabetes (HR per 10µg/m3 increase in PM2.5: 0.44, 95%CI: 0.22, 0.86) and with BMI>27.5 kg/m2 (HR per 10µg/m3 increase in PM2.5: 0.37, 95%CI: 0.20, 0.70) (Table 3).
Finally, we investigated several other air pollutants including CO, NO2, NO, NOX, O3 and SO2 to see if including this additional exposure would affect cardiovascular mortality. When these pollutants were analyzed individually, we did not find significant associations between pollutants and cardiovascular mortality (Appendix Table 1). In the two-pollutant model in which we paired PM2.5 with one of these additional pollutants, the association between PM2.5 and
cardiovascular mortality remained unchanged (Appendix Table 2).
DISCUSSION
Although there have been many epidemiologic studies in Asia demonstrating increased CVD mortality with short-term air pollution exposure, our study represents one of only a few cohort studies that have been conducted in Asia examining the association between long-term exposure to PM2.5 and CVD mortality. In our study, we found that long-term exposure to increased particulate air pollution was not associated with an increased CVD or all-cause mortality.
Our findings are inconsistent with prior studies including the Harvard Six Cities Study and American Cancer Study (3, 4). However, the majority of studies on the long-term effect of particulate matter is from Europe and North America and therefore may not be generalizable to
Asian countries where the particulate composition is different, and this heterogeneity could explain some of the differences in health impact. In Taiwan, where there are over 21.7 million registered motor vehicles (14.85 million scooters and 6.88 million cars), the 2-stroke engines of scooters are an important source of volatile organic compounds, carbon monoxide, nitrogen oxide and PM (16). Furthermore, cardiovascular and cerebrovascular disease mortality differs between Western and Asian populations. Data from the World Health Organization shows that in general, stroke mortality in Asian countries is higher than in Western countries. Additionally, East Asian countries tend to have a lower coronary heart disease mortality compared to Western countries (11). When we compared mortality rates for ischemic heart disease versus
cerebrovascular disease in this cohort, however, there did not appear to be this difference (Table 2). The number of deaths when examined separately for ischemic heart disease and
cerebrovascular disease is small and may have limited our ability to detect a significant difference.
A potential explanation for why we did not find a significant association between
particulate matter and CVD mortality is the difference in our study population compared to those in previously published studies. For example, the Harvard Six Cities Study population had a higher percentage of smokers (combining former and current smokers) and lower education levels, and many of the participants were exposed to dust or fumes at their job. In contrast, our study population only includes individuals who are civil servants with a high education level and likely no occupational exposure to dust or fumes. Additionally, their occupation as civil servants provides them with a steady income. Therefore, their stable socioeconomic status may confer them less vulnerability to air pollution as suggested by prior published studies which argue that
people with a high socioeconomic status and healthier lifestyles are less susceptible to the cardiovascular effects of air pollution (17).
Our study results are consistent with the NIPPON DATA80 Japanese cohort study which found an inverse association between CVD mortality and PM (10).This cohort study included 7,250 individuals from 300 randomly selected districts in Japan and assessed the long-term effect of PM exposure on mortality. In their study, Ueda et al. found that adjusted HRs for CVD mortality tended to decrease per 10µg/m3 increase in PM (HR 0.90, 95%CI: 0.81, 1.00). Similar to Taiwan, the air pollution composition in Japan is different from the U.S., and these exposure differences may mean that studies from Western countries cannot be generalized to Asian countries.
With regards to effect modification on the association between PM2.5 and mortality, we found that diabetes and a BMI>27.5 kg/m² had a protective effect on all-cause mortality. These results contrast with other studies suggesting that people with diabetes may be more vulnerable to the cardiovascular effects of PM (6). Studies on obesity alone and air pollution vulnerability are inconsistent however. In the Women’s Health Initiative, Miller et al. found that the
association between cardiovascular events and PM2.5 increased with higher levels of BMI (18). In contrast, in the Multi-ethnic Study of Atherosclerosis cohort, no effect modification by BMI was seen on subclinical atherosclerosis and 20-year exposures to PM2.5(19).
The strengths of the study include having 20 years of prospective follow-up of a large cohort. We were able to adjust for confounders including cardiovascular risk factors like smoking and socioeconomic variables like income and education. We did several subsequent analyses including time-dependent cox regression analysis to see if sub-chronic exposure to PM2.5would be a more sensitive measure of the exposure variability. We also examined the effect
of other pollutants on the association between PM2.5and CVD mortality. Evidence shows that these pollutants may have independent adverse effects on cardiovascular risk (6).
There are several limitations to our study. First, a major limitation was the lack of power due to the small number of event cases. This may in part be due to our use of ICD codes to determine the cause of death which can potentially lead to the underreporting of deaths due to CVD and underestimate the effects. Second, studies conducted in Asia that found a positive association between CVD mortality and PM defined CVD deaths much more broadly than we did by including a wider range of ICD codes which could have led to a significant association (8, 9).Third, since our study is confined to the Taipei metropolitan basin, there was limited
variability in PM2.5exposure which may have restricted our ability to detect a significant
association. Fourth, we used only the participant’s phone number to assign them to a residential district and did not account for the possibility that participants moved during the study.
Additionally, the air pollution data we used was partially obtained by backward prediction. Thus, both limitations could have led to exposure misclassification. Finally, we adjusted for personal characteristics only at baseline and did not adjust for triglyceride, total cholesterol and GFR measurements because a large number of individuals were missing this data. However, we did perform a sensitivity analysis on a subgroup of individuals with this data available, and the results were unchanged (Appendix Table 3).
Our study did not demonstrate a significant association between long-term exposure to particulate matter and CVD mortality in this population of civil servants living in a large urban city. There is a paucity of data on the long-term air pollution effects in Asia which limit
comparison of our study findings to others. Further cohort studies are necessary to accurately estimate the effects of long-term air pollution on mortality in Asia.
Acknowledgements
Conflict of Interest Disclosures None declared.
Funding/Support
Taiwan National Science Council and Environmental Protection Agency (NSC 99-EPA-M- 002-002)
Ethical Approval
This study was approved by the Institutional Review Board of the College of Public Health of National Taiwan University (Approval number: 990309).
Tables and Figures
Figure 1. Flow Diagram of Exclusions and Subgroup Analyses of the Civil Servants Cohort, Taiwan.
Quintile 1 Quintile 2 Quintile 3 Quintile 4 Quintile 5
Sanzhi, Taipei County Linkou, Taipei County Shuangsi, Taipei County Daan, Taipei City Banciao, Taipei County Danshui, Taipei County Sizhi, Taipei County Wenshan, Taipei City Shulin, Taipei County Wanhua. Taipei City
Beitou, Taipei City Wanfang, Taipei County Neihu, Taipei City Taishan, Taipei County Jhonghshan, Taipei City Shimen, Taipei County Gongliao, Taipei County Yingge, Taipei County Shinyi, Taipei City Sanchong, Taipei County Shilin, Taipei City Sindian, Taipei County Sansia, Taipei County Yonghe Taipei County Datong, Taipei City
Pingsi, Taipei County Jhonghe, Taipei County Jhongjheng, Taipei City Sinjhuang, Taipei County
75,395 recruited into civil servants cohort
4,166 from outside of greater Taipei city excluded
43,227 from greater Taipei City included in Cox Regression analysis
28,002 excluded from analysis:
10,311 No insurance ID number data 84 No age data
6,849 No alcohol use data 6,201 No income data 1,258 No education data 46 No height or weight data
1,030 No smoking or marital status data 2,195 No chronic disease data
25 with discrepancy in age and date of entry 3 with BMI data incorrect
12,405 in subgroup analysis of urban areas in Taipei City
42,599 included in time-dependent Cox Regression analysis
Table 1. Baseline Characteristics of Participants in Civil Servants Cohort, Taiwan, According to Quintiles of Average PM2.5 Concentration.
Characteristic
Quintile
1 2 3 4 5
No. of participants 5,520 3,847 8,267 19,004 6,589
Range of average PM2.5 concentration,
μg/m³ 22.8-27.2 27.3-28.6 28.7-30 30.1-30.9 31.5-32.9
Mean PM2.5 in μg/m³ (SD) 25.8 (1.4) 28.3 (0.4) 29.6 (0.4) 30.4 (0.3) 32 (0.4)
Female sex (%) 47.3 38.7 39.2 44.5 42.6
Less than high-school education (%) 1.9 1.7 2.3 1.8 2.6 Marital status Married (%) 45.7 41.1 39.3 39.2 37.9 Other (%) 54.3 58.9 60.7 60.8 62.1 Income in NT (%) ≤$ 30,000 8.6 10.1 10.5 7.1 11.2 $30,000-60,000 45.9 52.1 51.7 43.0 51.7 $60,000-100,000 37.3 31.8 32.1 39.4 31.2 >$100,000 8.2 6.1 5.8 10.5 5.9
Average age at recruitment in years (SD) (10.4)40.6 (10.7)40.6 (10.4)40.4 (10.5)42.5 39.7 (10.8) Smokers (%)
Never 52.2 47.4 48.4 47.7 49.7
Former 7.7 8.0 8.2 7.5 7.0
Current 40.1 44.6 43.4 44.8 43.3
Habitual alcohol consumption (%) 72.4 75.3 73.7 74.6 73.0 Average body-mass indexᵃ, % 22.7 23.1 23.9 22.8 22.8
<20.1 19.0 14.8 16.7 16.9 17.9
20.1-27.5 75.1 78.6 76.6 77.7 76.0
>27.5 5.9 6.7 6.7 5.4 6.1
Serum triglyceride level (mg/dL) 113.0 116.0 116.0 113.0 117.0 Serum total cholesterol level (mg/dL) 197.0 194.0 195.0 197.0 197.0
Diabetes mellitus (%) 2.2 1.8 1.7 2.1 1.7
Hypertension (%) 9.0 9.8 9.6 10.2 8.9
History of cerebrovascular disease (%) 0.4 0.3 0.4 0.3 0.3
History of heart disease (%) 4.4 5.0 5.0 5.2 4.5
Average GFRᵇ (mL/min/1.73m2)
83.0 83.0 82.8 83.1 82.9
Abbreviations: GFR, glomerular filtration rate; NT, National Taiwan dollars; SD, standard deviation. ᵃ Calculated as weight in kilograms divided by height in meters squared.
ᵇ Calculated using the modification of diet in renal disease (MDRD) equation: eGFR (mL/min/1•73 m2) = 175 × (Scr)-1•154 × (Age)-0•203 × (0•742 if female).
Table 2. Multivariate-Adjusted Hazard Ratios for All-Cause, CVD, IHD and Cerebrovascular Mortality by Quintiles, Estimated From Cox Proportional-Hazards Model.
No. of persons No. of deaths Deaths/1000 person-years Model 1ᵃ Model 2ᵇ HR (95%CI) HR (95%CI) All-causes Q1 5,520 246 0.77 1.00 1.00 Q2 3,847 202 0.91 1.09 (0.91-1.32) 1.13 (0.94-1.36) Q3 8,267 367 0.77 1.01 (0.86-1.18) 1.00 (0.85-1.17) Q4 19,004 900 0.79 0.91 (0.79-1.05) 0.96 (0.83-1.11) Q5 6,589 277 0.74 0.99 (0.84-1.18) 0.99 (0.83-1.18) Per 10μg/m3 increase 0.90 (0.71-1.15) 0.93 (0.73-1.18) CVD Q1 5,520 34 0.11 1.00 1.00 Q2 3,847 31 0.14 1.23 (0.76-2.01) 1.28 (0.78-2.08) Q3 8,267 56 0.12 1.12 (0.73-1.71) 1.08 (0.70-1.66) Q4 19,004 121 0.11 0.87 (0.59-1.27) 0.94 (0.64-1.37) Q5 6,589 38 0.1 0.99 (0.62-1.57) 0.94 (0.59-1.50) Per 10μg/m3 increase 0.78 (0.42-1.48) 0.80 (0.43-1.50) IHD Q1 5,520 15 0.047 1.00 1.00 Q2 3,847 15 0.068 1.25 (0.62-2.54) 1.31 (0.64-2.65) Q3 8,267 33 0.069 1.42 (0.78-2.57) 1.36 (0.75-2.48) Q4 19,004 60 0.053 0.92 (0.53-1.60) 1.00 (0.57-1.74) Q5 6,589 15 0.04 0.84 (0.42-1.70) 0.82 (0.40-1.66) Per 10μg/m3 increase 0.74 (0.30-1.81) 0.77 (0.32-1.87) Cerebrovascular Disease Q1 5,520 18 0.057 1.00 1.00 Q2 3,847 16 0.072 1.22 (0.62-2.39) 1.24 (0.63-2.45) Q3 8,267 23 0.048 0.86 (0.46-1.60) 0.83 (0.45-1.54) Q4 19,004 61 0.054 0.82 (0.48-1.38) 0.88 (0.52-1.48) Q5 6,589 23 0.061 1.11 (0.60-2.06) 1.04 (0.56-1.93) Per 10μg/m3 increase 0.68 (0.34-2.04) 0.83 (0.34-2.02) Abbreviations: CI, confidence interval; CVD, cardiovascular disease (combines IHD and stroke); HR, hazard ratio; IHD, ischemic heart disease.
ᵃ Model 1: Adjusted for age
ᵇ Model 2: Adjusted for age, sex, marital status, income, smoking, alcohol, BMI, education, diabetes and hypertension
Table 3. Multivariate-Adjusted Hazard Ratios for All-Cause, CVD, IHD and Cerebrovascular Mortality per 10μg/m³ of PM2.5, Stratifying for Sex, Smoking Status, Diabetes and BMI.
Potential effect modifier
Covariate level
Mortality Rate Ratio (95%CI)
All causeᵃ CVDᵃ IHDᵃ Cerebrovascular diseaseᵃ
Gender Male 0.97 (0.74-1.27) 0.90 (0.46-1.77) 0.94 (0.36-2.43) 0.87 (0.34-2.26) Female 0.80 (0.48-1.34) 0.36 (0.07-1.91) 0.22 (0.02-2.15) 0.59 (0.05-6.95) p for interaction 0.53 0.33 0.27 0.78 Smoking status Never 0.74 (0.52-1.07) 0.64 (0.23-1.74) 0.85 (0.19-3.71) 0.49 (0.12-1.91) Former 0.95 (0.55-1.64) 0.77 (0.18-3.29) 2.45 (0.24-25.29) 0.28 (0.04-1.86) Current 1.17 (0.79-1.74) 1.00 (0.38-2.61) 0.49 (0.14-1.68) 2.38 (0.53-10.74) p for interaction 0.24 0.82 0.46 0.15 Diabetes No 1.02 (0.79-1.32) 0.89 (0.46-1.75) 0.82 (0.31-2.13) 0.97 (0.38-2.48) Yes 0.44 (0.22-0.86) 0.39 (0.07-2.13) 0.61 (0.07-5.67) 0.19 (0.01-2.72) p for interaction 0.03 0.38 0.81 0.28 BMI (kg/m2) <20.1 0.64 (0.31-1.32) 0.79 (0.07-9.24) 26.24 (0.05-13390.88) 0.29 (0.02-3.93) 20.1-27.5 1.15 (0.87-1.52) 0.93 (0.45-1.90) 0.75 (0.28-2.02) 1.15 (0.41-3.24) >27.5 0.37 (0.20-0.70) 0.39 (0.09-1.78) 0.52 (0.07-3.84) 0.27 (0.03-2.76) p for interaction 0.005 0.61 0.43 0.41
Abbreviations: CI, confidence interval; CVD, cardiovascular disease (combines IHD and stroke); HR, hazard ratio; IHD, ischemic heart disease.
Appendix Table 1. Cardiovascular Mortality From Other Pollutants Estimated From Cox Proportional-Hazards Model, Adjusting for Covariates.
Pollutant
Crude Multivariable adjustedᵃ HR (95% CI) HR (95% CI) CO 1.43 (0.48-4.22) 1.59 (0.55-4.60) NO 1.02 (0.97-1.06) 1.03 (0.98-1.07) NO₂ 0.99 (0.95-.103) 0.99 (0.96-1.04) NOX 1.00 (0.98-1.02) 1.01 (0.98-1.03) O3 1.01 (0.97-1.06) 1.00 (0.96-1.05) SO2 0.99 (0.72-1.37) 0.91 (0.66-1.24)
Abbreviations: CI, confidence interval; CO, carbon monoxide; HR, hazard ratio; NO, nitric oxide; NO2, nitrogen dioxide; NOX, nitrogen oxides; O3, ozone; SO2,
sulfur dioxide.
ᵃ Adjusted for age, sex, marital status, income, smoking, alcohol, BMI, education, diabetes and hypertension.
Appendix Table 2. Multivariable-Adjusted Cardiovascular Mortality-Rate Ratios Adjusted for Other Pollutants.
Quintile
PM2.5 PM2.5 + CO PM2.5 + NO2 PM2.5 + NO PM2.5 + NOX PM2.5 + O3 PM2.5 + SO2
HRᵃ (95% CI) HRᵃ (95% CI) HRᵃ (95% CI) HRᵃ (95% CI) HRᵃ (95% CI) HRᵃ (95% CI) HRᵃ (95% CI)
1 1.00 (reference) 1.00 (reference) 1.00 (reference) 1.00 (reference) 1.00 (reference) 1.00 (reference) 1.00 (reference)
2 1.13 (0.94-1.36) 1.23 (0.76-2.01) 1.06 (0.59-1.91) 1.41 (0.86-2.31) 1.19 (0.73-1.95) 0.99 (0.48-2.04) 1.36 (0.78-2.37)
3 1.00 (0.85-1.17) 0.88 (0.56-1.39) 0.82 (0.42-1.58) 1.03 (0.67-1.58) 0.86 (0.54-1.38) 0.79 (0.36-1.73) 1.16 (0.70-1.94)
4 0.96 (0.83-1.10) 0.68 (0.43-1.07) 0.64 (0.29-1.41) 0.78 (0.53-1.17) 0.65 (0.39-1.07) 0.63 (0.26-1.57) 1.01 (0.62-1.64)
5 0.99 (0.83-1.18) 0.60 (0.33-1.09) 0.61 (0.25-1.53) 0.71 (0.42-1.19) 0.59 (0.31-1.12) 0.65 (0.26-1.63) 1.08 (0.54-2.14)
Abbreviations: CI, confidence interval; CO, carbon monoxide; HR, hazard ratio; NO, nitric oxide; NO2, nitrogen dioxide; NOX, nitrogen oxides; O3, ozone; SO2, sulfur
dioxide.
Appendix Table 3. Sensitivity Analysis Performed on Subpopulation With Non-Missing Data for Triglyceride, Creatinine and Cholesterol Levels. Multivariate-Adjusted Hazard Ratios for All-Cause and CVD Mortality by Quintiles, Estimated From Cox Proportional-Hazards Model.
Model 1ᵃ Model 2ᵇ HR (95%CI) HR (95%CI) All-causes Q1 1.00 1.00 Q2 1.04 (0.84-1.27) 1.07 (0.87-1.32) Q3 0.98 (0.82-1.17) 0.96 (0.81-1.15) Q4 0.87 (0.75-1.01) 0.92 (0.80-1.07) Q5 0.93 (0.77-1.12) 0.93 (0.77-1.12) Per 10μg/m3 increase 0.84 (0.64-1.09) 0.87 (0.67-1.13) CVD Q1 1.00 1.00 Q2 1.31 (0.78-2.18) 1.39 (0.83-.2.32) Q3 1.09 (1.69-1.72) 1.06 (0.67-1.67) Q4 0.85 (0.57-1.27) 0.92 (0.61-1.37) Q5 0.99 (0.61-1.62) 0.94 (0.57-1.53) Per 10μg/m3 increase 0.75 (0.38-1.48) 0.76 (0.39-1.47) Abbreviations: CI, confidence interval; CVD, cardiovascular and cerebrovascular disease; HR, hazard ratio.
ᵃ Model 1: Adjusted for age
ᵇ Model 2: Adjusted for age, sex, marital status, income, smoking, alcohol, BMI, education, diabetes and hypertension.
Abbreviations
BMI Body Mass Index
CI Confidence Interval
CO Carbon monoxide
CVD Cardiovascular and cerebrovascular disease GFR Glomerular filtration rate
HR Hazard ratio
ICD International Classification of Disease IHD Ischemic heart disease
NO2 Nitrogen dioxide
NO Nitric oxide
NOX Nitrogen oxides
NT National Taiwan dollars
O3 Ozone
PM2.5 Particulate matter with a diameter of 2.5 μm or less PM10 Particulate matter with a diameter of 10 μm or less
SD Standard deviation
References
1. Villeneueve PJ, Goldberg MS, Krewski D, et al. Fine particulate air pollution and all-cause mortality within the Harvard Six-Cities Study: variations in risk by period of exposure. Ann Epidemiol 2002;12(8):568-576.
2. Peters A. Air quality and cardiovascular health: smoke and pollution matter. Circulation. 2009;120(11):924-927.
3. Dockery DW, Pope CA 3rd, Xu X, et al. An association between air pollution and mortality in six U.S. cities. N Engl J Med. 1993;329(24):1753–1759.
4. Pope CA 3rd, Thun MJ, Namboodiri MM, et al. Particulate air pollution as a predictor of mortality in a prospective study of U.S. adults. Am J Respir Crit Care Med.
1995;151:669–674.
5. Brook RD, Rajagopalan S, Pope CA 3rd, et al. Particulate matter air pollution and cardiovascular disease: an update to the scientific statement from the American Heart Association. Circulation. 2010;121(21):2331-78.
6. Gold DR, Mittleman MA. New insights into pollution and the cardiovascular system 2010 to 2012. Circulation 2013;127(18):1903-1913.
7. Katsouyanni K, Touloumi F, Samoli E, et al. Confounding and effect modification in the short-term effects of ambient particles on total mortality: results from 29 European countries within the APHEA2 project. Epidemiology 2001;12(5):521-531.
8. Zhang P, Dong G, Sun B, et al. Long-term exposure to ambient air pollution and mortality due to cardiovascular disease and cerebrovascular disease in Shenyang, China. PLoS One. 2011;12:e20827.
9. Yorifuji T, Kashima S, Tsuda T, et al. Long-term exposure to traffic-related air pollution and mortality in Shizuoka, Japan. Occup Environ Med. 2010; 67(2):111-7.
10. Ueda K, Nagasawa SY, Nitta H, et al. NIPPON DATA80 Research Group. Exposure to particulate matter and long-term risk of cardiovascular mortality in Japan: NIPPON DATA80. J Atheroscler Thromb. 2012;19(3):246–254.
11. Ueshima H, Sekikawa A, Miura K, et al. Cardiovascular disease and risk factors in Asia: a selected review. Circulation 2008;118(25): 2702-2709.
12. Wen CP, Tsai SP, Chen CJ, et al. The mortality risks of smokers in Taiwan: Part I: cause-specific mortality. Prev Med 2004;39(3):528-35.
13. Ho MS. A long-term follow-up study of chronic diseases among civil servants and teachers in Taiwan (The Project Report). Institute of Biomedical Sciences, Academia Sinica, Taipei, Taiwan, 1993.
14. Taiwan Environmental Protection Agency. Taiwan Air Quality Monitoring Network.
http://taqm.epa.gov.tw/taqm/en. Updated March 12, 2014. Accessed September 1, 2014.
15. Zheng W, McLerran DF, Rolland B, et al. Association between body-mass index and risk of death in more than 1 million Asians. N Engl J Med 2011;364(8):719-29.
16. Su TC, Chen SY, Chang CC. Progress of ambient air pollution and cardiovascular disease research in Asia. Prog Cardiovasc Dis 2011;53(5):369-378.
17. Puett RC, Hart JE, Suh H, et al. Particulate matter exposures, mortality, and cardiovascular disease in the health professionals follow-up study. Environ Health Perspect 2011; 119z918):1130-1135.
18. Miller KA, Siscovick DS, Sheppard L, et al. Long-term exposure to air pollution and incidence of cardiovascular events in women. N Engl J Med. 2007;356:511-513.
19.Sacks JD, Stanek LW, Luben TJ, et al. Particulate matter-induced health effects: who is