國 立 交 通 大 學
資訊科學與工程研究所
碩 士 論 文
兩徑通道引起之深衰落
正交分頻多工系統影響研究
Compensation for
Deep Fading Effect of Two-Ray Channel
in OFDM System
研 究 生:葉邵穎
指導教授:許騰尹 教授
ii
ii
兩徑通道引起之深衰落正交分頻多工系統影響研究
Compensation for Deep Fading Effect of Two-Ray Channel
in OFDM System
研 究 生:葉邵穎 Student:Shao-Ying Yeh
指導教授:許騰尹 Advisor:Terng-Yin Hsu
國 立 交 通 大 學
資 訊 科 學 與 工 程 研 究 所
碩 士 論 文
A ThesisSubmitted to Institute of Computer Science and Engineering College of Computer Science
National Chiao Tung University in partial Fulfillment of the Requirements
for the Degree of Master
in
Computer Science
August 2009
Hsinchu, Taiwan, Republic of China
iii iii
摘要
本論文提出了一個在不改變傳送端規格下,在接收端解決深衰落的方法。由於正 交分頻多工系統是於多工載波傳送,因此當遇到選擇性衰落的通道時,效能會明顯下 降。當傳送訊號通過兩徑通道所產生的深衰落效應時,被深衰落的資料將完全消失, 以至於接收端無法正確的把資料解回。 本論文使用一種虛擬通道法,接收端在時域先處理訊號,然後經過快速傅麗葉轉 換後,處理被深衰落的訊號。此方法可以在傳送規格 3/4、64QAM 下,在 36 分貝收斂。iv
iv
Abstract
This paper proposes a method in Rx for deep-fading channel with no variation Tx.
Because of OFDM system is multicarrier modulation. Therefore, the performance is
affected by selective fading. When the transmitted signal through pass the deep fading
channel. The deep fading data will lose after FFT.
This paper of contribution is resolved the deep-fading channel in Rx with no variation
v
v
Acknowledgement
I would like to thank my advisors, Dr. Terng-Yin Hsu, for advice, guidance and constant
care. To my dear isIP Lab. members, this work would not have been possible without your
support. You make me feel free and comfortable. Always be grateful to my family, your
unconditional love encourages me all the time.
Sincerely, Shao-Ying Yeh
vi vi
Table of Contents
摘要... III ABSTRACT ...IV ACKNOWLEDGEMENT ... V TABLE OF CONTENTS ...VI LIST OF FIGURES...VIII LIST OF TABLES ...IXCHAPTER 1 INTRODUCTION... 1
-1.1TWO-RAY CHANNEL...-1
-1.2DEEP FADING EFFECT...-2
1.2.1 OFDM System... 3
CHAPTER 2 SYSTEM PLATFORM... 5
-2.1IEEE802.11A PHYSPECIFICATION...-5
2.1.1 Transmitter... 5
2.1.2 Receiver ... 6
2.1.3 Packet Format... 7
-2.2TWO-RAY CHANNEL MODEL...-7
CHAPTER 3 THE PROPOSED ALGORITHM ... 9
-3.1PSEUDO CHANNEL BLOCK DIAGRAM...-9
-3.2PSEUDO CHANNEL ALGORITHM PROCESS...-10
3.2.1 Removed Redundant AWGN... 11
3.2.2 Convolute Pseudo Channel... 12
-vii
vii
3.2.4 Noise Enhance ... 14
CHAPTER 4 SIMULATION RESULTS ... 15
CHAPTER 5 CONCLUSION AND FUTURE WORK ... 19
5.1.1 Conclusion ... 19
5.1.2 Future Work ... 20
-viii
viii
List of Figures
Figure 1-1 Two-ray channel... - 2 -
Figure 1-2 Two-ray channel impulse response... - 2 -
Figure 1-3 Two-ray channel frequency response,H k ... - 3 - [ ]
Figure 1-4 Transmitted Data,S k ... - 4 - [ ]
Figure 1-5 Received Signal,Y k ... - 4 - [ ]
Figure 1-6 Received Data,S k ... - 4 - '[ ]
Figure 2-1 IEEE 802.11a transmitter... - 6 -
Figure 2-2 IEEE 802.11a receiver ... - 6 -
Figure 2-3 IEEE 802.11a packet format ... - 7 -
Figure 2-5 Two-ray channel model... - 8 -
Figure 2-6 Carrier error rate ... - 8 -
Figure 3-1 Block Diagram... - 9 -
Figure 3-2 A sample of transmitted signal and index 16 of signal ... - 10 -
Figure 3-3 A sample of received signal on index 16,y16( )t ... - 11 -
Figure 3-4 Removed redundant AWGN after 2 unit time... - 12 -
Figure 3-5 Pseudo channel impulse response... - 12 -
Figure 3-6 Convolute two-ray channel and pseudo channel ... - 13 -
Figure 3-7 Convolute the receiver signal and pseudo channel... - 13 -
Figure 3-8 Compare no removed and removed AWGN ... - 14 -
Figure 4-2 BER vs. SNR ... - 16 -
Figure 4-3 PER vs. SNR... - 17 -
Figure 4-4 SNR vs. CER by pseudo channel algorithm with removed redundant AWGN ... - 17 -
Figure 4-5 SNR vs. CER on 36dB by pseudo channel algorithm with removed redundant AWGN ... - 18 -
ix
ix
List of Tables
- 1 -
1
-Chapter 1
Introduction
As the wireless communication is widely applied, serious effect occur in some environment. A special channel called two-ray channel reveals when transmit signals by two paths between transmitter and receiver occurs to.
There is a simple idea in [1]. The idea is precoding OFDM system. In Tx, the signal is precoded before transmitted. And [2] enhance [1]’s method, the ideal is zero-padding in Tx. Insert zero-value in GI(Guard Interval) for equalizer in time-domain. The two methods are result of good performance. But IEEE 802.1 series are not used.
In this paper of contribution is only resolved two-ray channel in Rx by the specification of IEEE, the Tx is not varied. The occasion two-ray channel is introduced in section 1.1. And section 1.2 describes the deep fading effect induced by two-ray channel. Finally, section 1.3 show how OFDM system is crashed by two-ray channel
1.1 Two-ray Channel
In wireless communication, the signal in TX transmitted through channel and received
in RX. If RX receives the two signals which delay n apart and have the same attenuation, 0
2
2
-Figure 1-1 Two-ray channel
1.2 Deep Fading Effect
In this paper, we define the deep fading effect which is some approximating zero or
zero values on channel frequency response. And the approximating zero or zero values on
channel frequency response are defined deep fading points.
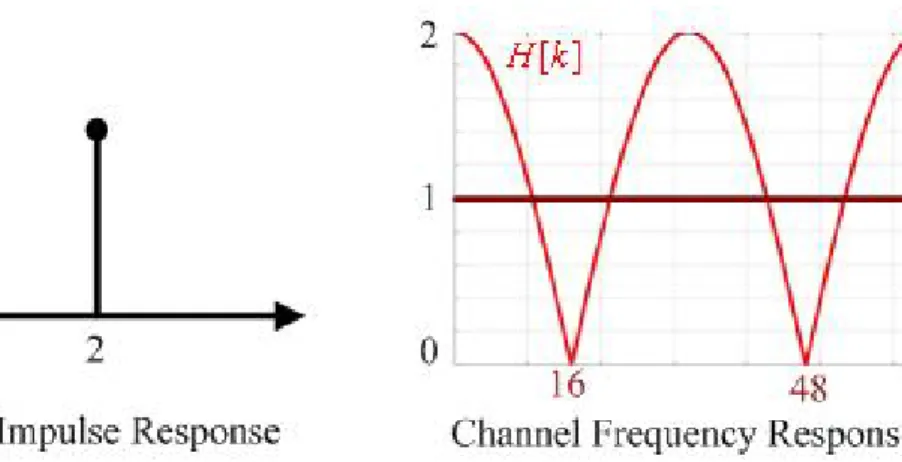
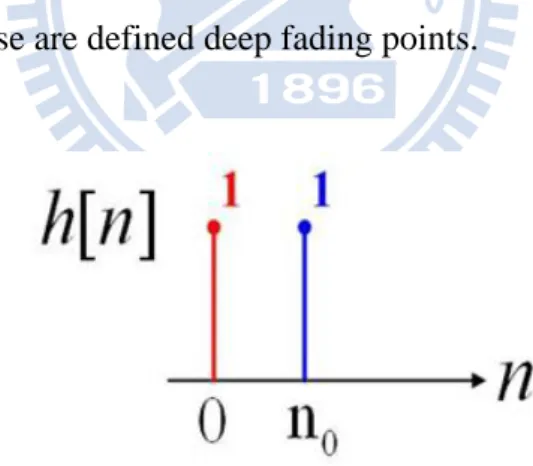
Figure 1-2 Two-ray channel impulse response
The two-ray channel of CIR (channel impulse response) is shown in Figure 1-2, and the
mathematic is expressed as:
0
[ ] [ ] [ ] (1.1)
- 3 -
3
-Now, we transfer the CIR to CFR (channel frequency response) by FFT, shown as
Figure 1-3. Observation, there is some deep fading points over spectrum.
Figure 1-3 Two-ray channel frequency response,H k [ ]
1.2.1 OFDM System
The OFDM systems may be severely distortion by two-ray channel. Because of the
OFDM (Orthogonal Frequency-Division Multiplexing) is one of multicarrier modulation
and equalization in frequency domain.
In general, the bit-stream data is modulated to tones, transmitted data [ ]S k . In Rx, the
transmitted signal through pass to channel,H K , and add AWGN,[ ] N k , the received [ ] signal is Y k . Because of attenuation of the channel on every tone should be compensated. [ ] Therefore, the equalizer compensate for the attenuation to the estimated data '[ ]S k . Above
description is in frequency domain, and express as:
[ ] [ ] [ ] [ ] [ ] '[ ] (1.2) [ ] [ ] [ ] [ ] Y k H k S k N k Y k S k H k N k S k H k = + ⇒ = = +
For example, Figure 1-4 show the Tx which transmitted data are all ones tones in
frequency, and this signals which through pass to two-ray channel, Figure 1-3 , is received
in Rx, shown in Figure 1-5. And then we equalize the received signal, shown in Figure 1-6.
4
4
-deteriorated on deep fading points.
Figure 1-4 Transmitted Data, [ ]S k
Figure 1-5 Received Signal, [ ]Y k
- 5 -
5
-Chapter 2
System platform
2.1 IEEE 802.11a PHY Specification
Orthogonal Frequency Division Multiplexing (OFDM) is a multi-carrier modulation
that achieves high data rate and combat multi-path fading in wireless networks. The main
concept of OFDM is to divide available channel into several orthogonal sub-channels. All of
the sub-channels are transmitted simultaneously, thus achieve a high spectral efficiency.
Furthermore, individual data is carried on each sub-carrier, and this is the reason the
equalizer can be implemented with low complexity in frequency domain.
2.1.1 Transmitter
The transmitter block diagram of OFDM specified in IEEE 802.11a proposal is shown
as Figure 2-1. The source data is first scrambled to prevent a succession of zeros or ones,
and then it is encoded by convolutional encoder, which is used as Forward Error Correction
(FEC). The FEC-encoded bit stream is punctured in order to support four coding rates, 1/2,
2/3, 3/4 and 5/6.
The interleaver changes the order of bits to prevent burst error. Then the interleaved
6
6
-modulations, BPSK, QPSK, 16-QAM and 64-QAM.
There are 64 frequency entries for each IFFT, or 64 sub-carriers in each OFDM symbol.
52 of them are data carriers, 4 of them are pilot carriers and the rest 8 are null carriers.
Finally, the time domain signals appended to the Guard Interval (GI) of 1/4 symbol length,
are transmitted by RF modules.
Figure 2-1 IEEE 802.11a transmitter
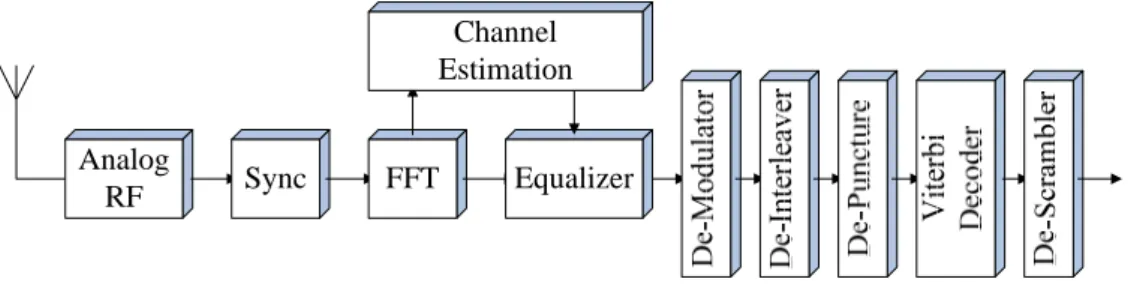
2.1.2 Receiver
The receiver block diagram is shown as Figure 2-2. Signals received from the RF
modules are first synchronized to recognize each OFDM symbol. Each OFDM symbol is
transformed to frequency domain by the Fast Fourier Transform (FFT). If the OFDM
symbol belongs to long preamble (described in section 2.1.3), then it is used for channel
estimation. Otherwise, it belongs to payload and is decoded by equalizer, which needs the
CFR information estimated by the channel estimation block.
After separated by equalizer, the data carriers are demodulated to bit-level stream.
Then these bit-level data stream is de-interleaved. Finally, the data stream is decoded by
FEC which includes de-puncturing, Viterbi decoder and de-scrambler.
Analog
RF Sync FFT Equalizer Channel Estimation
- 7 -
7
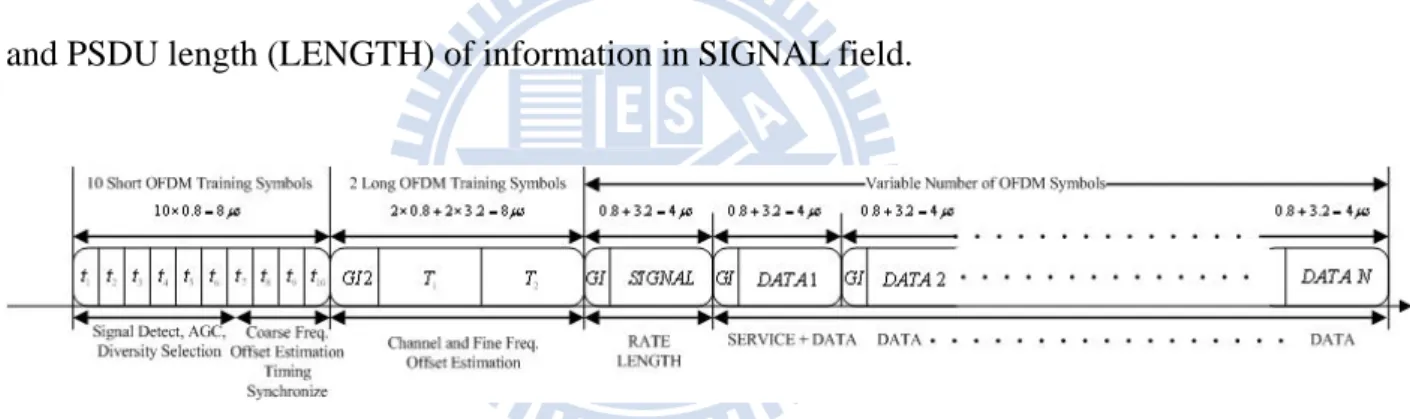
-2.1.3 Packet Format
The packet format fields are shown as Figure 2-3. The OFDM training structure (PLCP
preamble), wheret to1 t denote short training symbols, and each of transmitted time 10
is0.8 sμ .Thet1tot7are used to signal detection, AGC(Automatic Gain Control) and, diversity selection. The other, t to7 t , are used to timing synchronize and coarse frequency offset 10
estimation.
The T and 1 T denote long training symbols, and each of transmitted time is 2
3.2 sμ .The long training symbols are used to Channel estimation and fine frequency offset estimation. The total training length is 16 sμ . In this paper, the key points are the format of long training symbol.
The PLCP preamble is followed by SIGNAL field and DATA, which data rate (RATE)
and PSDU length (LENGTH) of information in SIGNAL field.
Figure 2-3 IEEE 802.11a packet format
2.2 Two-ray Channel Model
In this section, our two-ray channel model of CIR and CFR is shown in Figure 2-4. It
is two comparable pulses which are delayed 2 units apart in CIR, and there is two deep
fading points on index 16 and 48 in CFR. It is the simplest two-ray channel model, but it
8
8
-Figure 2-5 Two-ray channel model
Figure 2-5 show carrier error rate in two-ray channel model. We can observe although
SNR approximate 60dB, there is two errors, highlight in figure, on spectrum,
- 9 -
9
-Chapter 3
The proposed algorithm
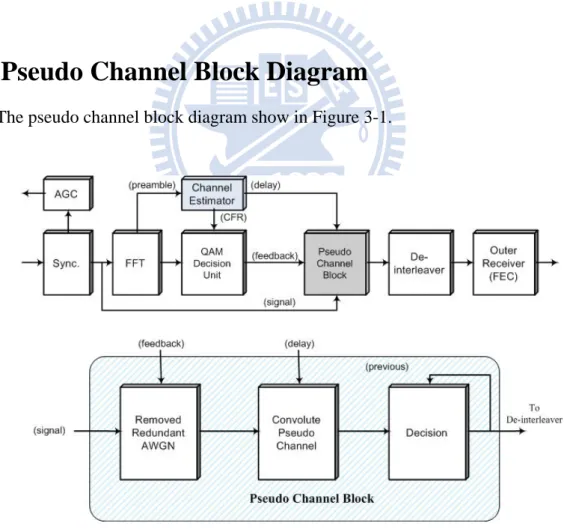
3.1 Pseudo Channel Block Diagram
The pseudo channel block diagram show in Figure 3-1.
Figure 3-1 Block Diagram
10
10
-is non-deep-fading tones. After the “Sync.”(synchronize), if received signal -is preamble,
then input the data to “Channel Estimator” for estimating CFR, and then feed CFR into
“Pseudo Channel Block”. In this paper, the channel model is fixed, and we assume the
channel estimation is accuracy.
Else if the signal is payload, then we resolve the non-deep-fading tones at first by
equalizer, ”QAM Decision Unit”, and feedback resolved data to “Pseudo Channel Block”.
The remainder, deep-fading tones, is resolved by “Pseudo Channel Block”.
3.2 Pseudo Channel Algorithm Process
In Figure 3-1 below, pseudo channel process have three steps. The first step is removed
redundant AWGN. The second step is convolute pseudo channel. Final step is decision.
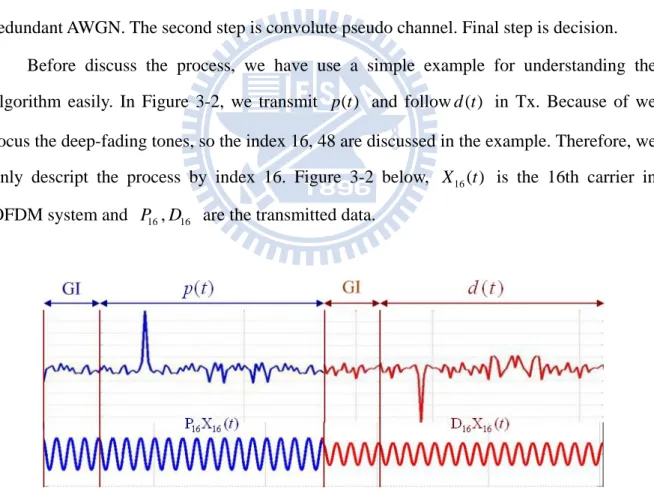
Before discuss the process, we have use a simple example for understanding the
algorithm easily. In Figure 3-2, we transmit p t and follow ( )( ) d t in Tx. Because of we
focus the deep-fading tones, so the index 16, 48 are discussed in the example. Therefore, we
only descript the process by index 16. Figure 3-2 below, X16( )t is the 16th carrier in
OFDM system and P ,16 D are the transmitted data. 16
Figure 3-2 A sample of transmitted signal and index 16 of signal
Figure 2-5 show the two-ray channel we focus in this paper. When the 16th carrier
- 11 -
11
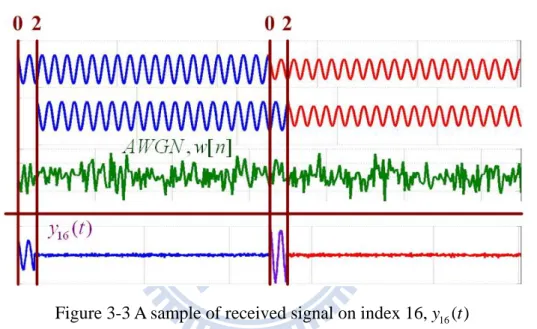
-and is added AWGN (Additive White Gaussian Noise). Figure 3-3 show effected signal by
two-ray channel. In Rx, the received signal is shown in Figure 3-3 below, r t . Formal 16( ) expression is shown as:
[ ] [ ]* [ ] [ ] (3.1)
y n =h n s n +w n
[ ]
s n is the transmitted signal. y n is the received signal. The two-ray channel, [ ][ ] h n ,
we defined in section 2.2. w n is AWGN. And the notation ‘*’ means convolution. [ ]
Figure 3-3 A sample of received signal on index 16,y16( )t
Observation, there is no signal power about transmitted data after 2 unit time and it is
only AWGN. By the general OFDM system, we get a interval signal after GI (Guard
Interval) which is only AWGN in the 16th carrier. Therefore, there is noise enhance on index
16 in two-ray channel.
3.2.1 Removed Redundant AWGN
In Figure 3-3 below, the redundant AWGN of the received signal is replaced by zeros,
shown in Figure 3-4. But the previous signal should leave the deep-fading data by feedback
12 12 -0 ''[ ] [ ] ( [ 80 ] [ 1 80 ] [ 2 80 ]) (3.2) '[ ] [ ]* [ ] ''[ ] k j w n w n n j n j n j y n h n s n w n δ δ δ = = × − + − − + − − = +
∑
Figure 3-4 Removed redundant AWGN after 2 unit time
3.2.2 Convolute Pseudo Channel
Figure 3-5 Pseudo channel impulse response
At the first, we define pseudo channel for the two-ray channel. Figure 3-5 show the
pseudo channel and express as:
39 0 [ ] ( 1) [i 2 ] (3.3) i hps n δ n i = =
∑
− −If we convolute two-ray channel and pseudo channel, we can find the result which is
13 13 -39 0 [ ]* [ ] ( ( 1) [ 2 ]) * ( [ ] [ 2]) (3.4) [ ] [ 80] i i hps n h n n i n n n n δ δ δ δ δ = = − − + − = − −
∑
Figure 3-6 Convolute two-ray channel and pseudo channel
Now, convolute the receiver signal and pseudo channel, shown in Figure 3-7. And the
expression is followed as:
0 0 0 ''[ ] '[ ]* [ ] [ ]* ( [ ]* [ ]) [ ] (3.5) [ ] [ 80] [ ] [ ] [ ] [ ] y n y n hps n s n h n hps n w n s n s n w n s n p n w n = = + = − − + = − +
14
14
-3.2.3 Decision
In Figure 3-7, the rectangle show reconstruction of signal which is deep-fading by
two-ray channel. Therefore, we can decision the deep-fading signal after convolution
pseudo channel. The first, we transfer y n by FFT and express as: ''[ ]
0
''[ ] [ ] [ ] [ ] (3.6)
Y k =S k −P k +W k
Then, estimate the data we resolve by previous data, P k . Express as: [ ]
0
'[ ] ''[ ] [ ] [ ] [ ] (3.7)
S k =Y k +P k =S k +W k
3.2.4 Noise Enhance
Observation, if we don’t execute the first step, removed redundant AWGN. The result
is also Equation 3.7. But Figure 3-8 show the noise enhance on deep-fading point, 16 and
48.
15
15
-Chapter 4
Simulation results
In this chapter, to evaluate the pseudo channel algorithm, a typical OFDM system
based on IEEE802.11a Wireless LANs, TGn Sync Proposal Technical Specification is used
as the reference design platform. The performance of proposed algorithm is simulated under
two-ray channel which we defined in section 2.2 with Additive White Gaussian Noise
(AWGN).
In the simulations, the source data of transmitted length is 1024 Bytes and use the
coding rate of 3/4 and modulation of 64-QAM. Follow as Table 4-1
Parameter Value
System Platform IEEE 802.11a
Modulation 64-QAM Coding rate 3/4
PSDU length 1024 Bytes Carrier frequency 2.4 GHz
Bandwidth 20 MHz
Symbol rate 250 KHz IFFT/FFT period 3.2 sμ
GI duration 0.8 sμ
Approx. packet duration 200 sμ
16
16
-In Figure 4-1, the no algorithm method is divergence, and only the pseudo channel
algorithm is convergence on 51dB. Additional removed redundant AWGN is convergence
on 36dB, it gain 15dB. Figure 4-2 shows the SNR vs. BER. Figure 4-3 shows the SNR vs.
PER.
Figure 4-2 BER vs. SNR
And the SNR vs. CER by pseudo channel algorithm with removed redundant AWGN
on every carrier is shown in Figure 4-5. The influenced carrier decrease on about 30dB, and
it convergent on 36dB. In Figure 4-6, CER which no algorithm is 0.98 on 36dB. And the
pseudo channel with removed redundant AWGN of CER is 0.68. To observe, the expected
17
17
-Figure 4-3 PER vs. SNR
Figure 4-4 SNR vs. CER by pseudo channel algorithm
18
18
-Figure 4-5 SNR vs. CER on 36dB by pseudo channel algorithm
19
19
-Chapter 5
Conclusion and Future Work
5.1.1 Conclusion
This thesis proposes a pseudo channel method. The deep fading carrier is fading by
resonance phenomenon in two-ray channel. It is all zero value by sum of peak and trough.
And then, the ADC in receiver sample zeros on deep fading carriers.
Therefore, find the remaining energy of deep fading carriers is main ideal of the
algorithm. And we find the GI have the remaining energy, but complex with previous data.
The feedback mechanism should be used for cancelling previous data.
Although, it works to reconstruct the deep fading carriers, but the noise enhance is a
big problem. Because of total energy in GI is less than one FFT length. The SNR loss
occurs.
The removed redundant AWGN is proposed for gain SNR. And the performance gain
15dB against no removing. But there is still 23dB gap.
A common sense is up sample in ADC, and it get more non-zero values in GI on deep
20
20
-5.1.2 Future Work
The next study is enhancing performance by MIMO-OFDM system. It is simple idea
that the number of received antenna will gain the same number time of performance. But
the preliminary studying find it is better than the idea. Because of the STBC is a diversity
which changes the channel type. Therefore, the deep fading effect in two-ray channel is
21
21
-Bibliography
[1] Xiang-Gen Xia, “A New Channel Independent Precoded OFDM Systems Robust to Spectral Null Channels”, 2000 IEEE.
[2] Jian Wang, Jian Song, Zhi-Xing Yang, Lin Yang, and Jun Wang, “Frames Theoretic Analysis of Zero-Padding OFDM Over Deep Fading Wireless Channels”, 2006 IEEE.
[3] John Terry and Juha Heiskala, “OFDM Wireless LANs: A Theoretical and Practical Gide” [4] Simon R. Saunders, “Antennas and Propagation for Wireless Communication System” [5] Kaveh Pahlavan and Allen H. Levesque, “Wireless Information Networks”
[6] Tzi-Dar Chiueh and Pei-Yun Tsai, “OFDM Baseband Receiver Design for Wireless Communications”
[7] Simon Haykin and Barry Van Veen, “Signals and Systems” [8] Andrea Goldsmith, “Wireless communications”

![Figure 1-3 Two-ray channel frequency response, H k [ ]](https://thumb-ap.123doks.com/thumbv2/9libinfo/8218008.170397/12.892.325.600.223.403/figure-ray-channel-frequency-response-h-k.webp)
![Figure 1-4 Transmitted Data, [ ] S k](https://thumb-ap.123doks.com/thumbv2/9libinfo/8218008.170397/13.892.287.635.179.1075/figure-transmitted-data-s-k.webp)