Determination of Cotinine in Human Urine by
High-Performance Liquid Chromatography
YEN-HSIA WEN, PEI-SHIN YANG AND SHIHN-SHENG WU*
School of Pharmacy, College of Pharmacy, Kaohsiung Medical University, Kaohsiung, Taiwan, R.O.C.
(Received: June 19, 2008; Accepted: September 22, 2009)
ABSTRACT
A reversed-phase liquid chromatography with ultraviolet detection is described for the determination of cotinine. A mobile phase consisted of an acetate buffer with sodium octanesulfonate as an ion pair reagent and methanol was used to resolve coti-nine from theobromine, theophylline, arecoline and nicotine. Using an octadecyl-type column, a good separation was achieved in 12 min. The wavelength of UV detector was set at 260 nm. With p-nitroaniline as internal standard, human urine samples were cleaned up by liquid-liquid extraction. The regression equations obtained from both the standard and the biological samples were linear between 0.1 - 10.0 μg/mL (r > 0.999). The detection limit for cotinine is 30.0 ng/mL. The R.S.D. and R.E. of intraday and interday are less than 3.93% and 3.07%, respectively (n = 6). The recoveries are all greater than 96.44%. This method has been successfully applied to the determination of urinary cotinine content in several heavy smokers.
Key words: cotinine, HPLC, human urine
INTRODUCTION
The tobacco is one of the most commonly used recreational substance in the world(1). Cigarette smoking
increases the risk of malignant lung cancers, heart and other lung diseases(2-7). In 1999 the epidemiologists
of World Health Organization (WHO) predicted that approximately 8.4 million people would be killed annu-ally due to their tobacco usage by late 2020s(8).
Cotinine is a major metabolite of nicotine found in the urine of smokers(9). Cotinine is used to
eval-uate secondhand exposure to environmental tobacco smoke(10) and to validate smoking abstinence(11). It had
been proposed that genetic polymorphisms in nico-tine metabolism may serve as a major determinant of an individual’s health risk to smoking and their addicting behavior. Hepatic cytochrome P4502A6 (CYP2A6) isozymes are responsible for catalyzing the major route of nicotine metabolism as well as C-oxidation of cotinine, followed by hydroxylation to trans-3’-hydroxycotinine(12).
Recently, the trans-3’- hydroxycotinine/cotinine ratio has been suggested as an useful index for determination of the rate of nicotine metabolism, and as a mean to assess this CYP2A6 biomarker activity(13).
The most frequently used analytical methods for the determination of cotinine levels are high-performance liquid chromatography (HPLC)(14-17) and gas
chromatog-raphy(18-20). Other techniques such as capillary
electro-phoresis(21) and enzyme-linked immunosorbent assay(22)
have also been described. HPLC with ultraviolet (UV) detection is the most widely used analytical method, because it is more simple, economical, and widely avail-able than other techniques.
We are interested in developing a simple analytical method for determination of urinary cotinine levels because it can be easily adopted as a practical tool for assessing health risks of both smokers and secondhand smokers in Taiwan. Furthermore, this method can also be used to simultaneously determine cotinine and trans-3’-hydroxycotinine levels in urine and serves as an useful tool for the assessment of the trans-3’-hydroxylcotinine/ cotinine ratio.
According to a previously published procedure, it was not easy to achieve a complete resolution of coti-nine from caffeine by HPLC within a short period of 10 min(23). Caffeine is an ingredient in tea, coffee and
many over-the counter medicines. In addition, many people also have a habit of chewing betel nuts in Taiwan. Therefore, an analytical method which can separate those active ingredients of betel nut, tea and coffee, such as
* Author for correspondence. Tel: +886-7-3121101ext 2647; Fax: +886-7-3210683; E-mail: [email protected]
arecoline, theobromine, theophylline and caffeine, will be a useful tool to determine urinary cotinine for these people in Taiwan.
In the present study, we describe a simple HPLC method using an octadecyl-type column coupled with UV detection for determination of cotinine in human urine with liquid-liquid extraction. This method can easily resolve cotinine from theobromine, theophylline, caffeine, arecoline and nicotine in a short period of 12 min. The method has also been successfully applied to deter-mine urinary cotinine from several smokers.
MATERIALS AND METHODS
I. Reagents and Standards
All reagents used were of analytical grade and the organic solvents were of HPLC grade. Cotinine and (S)-(-)-Nicotine were purchased from Lancaster (UK). Areco-line hydrobromide was purchased from MP Biomedi-cals Inc. (Eschwege, Germany). p-Nitroaniline (internal standard; I.S.) was obtained from Merck (Darmstadt, Germany). Water, used for the preparation of mobile phase and related aqueous solution, was purified by Milli-Q from Millipore (Billerica, MA USA). Methanol (MeOH) and triethylamine (TEA) were from Tedia (Fairfield, OH USA). Caffeine, sodium 1-octanesulfonate, theobromine and theophylline were from TCI (Tokyo, Japan).
II. Apparatus and Chromatographic Conditions
The HPLC analysis was carried out on an Agilent series 1100 LC system, (Foster City, CA USA) equipped with Soma S-3702 UV-Vis detector and DataApex ClarityTM software for LC system.
Analysis was performed on an Astec octadecyl-type (250 × 4.6 mm, 5 μm) column at ambient temperature. Mobile phase consisted of an acetate buffer (containing 30.0 mM sodium acetate, 100 mM acetic acid and 10.0 mM sodium octanesulfonate as ion pair reagent) and methanol (70: 30, v/v). The flow rate was 1.0 mL/min. Injection volume was 20 μL. The eluate was monitored by absorbance at 260 nm.
III. Preparation of Stock and Working Solutions
Stock solutions of cotinine were prepared at 1 mg/mL in 30% methanolic aqueous solution for human urine anal-ysis. p-Nitroaniline was prepared at 0.2 mg/mL in 30% methanolic aqueous solution. Solutions were kept at 4°C.
Working solutions of cotinine were diluted from stock solutions with 30% methanolic aqueous solution to 0.5 µg/mL, 1.0 μg/mL, 2.0 μg/mL, 5.0 μg/mL and 10.0 μg/mL for calibration curve and to 0.8 μg/mL, 4.0 μg/mL and 8.0 μg/mL, as QC samples used for urine
analysis. p-Nitroaniline solutions were diluted with 30% methanolic aqueous solution to 1 μg/mL as internal stan-dard for biological analysis.
IV. Extraction Method
Urine samples were obtained from test individuals by collecting the first urine in the morning and were kept frozen at -20°C until assay. Each of 500 μL urine samples was added with internal standard solution (1 μg/mL). After the addition of 100 μL 10 N potassium hydroxide and 2 mL dichloromethane/n-butanol solu-tion (9: 1, v/v), the urine sample was shaken for 10 min at ambient temperature. One milliliter of inferior organic phase was evaporated to residue and was re-dissolved in 250 μL water/methanol (70: 30, v/v) solution and 20 μL was injected into HPLC for analysis.
V. Precision and Accuracy
For standard analysis, the intraday and interday assays in precision and accuracy were performed with six repli-cates for each of low (0.79 μg/mL), middle (3.98 μg/mL) and high (7.96 μg/mL) quality control samples. For biolog-ical analysis, the intraday and interday assays in precision and accuracy were run with six replicates for each of low (0.80 μg/mL), middle (4.00 μg/mL) and high (8.00 μg/mL) quality control samples.
VI. Recovery
The recovery for cotinine in human urine anal-ysis was calculated at three concentrations (0.5 μg/mL, 5.0 μg/mL, 10.0 μg/mL). The absolute recovery of coti-nine was determined by the peak area ratio of urine sample to standard solution and the relative recovery was calculated at three different concentrations (0.5 μg/mL, 5.0 μg/mL, 10.0 μg/mL) based on daily standard curve. VII. Stability
Stability of cotinine in working solutions and in urine samples (previously stored in -20°C) at room temperature were determined by the solutions and samples stayed at room temperature for 72 hours. Furthermore, stability of cotinine in urine samples at room temperature was determined by the samples stayed at room temperature for 120 hours. Stability of cotinine in spiked urine samples through freeze-thaw proce-dure was tested at low (2.0 μg/mL) and high (8.0 μg/mL) concentrations after three freeze-thaw cycles.
VIII. Selectivity
A 30% methanolic aqueous solution containing seven different chemicals (i.e. theobromine, theophylline, cotinine, caffeine, arecoline, p-nitroaniline and nicotine)
was used to validate the selectivity of the developed analytical method.
XI. Application
The samples of the first urine in the morning of six smokers were separately collected for 5 consecutive days and the urinary cotinine levels were determined. Three of these smokers have agreed to undergo another 5 days cycle and the urinary cotinine contents were analyzed for comparative purpose. The levels of cotinine were deter-mined based on the daily standard curve.
RESULTS AND DISCUSSION
I. High Performance Liquid Chromatography
The chromatograms of the extracts of urine blank and urine blank spiked with cotinine and p-nitroaniline are shown in Figure 1. The retention times of cotinine and p-nitroaniline are 6.5 and 10.9 min, respectively. An acceptable separation for cotinine and caffeine (r.t. 7.3 min) is achieved in a period of 8 min, which is faster than the method of Baranowski et al.(23), and no interference from caffeine and p-nitroaniline with cotinine was observed. II. Linearity and Limit of Quantitation
In standard analysis based on six replicates, regres-sion equations of intraday and interday analysis are Y = (1.1096 ± 0.0210) X + (0.0085 ± 0.0336) and Y = (1.1099 ± 0.0212) X + (-0.0027 ± 0.0243), respectively. The correla-tion coefficient of regression equacorrela-tion of intraday anal-ysis is 1.00 as the same as that of analanal-ysis interday equa-tion. The limit of quantitation (LOQ) was determined to be 100 ng/mL (S/N = 10, injection 20 μL).
In human urine analysis based on six replicate analyses, regression equations of intraday and interday analysis are Y = (1.0118 ± 0.0064) X + (0.0630 ± 0.0071) and Y = (1.0075 ± 0.0140) X + (0.0662 ± 0.0221), respec-tively. Both correlation coefficients of regression equa-tions are over 0.999. The LOQ was also determined to be 100 ng/mL (S/N = 10, injection 20 μL).
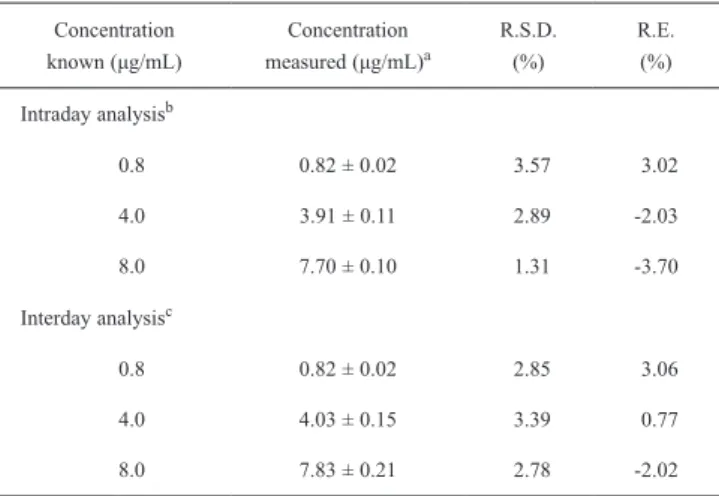
III. Accuracy and Precision
In standard analysis, the relative standard deviation (R.S.D.) and relative error (R.E.) of intraday and interday analysis were below 2.20% and 1.63% respectively (n = 6). In biological analysis, the R.S.D. and R.E. of intraday and interday were below 3.57% and 3.70% respectively (n = 6) (Table 1).
IV. Recovery
The recovery of cotinine from urine sample was measured under the extraction procedures as described above. The absolute recovery for a cotinine-spiked human urine samples was in the range of 96.44-97.42%. The relative recovery for cotinine spiked in human urine ranges from 97.06 to 100.67% (Table 2). The recovery from urine sample of this method by using a simple liquid-liquid extraction is better than the method of Doctor(15), which the average recovery from urine sample
was 88% for cotinine by a solid-phase extraction method. V. Stability
The stability of cotinine in water/methanol (70/30, v/v) solution was assessed by re-analyzing samples which were left in the autosampler at room temperature for 72 hours. Analyte concentration is stable in standard at
3.0 2.5 2.0 1.5 1.0 0.5 2 b. b. a. c. 6. 51 3 1 7. 28 0 2 10.9 27 3 4 6 8 10 12 Response (mv)
Retention time (min)
Retention time (min) 3.5 3.0 2.5 2.0 1.5 2 4 6 8 10 12 Response (mv)
Figure 1. The chromatograms of cotinine and p-nitroaniline. (A) The
chromatogram of urine blank, (B) The chromatogram of urine blank spiked with cotinine and p-nitroaniline. Peaks: a. cotinine 2 μg/mL (11.3 μM), b. caffeine, c. p-nitroaniline (I.S.) 1 μg/mL (7.2 μM).
Table 1. Precision and accuracy for the determination of cotinine
spiked in human urine Concentration known (μg/mL) Concentration measured (μg/mL)a R.S.D. (%) R.E. (%) Intraday analysisb 0.8 4.0 8.0 0.82 ± 0.02 3.91 ± 0.11 7.70 ± 0.10 3.57 2.89 1.31 3.02 -2.03 -3.70 Interday analysisc 0.8 4.0 8.0 0.82 ± 0.02 4.03 ± 0.15 7.83 ± 0.21 2.85 3.39 2.78 3.06 0.77 -2.02 a Mean ± S.D. of six replicate analyses.
b Intraday data was based on six replicate analyses.
room temperature for 72 hours. The stability of cotinine in human urine at room temperature was also estimated by urine sample of cotinine stored in a room at ambient temperature for 120 hours. No degradation was observed in the analytic samples until 120 hours.
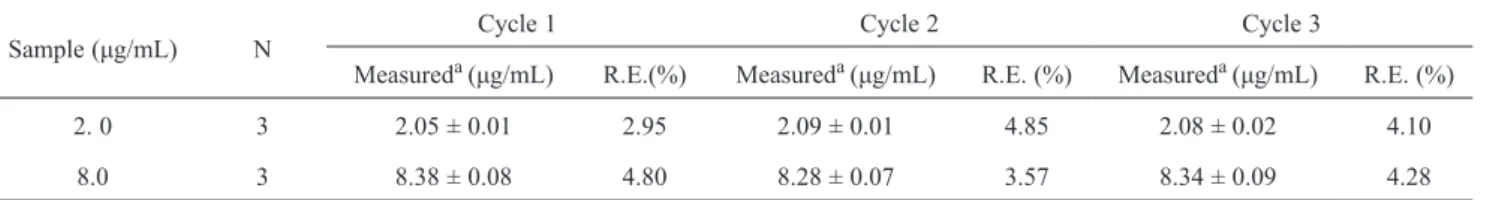
The results of stability determination of the urinary cotinine at low (2.0 μg/mL) and high (8.0 μg/mL) concen-trations after three freeze-thaw cycles are listed in Table 3. No degradation was observed in neither of the two concentrations studies.
VI. Selectivity
In Taiwan, people are commonly drinking a lot of caffeinated beverages, teas and chewing betel nuts. The method was designed to determine the urinary cotinine contents of these people. Selectivity of cotinine among those substances, such as caffeine, theobromine, theoph-ylline and arecoline must be met in this method. Figure 2 clearly demonstrated a good separation of cotinine peak with no interference from theobromine, theophyl-line, caffeine, arecoline and nicotine in the chromato-gram of a short period of time (13.5 min). In previous studies(14-17,23), theobromine, theophylline, caffeine,
arecoline and nicotine were not included to examine the selectivity of HPLC method for cotinine. With this selec-tivity, the method will be feasibly applied in Taiwan and other Southeast Asian countries.
VII. Application
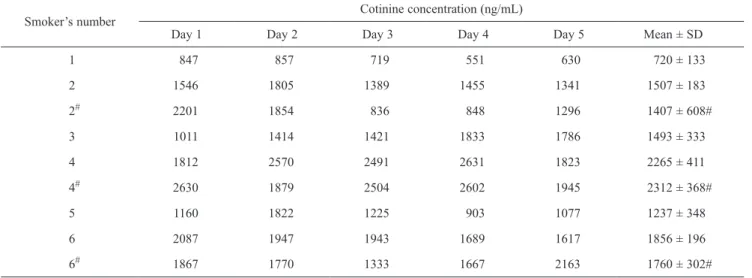
This method was applied for the determination of cotinine concentrations in urine of six male smokers for five consecutive days (Figure 3). The results are
shown in Table 4. These smokers are classified as moderate smokers with urinary cotinine concentra-tions at 500-2500 ng/mL according to the literature(24),
which defined urinary cotinine concentrations (ng/mL) at 150-500 as a light smoker, 500-2500 as a moderate smoker, and above 2500 as a heavy smoker. Without changing their life styles and habits, urine samples of three of six voluntary male smokers were analyzed once again for another 5-day period. The results indicated that mean cotinine concentrations of the urine samples taken from the same individual between the two test run differed within a small range of 47-100 ng/mL (Table 4).
CONCLUSIONS
A method using HPLC with UV detector for the
Table 3. The stability of urinary cotinine in three freeze-thaw cycles
Sample (μg/mL) N Cycle 1 Cycle 2 Cycle 3
Measureda (μg/mL) R.E.(%) Measureda (μg/mL) R.E. (%) Measureda (μg/mL) R.E. (%)
2. 0 3 2.05 ± 0.01 2.95 2.09 ± 0.01 4.85 2.08 ± 0.02 4.10
8.0 3 8.38 ± 0.08 4.80 8.28 ± 0.07 3.57 8.34 ± 0.09 4.28
a Mean ± S.D. of triplicate analyses.
Table 2. Relative recovery of cotinine in human urine
Concentration
spiked (μg/mL) measured (μg/mL)Concentration Recovery (%)a
0.5 0.48 ± 0.01 97.06
5.0 4.90 ± 0.05 98.18
10.0 10.06 ± 0.10 100.67
a Mean ± S.D. of five replicate analyses.
Figure 2. The chromatogram of some chemicals. Peaks: a.
theo-bromine, b. theophylline, c. cotinine, d. caffeine, e. arecoline, f. p-nitroaniline, g. nicotine. 3.0 2.5 2.0 1.5 1.0 0.5 0.0 2 4 6 8 10 12 Response (mv)
Retention time (min) b. a. c. d. e. f. g. 4.0 3.5 3.0 2.5 2.0 1.5 2 4 6 8 10 Response (mv)
Retention time (min) b. a. c. 6. 35 0 1 6. 99 0 2 10.2 33 3
Figure 3. The Chromatogram of a smoker’s urine. Peaks: a. cotinine,
analysis of cotinine with good selectivity has been devel-oped. The method is simple, precise and accurate with a sample prepared by liquid-liquid extraction. Because the method can well separate cotinine from theobromine, theophylline, caffeine, arecoline and nicotine, it will be suitable for determining urinary cotinine levels of the smokers and second-hand smokers in Taiwan and other Southeast Asian countries. The method has been success-fully applied to determine the urinary cotinine concen-trations of six smokers.
ACKNOWLEDGMENTS
The authors are very thankful for the support from Kaohsiung Medical University.
REFERENCES
1. Winstock, A. 2002. Areca nut-abuse liability, depen-dence and public health. Addict. Biol. 7: 133-138. 2. Barnoya, J. and Glantz, S. A. 2005. Cardiovascular
effects of secondhand smoke: nearly as large as smoking. Circulation 111: 2684-2698.
3. Zevin, S., Saunders, S., Gourlay, S. G., Jacob, P. and Benowitz, N. L. 2001. Cardiovascular effects of carbon monoxide and cigarette smoking. J. Am. Coll. Cardiol. 38: 1633-1638.
4. Bain, C., Feskanich, D., Speizer, F. E., Thun, M., Hertzmark, E., Rosner, B. A. and Colditz, G. A. 2004. Lung cancer rates in men and women with comparable histories of smoking. J. Natl. Cancer Inst. 96: 826-834. 5. Kosuke, K., Hiroyuki, N., Toshio, K., Hisanaga, Y.,
Toru, Y. and Takeshi, M. 1998. Chronological change of respiratory function in smokers with elevated serum
carcinoembryonic antigen levels. Clin. Chim. Acta 276: 179-186.
6. Svanes, C., Omenaas, E., Jarvis, D., Chinn, S., Gulsvik, A. and Burney, P. 2004. Parental smoking in childhood and adult obstructive lung disease: results from the European Community Respiratory Health Survey. Thorax 59: 274-276.
7. Xu, X. P. and Wang, L. H. 1998. Synergistic effects of air pollution and personal smoking on adult pulmonary function. Arch. Environ. Health 53: 44-53.
8. Kaufman, N. and Yach, D. 2000. Tobacco control - challenges and prospects. Bull. World Health Organ. 7: 78.
9. Neal, L. B., Peyton, J., Irving, F. and Suneel, G. 1994. Nicotine metabolic profile in man: comparison of ciga-rette smoking and transdermal nicotine. J. Pharmacol. Exp. Ther. 268: 296-303.
10. Kim, H., Lim, Y., Lee, S., Park, S., Kim, C., Hong, C. and Shin, D. 2004. Relationship between environ-mental tobacco smoke and urinary cotinine levels in passive smokers at their residence. J. Expo. Anal. Environ. Epidemiol. 14: S65-S70.
11. Shirtcliff, E. A. and Marrocco, R. T. 2003. Salivary cotinine levels in human tobacco smokers predict the attentional validity effect size during smoking absti-nence. Psychopharmacology 166: 11-18.
12. Tricker, A. R. 2003. Nicotine metabolism, human drug metabolism polymorphisms, and smoking behaviour. Toxicology 183: 151-173.
13. Dempsey, D., Tutka, P., Jacob III, P., Allen, F., Scho-edel, K., Tyndale, R. F. and Benowitz, N. L. 2004. Nicotine metabolite ratio as an index of cytochrome P450 2A6 metabolic activity. Clin. Pharmacol. Ther. 76: 64-72.
14. Markku, T. P. 1988. Assessment of exposure to envi-ronmental tobacco smoke using a high-performance
Table 4. Assay results for smokers’ urine
Smoker’s number Cotinine concentration (ng/mL)
Day 1 Day 2 Day 3 Day 4 Day 5 Mean ± SD
1 847 857 719 551 630 720 ± 133 2 1546 1805 1389 1455 1341 1507 ± 183 2# 2201 1854 836 848 1296 1407 ± 608# 3 1011 1414 1421 1833 1786 1493 ± 333 4 1812 2570 2491 2631 1823 2265 ± 411 4# 2630 1879 2504 2602 1945 2312 ± 368# 5 1160 1822 1225 903 1077 1237 ± 348 6 2087 1947 1943 1689 1617 1856 ± 196 6# 1867 1770 1333 1667 2163 1760 ± 302#
liquid chromatographic method for the simultaneous determination of nicotine and two of its metabolites in urine. J. Chromatogr. 431: 221-240.
15. Doctor, P. B., Gokani, V. N., Kulkarni, P. K., Parikh, J. R. and Saiyed, H. N. 2004. Determination of nico-tine and cotinine in tobacco harvesters’ urine by solid-phase extraction and liquid chromatography. J. Chro-matogr. B Analyt. Technol. Biomed. Life Sci. 802: 323-328.
16. Ciolino, L. A., Turner, J. A., McCauley, H. A., Small-wood, A. W. and Yi, T. Y. 1999. Optimization study for the reversed-phase ion-pair liquid chromatographic determination of nicotine in commercial tobacco prod-ucts. J. Chromatogr. A 852: 451-463.
17. Oddoze, C., Pauli, A. M. and Pastor, J. 1998. Rapid and sensitive high-performance liquid chromatographic determination of nicotine and cotinine in nonsmoker human and rat urines. J. Chromatogr. B Analyt. Technol. Biomed. Life Sci. 708: 95-101.
18. Riley, A. D. 1986. The determination of nicotine and cotinine in plasma. J. Chromatogr. Sci. 24: 134-141. 19. Javier, S. T. and Hendrikus, J. M. 2003. Simultaneous
determination of the tobacco smoke uptake parameters nicotine, cotinine and thiocyanate in urine, saliva and hair, using gas chromatography-mass spectrometry for characterization of smoking status of recently exposed subjects. Analyst 128: 838-843.
20. Insook, K., William, D. D. and Marilyn, A. H. 2005. Simultaneous determination of nicotine, cotinine, nornicotine, and trans-3’-hydroxycotinine in human oral fluid using solid phase extraction and gas chroma-tography-mass spectrometry. J. Chromatogr. B Analyt. Technol. Biomed. Life Sci. 814: 233-240.
21. Edward, E. K., Malcolm, R. C., Robert, F. S. and Lee, W. T. 2003. Determination of nicotine and its meta-bolites in urine by solid-phase extraction and sample stacking capillary electrophoresis-mass spectrometry. J. Chromatogr. B Analyt. Technol. Biomed. Life Sci. 796: 303-313.
22. Kuo, H. W., Yang, J. S. and Chiu, M. C. 2002. Deter-mination of urinary and salivary cotinine using gas and liquid chromatography and enzyme-linked immunosor-bent assy. J. Chromatogr. B Analyt. Technol. Biomed. Life Sci. 768: 297-303.
23. Baranowski, J., Pochopien, G. and Baranowska, I. 1998. Determination of nicotine, cotinine and caffeine in meconium using high-performance liquid chroma-tography. J. Chromatogr. B Biomed. Sci. Appl. 707: 317-321.
24. IBT Reference Laboratory. A reference guide to using internet source: http://www.ibtreflab.com/library/PDF/ Cotinine_rev_051106.pdf (July 3, 2006).