Kinetic and Mechanistic Studies of the Chemical Vapor Deposition of Tungsten Nitride
from Bis(Tertbutylimido)Bis(Tertbutylamido)Tungsten
Elizabeth L. Crane,† Hsin-Tien Chiu,‡ and Ralph G. Nuzzo*,†
School of Chemical Sciences and Frederick Seitz Materials Research Laboratory, UniVersity of Illinois at Urbana-Champaign, Urbana, Illinois, 61801, and Institute of Applied Chemistry, National Chiao Tung UniVersity, Hsinchu 30050, Taiwan, Republic of China
ReceiVed: September 26, 2000; In Final Form: February 7, 2001
The chemical vapor deposition (CVD) of tungsten nitride from a single source reagent, bis(tertbutylimido)-bis(tertbutylamido)tungsten ((t-BuN)2W(NHBu-t)2), is examined with particular focus placed on the mechanisms
and energetics involved in the activation and thermal decomposition of this CVD precursor. The main reactions that take place are (1) activated adsorption of the precursor, (2) hydrogen addition/exchange, leading to the evolution of tert-butylamine, (3) ligand activation via both γ-hydride activation and β-methyl elimination
processes, and (4) ligand decomposition via C-N bond rupture. The activation energies for each of these processes were examined and found to be∼30 kcal/mol for the process(es) leading to the evolution of tert-butylamine and ∼40 kcal/mol for the various reactions which lead to the fragmentation of the precursor ligands (pathways which appear to involve both C-H and C-C bond activation as well as the rupture of the ligand C-N bonds). The growth surface of the deposited film contained extensive quantities of carbon in addition to tungsten and nitrogen. The data also suggest that the growth in UHV does not yield a stable bulk nitride phase. Rather, it was found that the nitrogen appears to be present at levels consistent with the formation of a solid solution and that annealing to 700 K results in the loss of the nitrogen from the bulk film (as N2).
Introduction
Tungsten nitride has demonstrated significant utility, most notably as a material for use in microelectronics fabrication. Its proposed applications include use as a top electrode for capacitors in advanced dynamic random access memories,1as
a Schottky contact to GaAs,2-5 and as an adhesive layer for
blanket tungsten deposition.6The predominant use of W xN in
technology, though, is as a diffusion barrier material for ULSI devices.6-23 For such applications, it is desirable to have
materials with low resistivities and microstructures that prevent the interdiffusion of other layers in the device. Furthermore, the barrier layer material must be thermally stable in order to withstand the deposition and processing temperatures necessary for device fabrication.12,24,25 Metal nitrides are particularly
attractive toward this end because they tend to be chemically stable, can be highly conductive, and exhibit high hardness and melting points.26-28
Currently, titanium nitride is the predominant barrier material used for the metallization levels of ULSI devices. The growth of this material has several complications that have, in part, stimulated interest in tungsten nitride as a potential substitute. First, high-quality TiN is commonly deposited by sputtering techniques. Because of the nature of this latter deposition technique, this can lead to poor surface coverage of high aspect ratio features such as contact plugs and vias due to shadow-ing.6,29-33While CVD methods can obviate this limitation, it
remains that the growth of TiN generally yields an underdense, mixed (111/002) texture in the film.34,35 Such structures
adversely impact the stability of the metallization levels of the device. It has recently been shown, however, that dense, fully (111)-textured TiN thin films can be obtained using a reactive magnetron sputtering method.36
Tungsten nitride is a suitable replacement for TiN as a ULSI barrier layer material,6-23one that can be deposited readily by
both thermal and plasma-enhanced chemical vapor deposition processes. Its growth by these means generally favors a (111) orientation and dense columnar texture.6Because W
xN is a
low-diffusivity material that does not react with copper,11,37it holds
great promise for use as a diffusion barrier with this modern metallization scheme.
Plasma-enhanced chemical vapor deposition (PECVD) is a highly studied means for depositing WxN (particularly W2N)
onto surfaces.5,6,8,9,11,13-16,21-23This method gives highly
con-formal films6even at relatively low deposition temperatures (573
K). The resultant W2N film is stable to temperatures exceeding
673 K and shows the low resistivity needed for use as a barrier material.11 Despite these promising results, there are process
issues that make the search for alternatives to PECVD necessary. The two main gas mixtures used for the PECVD of WxN are
WF6/NH3/H25,6,8,14,15,21-23 and WF6/N2/H2.9,11,13,16
Disadvan-tages of the former include the potential for gas phase particle formation, specifically an NH4F salt. Using the latter gas mixture
can alleviate this problem, but problems still exist with transport and handling of WF6 because this fluorinated compound is
highly reactive.9Fluorine also diffuses rapidly into copper and
thus can be incorporated if used in conjunction with copper metallization.
With these issues as a motivation, we undertook a funda-mental investigation of metal-organic chemical vapor deposition (MOCVD) using a unique single-source precursor as a means of forming WxN barrier layers. The objectives of this study were * Corresponding author. E-mail: [email protected]. Phone:
217-244-0809. FAX: 217-244-2278.
†University of Illinois at Urbana-Champaign. ‡National Chiao Tung University.
10.1021/jp003490q CCC: $20.00 © 2001 American Chemical Society Published on Web 04/07/2001
to examine the mechanisms and energetics of the processes involved in the deposition of WxN from the single-source
precursor bis(tertbutylimido)bis(tertbutylamido)tungsten, (t-BuN)2W(NHBu-t)2. This UHV study extends understandings
gained in earlier investigations of this CVD reagent.7 The
mechanisms elucidated in this work should make it possible to engineer processes for the CVD of WxN that could further lower
the deposition temperature and ultimately enhance film purity. Experimental Section
The experiments were performed in a UHV chamber that has been described previously.38The vacuum chamber has a base
pressure of e3 × 10-10 Torr. It is pumped with a liquid-nitrogen-trapped 10-in. diffusion pump (5000 L/s) and equipped with two quadrupole mass spectrometers, each shrouded and differentially pumped with 30 L/s ion pumps. A single-pass cylindrical mirror with a conical electron gun (PHI) was used to examine the surface composition of the sample by Auger electron spectroscopy (AES). An ion gun (PHI) was used for sputtering the sample with Ar+ions. The pressures cited here, monitored with a UHV ionization gauge, are not corrected for sensitivity, and the reported adsorbate exposures are therefore only approximate.
The exposures were made using an effusive molecular beam with a 200µm source aperture. The sample surface was held
less than 1 cm from the source. For the reactive scattering experiments, the sample was also positioned within 5 mm of the mass spectrometer skimmer during the experimental process. The backing pressure behind the dosing aperture was monitored via a capacitance manometer (MKS, 1 Torr full scale). The typical backing pressures were 7-12 mTorr when the precursor was held at ∼333 K. Before dosing, the headspace in the precursor reservoir was evacuated with a turbomolecular pump (520 L/s) to remove any volatile species that might have accumulated owing to the decomposition of the precursor.
The experiments were performed on a 0.25 mm thick platinum foil spot-welded to the button heater. The surface of this foil was coated with a thin film of WxN by exposing it to
a flux of the precursor (∼6.36 × 10¹⁴molecules/cm2s) for∼120
min while holding the temperature of the substrate at 850 K. The temperature of the sample was controlled with a Eurotherm temperature controller and monitored with a chromel-alumel thermocouple spot-welded to the foil. The sample could be cooled and heated through a temperature range of 90-950 K. The typical heating rates used were between 2 and 4 K/s.
The (t-BuN)2W(NHBu-t)2 was prepared according to a
published procedure and stored in a dry oxygen-free environ-ment prior to use.39
Results
To study the growth mechanism of WxN thin films deposited
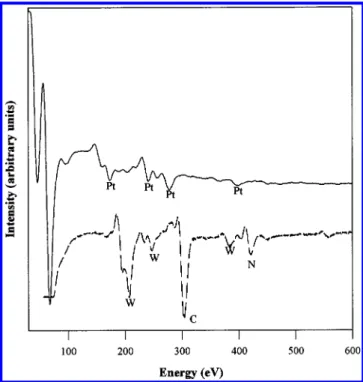
under steady-state conditions, we covered the platinum foil first with a thick layer of the material via the thermolysis of (t-BuN)2W(NHBu-t)2(see experimental details section). Figure
1 shows the Auger electron spectra (AES) of the clean platinum surface (Figure 1, solid line) and the surface covered with a thick layer of the WxN as deposited from the precursor (Figure
1, dashed line). Because no platinum transitions are seen by AES, the thickness of the deposited layer must be greater than ∼20 Å. The amount of nitrogen seen is not sufficient to accommodate any known stoichiometric WxN phase. Rather, it
suggests the nitrogen is likely present as a solid solution or metal-nitride precipitate in the tungsten. The quantities of N and C present on the growth surface depend very sensitively
on the temperature at which the exposure is carried out. Figure 2 shows the percentage of tungsten (b), carbon (9), and nitrogen (1) on the surface after a 2 min deposition (∼1500 θsat) carried
out at the indicated temperature, followed by 4 min of annealing at that same temperature. We see that at 300 K, the carbon far outweighs the other constituents (presumably due to the presence of ligand derived species). At higher temperatures, we begin to see increasing nitrogen coverages (relative to that of carbon), which suggests that a ligand decomposition pathway has become activated. At all temperatures, however, we see that there is a significant amount of carbon resident on the growth surface in addition to the desired tungsten and nitrogen. AES data followed after sputtering show that this impurity is found throughout the
Figure 1. Auger electron spectra of the clean platinum substrate (solid
line) and a surface covered with a CVD layer derived from (t-BuN)2 W-(t-BuNH)2.
Figure 2. Percentages of tungsten(b), carbon (9), and nitrogen(1)
present after an exposure of∼30 θsatat various temperatures, as deduced from AES data.
depth of the deposited layer. TPRS data presented below demonstrate that the thermal decomposition of the precursor does lead to the evolution of organic species into the gas phase. This process must involve significant partitioning along path-ways that lead to the carbon contamination seen here. These data also implicitly establish that the thermal reactions (at least under UHV conditions) lead to a deposit that is depleted in nitrogen from the levels expected for a known stable phase such as W2N. We defer further comment on this point until later.
Kinetic studies reveal the nature of the mechanisms involved in the thermal decomposition of the tungsten amido precursor, and these results are presented in two parts. We first present the results obtained from TPRS studies. These data reveal the nature of the volatile products obtained from the thermolysis of the precursor’s ligands. Second, the global kinetics of the deposition process are examined by reactive molecular beam-surface scattering. Taken together, these two techniques allow us to draw conclusions about the energetics of the deposition process, the reaction steps involved, and the subsequent compositional evolution of the WxN derived from the
thermoly-sis of (t-BuN)2W(NHBu-t)2.
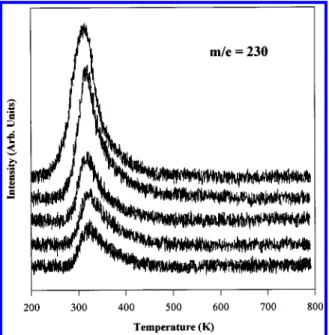
The data in Figure 3 show the m/e ) 230 TPR spectra measured for increasing exposures of the precursor (θ )
∼1-30θsat) on a lightly sputtered WxN covered substrate. This mass
corresponds to a tungsten-containing fragment. The trace shows a line shape consistent with the molecular desorption of (t-BuN)2W(NHBu-t)2.
The data presented in Figure 4 follow the desorption of other representative masses, ones corresponding to H2(m/e ) 2), CH4
and NH2(m/e ) 16), CH3CN (m/e ) 41), isobutylene (m/e )
56), and t-BuNH2(m/e ) 58). (Previous studies in which the
effluent of a CVD reactor was trapped have identified t-BuNH2,
isobutylene, and acetonitrile as being among the reaction products formed10.) Also recorded were desorption profiles
measured at m/e ) 17 (NH3), 14 (N and CH2), and 40 (CH2
-CN). These latter profiles did not reveal features that differed significantly from the representative behaviors illustrated by the data given in Figure 4. The data shown in Figure 3 provide a critical benchmark against which to judge these data. We see, for example, in the m/e ) 58 trace shown in Figure 4, a peak maximum that is significantly higher in temperature than that
of the molecular desorption state. This strongly suggests that this intensity, at this coverage, does not report on the desorption of the molecular precursor. At higher coverages, however, such overlap is seen. We therefore conclude that the higher-temperature portion of the m/e ) 58 profile is due to the desorption of a strongly adsorbed tert-butylamine fragment. We believe this desorption process is reaction-limited on the basis of inferential reasoning (see below). As noted above, the precursor flux contains some quantities of a tert-butylamine impurity. This contaminant can be detected in the TPRS data at higher exposures and contributes to desorption intensity seen at temperatures below∼200 K (i.e., it is weakly bound on the growth surface). The data thus suggest that other issues limit its desorption at∼400 K; we that assume this is either a ligand disproportionation or a N-H bond activation step in a chemi-sorbed fragment as outlined in Scheme 1.
The lower four traces in Figure 4 show significant overlapping of the desorption waveforms. Qualitatively, though, they seem to show at least three different peak positions. Most of the masses followed will be ionization fragments of several different desorbants, and we expect, therefore, significant overlapping in the resultant traces. The m/e ) 56 trace, which we believe corresponds to an isobutylene fragment (an ion common to isobutylene and t-butylamine, as examples), shows a peak maximum near 550 K. The m/e ) 41 channel (a fragment of both isobutylene and acetonitrile) shows a desorption centered closer to 600 K. The m/e ) 16 desorption shows a peak centered around 575 K; with higher coverages, this peak broadens significantly, probably due to the concurrent desorption of several species (when measured at m/e ) 17, a fragment corresponding to NH3, the peak desorption temperature is
centered at∼600 K). Finally, we see a weak desorption feature
Figure 3. TPR spectra of the m/e ) 230 fragment of (t-BuN)2 W(t-BuNH)2: exposures range from∼1 θsat(bottom) to∼30 θsat(top).
Figure 4. TPR spectra of the indicated masses: exposures were∼4
for H2(m/e ) 2) at ∼650 K. This feature does not directly
correspond to the desorption of any other fragment, and therefore, we assign it to a H2 recombination resulting from
the surface hydrogen generated via a variety of C-H (and possibly N-H) bond activation processes. These processes, which we defer discussion of to later in the paper, are sketched qualitatively in Schemes 1 and 2 (the state of the metal nitrogen bonding is not known and the structures shown are merely schematic representations of species that could be present).
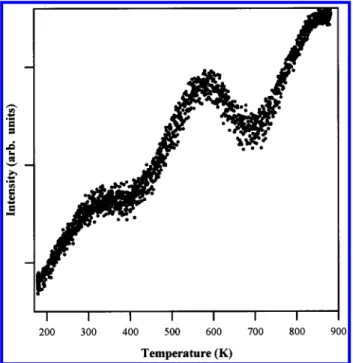
Figure 5 shows the TPR spectrum measured following the m/e ) 28 channel, which corresponds to the desorption of N2
(and possibly also of C2H4). This trace has a very complex
background and shows apparent peaks at∼300 and 600 K (thus,
mirroring those seen in the other desorption spectra presented above). The most prominent feature of this desorption profile by far, however, is the rising baselinesparticularly as seen above 700 K. This latter feature results from the formation and subsequent desorption of N2derived from N diffusing out of
the bulk deposited WxN layer. Such behavior has been observed
earlier by a number of researchers studying the W + N system.40-44
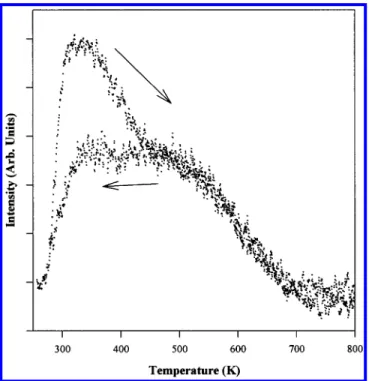
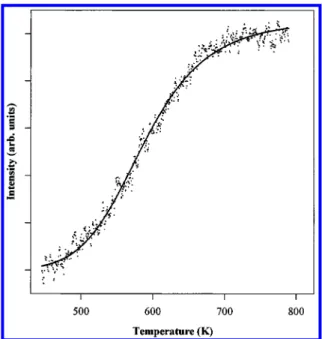
Further insights into the reaction mechanism can be gained from reactive molecular beam-surface scattering studies, the results from which we now consider. These experiments were performed by directing a constant flux of the CVD precursor, (t-BuN)2W(NHBu-t)2, toward the sample surface through a 200 µm pinhole doser held at close range (<1 cm) in order to
maximize the number of molecules that collide with the surface. We record the output from the mass spectrometer, which is also held <5 mm from the sample surface, while simultaneously raising and then lowering the temperature at a constant rate (4 K/s in our measurements). In this way, we can record the change in the intensity of scattered species and, from the temperature dependencies of their intensity, determine the reaction energetics. Figure 6 shows the reactive scattering profile recorded for a tungsten containing fragment (m/e ) 230; the arrows show the direction of the temperature ramp). At lower temperatures, we see a molecular desorption feature during the increasing temperature ramp resulting from the loss of the adsorbate that condenses on the crystal during the time it is held at low temperature. We see that the scattering intensity decreases sharply at∼500 K, indicating that the molecules begin to react with appreciable rates at approximately this temperature. This result is in agreement with the TPRS data, which show the desorption of ligand-derived fragments in this same temperature range. The profile becomes flat again after∼700 K, indicating that the reaction is flux limited above that temperature.
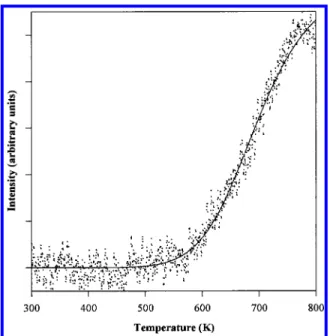
Another representative behavior is illustrated by the data shown in Figure 7, which traces m/e ) 40, an ionization cracking fragment of both isobutylene and acetonitrile (both of these compounds have been identified as reaction products in earlier studies10). We see that the intensity measured in this channel
rises significantly beginning at∼550 K and, as before, becomes SCHEME 1
SCHEME 2
Figure 5. TPR spectrum of m/e ) 28: the exposure to (t-BuN)2 W-(t-BuNH)2was∼2 θsat.
flux-limited by∼700 K. Considerable hysteresis is seen in the traces measured during the heating and cooling cycles. While this behavior is not completely understood, it does appear to correlate with the nitrogen depletion which results from the desorption of N2at the upper limits of the temperature range
studied.
In the following section, we will demonstrate how the scattering profiles can be fit to estimate the energetics associated with the deposition process.
Discussion
The products observed in the TPRS studies suggest three main reactions that the (t-BuN)2W(NHBu-t)2may undergo after it is
accommodated on the surface. These reactions are essentially
the same ones proposed by Chiu and Chuang.10They are the
loss of a tert-butylamine group,γ-hydride activation which leads
to the desorption of isobutylene, and a complex β-methyl
activation process leading to the desorption of acetonitrile. Scheme 2 summarizes these reactions. The TPR data allow us to determine which of the reactions plays a dominant role in the reactive interaction of (t-BuN)2W(t-BuNH)2with the surface
and to determine the energetics of the thermal pathways which lead to its decomposition.
The first reaction, monitored by observing the m/e ) 58 channel, occurs at a reasonably low temperature. We therefore assume that it involves the cleavage of one of the W-N single bonds of the precursor. As mentioned earlier, this reaction is likely to have a fairly low activation energy, judging from the facility of the dissociation of the bulk (t-BuN)2W(NHBu-t)2
sample. The data do not let us untangle the details of the process that generates this tert-butylamine product. It seems likely, though, that a disproportionation reaction (perhaps surface mediated) of the N-H bonds of the precursor may be involved (see Scheme 1).
The nature of the thermolytic reactions can be inferred by looking at the desorption traces for m/e) 56 (the isobutylene fragment) as well as m/e ) 41, 40, and 16 (which are also ionization cracking fragments of the isobutylene). As shown in the scheme, C-H bond activation is expected to lead to this product. A third and more complex reaction is believed to lead to the formation of acetonitrile (which can be measured at m/e ) 41, concurrent with the isobutylene). The m/e ) 41 line shape is broader than that seen in the m/e ) 56 data, and we believe it likely convolves several overlapping peaks due to different desorption processes. We expect, therefore, that theβ-methyl
activation process is also a competing reaction pathway. The activation energy of this reaction is slightly higher (judging simply from the position of the peak desorption temperatures seen in TPRS) than that for theγ-hydride activation reaction.
As noted above, the broadening of the m/e ) 16 desorption profile at higher surface coverages suggests that theβ-methyl
elimination reaction leading to the formation of acetonitrile takes place to some extent (although we believe it is a minor reaction pathway). The m/e ) 16 intensity seen at higher temperatures (T g 600 K) is likely due, in part, to the desorption of methane resulting from significant degradation of the ligands via C-C and C-H bond activation processes. The copious amounts of carbon left on the surface (as seen by AES) supports a model of the reaction involving significant thermal degradation of the ligand structures.
The final reaction process examined, that of hydrogen desorption, takes place at what appears at first glance to be a uniquely high temperature among the various desorption profiles measured. Undoubtedly, part of that hydrogen results from the recombination processes that accompany the extensive ligand degradation noted by AES. It should be recalled, however, that N2evolution also occurs in this temperature range, and for this
reason, we cannot rule out processes involving transport from subsurface binding sites. We now consider the energetics for these processes. We start with the construction of a model that accommodates the evident mass balances of the competing reaction pathways.
In the reactions of interest here, complex patterns of product partitioning are seen clearly in the data. In instances such as this, kinetic modeling cannot yield a strictly deterministic evaluation of the energetics of the processes involved. Typically, this type of information is most easily obtained from inter-pretations of TPRS data, such as those from analyses of the
Figure 6. Reactive scattering profile of m/e ) 230. The arrows indicate
whether the temperature was increasing or decreasing during the data collection.
Figure 7. Reactive scattering profile for m/e ) 40. The arrows indicate
whether the temperature was increasing or decreasing during the data collection.
temperatures of desorption peak maxima or qualitative aspects of a line shape. The nonideality and coverage dependence of the TPRS data strongly suggest that simple analyses of this sort likely will be subject to gross errors. Modeling reactive scattering line shapes, an alternative procedure that fits the instantaneous reaction rate measured for a constant flux at many independent temperatures, provides a more constrained math-ematical formalism for evaluating these kinetic parameters and their corresponding energetics (in particular, these analyses more sensitively bound estimates of the exponential contributions to the temperature dependence of the reaction rate). These constraints thus serve to enable a more stiffly determined set of qualitative correlations between the relative energetics of a set of competing reaction pathways. With this understanding, we proceed with a kinetic analysis based on the scattering studies performed.
We first consider the process by which (t-BuN)2 W(NHBu-t)2reacts on the surface to form products. We assume in the
scattering experiment that we have two major competing pathways that the molecules impinging on the surface can follow, one in which the molecular species chemisorbs (and/or reacts to form products) and a second in which the precursor desorbs without producing a product. To construct the model, we assume that the energetic parameters are independent of surface coverage (admittedly, a very crude approximation) and that the formation of the strong adsorption state is characterized by a finite sticking probability, s.
The processes that describe the reversible adsorption and subsequent decomposition of the precursor can be written as
Equation 1 is a simple accommodation/adsorption/desorption process. Equation 2 is simplified to represent just one product producing process when, in reality, it is likely that there are several possible reaction pathways along which it partitions. This will be discussed further in the analysis of the product scattering profiles that follows.
These three processes will have the following reaction rates:
whereσ is the flux of (t-BuN)2W(NHBu-t)2, s is the sticking
probability of the molecular precursor at an open site,θTis the fractional surface coverage of (t-BuN)2W(NHBu-t)2, A is the
Arrhenius preexponential factor for the reaction (to produce products), B is the Arrhenius preexponential factor for the desorption process, EAand EB are the activation energies for
these processes, respectively, R is the gas constant, T is the temperature, and ns is the number of adsorbed (t-BuN)2
W-(NHBu-t)2 molecules per unit area at saturation.38,45 If we
assume a Langmuirian model, then the number of molecules adsorbed should equal the number that react or desorb. From
these assumptions, it follows that
Solving for the surface coverage, one obtains
Therefore, the reaction rate for the molecular channel (m/e ) 230) can be written as
To simplify the treatment of the data, we assume that the sticking probability of the precursor is large and thus close to unity (an error in this term would simply serve to scale the magnitude of the preexponential term estimated from the fit). We estimate the flux of (t-BuN)2W(NHBu-t)2,σ, reaching our
sample from the size of the doser and the pressure on either side it;46this value is approximately 6.4× 10¹⁴molecules/cm2s.
We can also estimate from the lattice parameters of the precursor (a ) 10 Å and b ) 18 Å39) that the surface coverage at
saturation, ns, is∼5.1 × 10¹³molecules/cm2. The data in Figure
6 are normalized and inverted to depict a reaction rate rather than the loss of scattered intensity. The data can then be fit well to eq 8, the results for which (for descending temperature) are shown in Figure 8. From the fit, we find an activation energy for the product forming reaction, EA, to be ∼33 kcal/mol. It
should be noted explicitly that a convergent fit requires the contributions of a reversible process along the decomposition pathway. The activation energy for the desorption process, EB,
is estimated to be ∼21 kcal/mol, a value consistent with the vapor pressure of the parent compound. The preexponential factors, A and B, associated with this best fit are 7.0 × 10¹³
and 3.3× 10¹⁰s-1, respectively. The preexponential factor for
the product forming reaction is close to the “normal” value for a first-order reaction of 1 × 10¹³ s-1.47 The corresponding
preexponential factor for the molecular desorption step is lower (t-BuN)2W(NHBu-t)2+ surface site {\}k1
k-1
(t-BuN)2W(NHBu-t)2* (1) (t-BuN)2W(NHBu-t)2* 98k2 products (2)
molecular adsorption rate )σs(1 - θT) (3) reaction rate ) AθTnse-EA/RT (4) molecular desorption rate ) BθTnse
-EB/RT (5)
Figure 8. Functional fit of the m/e ) 230 scattering profile. The data
were normalized to one and inverted to depict the reaction rate rather than the rate of loss of scattered intensity as shown in Figure 6.
σs(1 - θT) ) AθTnse-EA/RT+ BθTnse-EB/RT (6) θT)
(
Ans σse -EA/RT+Bns σse -EB/RT+ 1)
-1 (7) reaction rate ) Anse -EA/RT(
Ans σse -EA/RT+Bns σse -EB/RT+ 1)
(8)than that expected for a simple coverage insensitive first-order rate process. The activation energies are, however, in good agreement with activation energies one expects based on a Redhead model analysis of appropriate peak maxima seen in the TPRS data, assuming a first-order desorption process.47For
example, the m/e ) 58 TPRS product (tracking a tert-butylamine species) desorbs at approximately 400 K, and from this we predict a desorption energy of ∼30 kcal/mol. The high-temperature desorption features, however, do not follow these simple correlations. It is likely that the fit of this scattering curve does not incorporate enough parameters to effectively model all the reactions involved in the film growth, only those leading to a reduction in the m/e ) 230 molecular scattering intensity. Even so, it does reasonably account for the energetics associated with the disproportionation of the precursor’s ligand shell, a process that evidently generates tert-butylamine as one of several volatile products. This issue is discussed in more detail later. We turn now to fit a product scattering profile that more directly tracks the processes leading to the film growth and evolution. On the basis of the TPRS data, the m/e ) 40 data appear to track most sensitively the high-temperature reactions occurring in this system and thus should mirror those which kinetically limit the film growth. Figure 9 shows the fit to the m/e ) 40 scattering profile. The equation used to model these data by necessity differs from the one we used for the full molecular scattering waveform. In this case, since the mass originates from the decomposition and subsequent desorption of a chemisorbed fragment, it is not be necessary to account for a reversible formation process. Therefore, we use a simplified equation based on effective chemisorption and subsequent reaction events.38,45
Again, we assume Langmuir adsorption kinetics and Arrhenius behavior in the temperature dependencies. On the basis of these assumptions, the rate of m/e ) 40 production is given by
In this case, C is the Arrhenius preexponential factor associated with the product forming pathway, EC is the corresponding
activation energy,σ is the flux of (t-BuN)2W(NHBu-t)2to the
crystal, nsis the coverage of chemisorbed fragments, which we
model as a scaled linear function of the number of (t-BuN)2
W-(NHBu-t)2molecules adsorbed per unit area, s is the sticking
probability, R is the gas constant, and T is the temperature. Since neither the flux nor the adsorption density have changed,σ and nswill have the same values as before (6.4× 10¹⁴molecules/
cm2s and 5.1× 10¹³molecules/cm2, respectively). Fitting the
equation provides an activation energy, EC, of 43 kcal/mol and
a preexponential factor of 7.0× 10¹³s-1. Again, the
preexpo-nential factor is close to what we would expect for a first-order process. The activation energy is also close to what we would predict from TPRS data for a peak maximum temperature of 575 K (this would give an activation energy of∼40 kcal/mol).47
We should note that, at this crude level of analysis, it is not possible to distinguish between the minute differences in the
γ-hydrogen and the β-methyl activation reactions that contribute
to this reactive scattering waveform. We simply note that, while the broader body of data suggest that multiple pathways operate here, their energy differences and weighting must be such as to preclude the evaluation of more than a single exponential contribution to the temperature dependence of the reaction rate. As noted above, the m/e ) 40 scattering data show consider-able hysteresis. Previous studies using (t-BuN)2W(NHBu-t)2
demonstrated that higher deposition temperatures gave higher W/N ratios.10Also, it is recognized that a W/N ratio of 2 is the
most thermally stable of the tungsten nitrides. Our samples, however, seem-to-have ratios far greater than 2 (as seen in the AES studies), a result which strongly correlates with the direct observation that the nitrogen is being released from the bulk upon heating.
Schemes 1 and 2 present summaries of the reactions occurring on the surface during the MOCVD process suggested by the data obtained in this study. We see that significant amounts of carbon are left on the surface, probably due to incomplete ligand reactions and the methyl elimination process. The tungsten nitride-producing pathway (paradoxically given the thermal stability of the product phase) is favored at higher deposition temperatures. A complex series of reactions contribute to this deposition process. We should also note that the data suggest that the reagent appears to be thermally labile. Its collisions with the surface can lead to the loss of starting material (with the production of tert-butylamine), albeit in a way that does not necessarily seem to correlate directly with film growth. A ligand disproportionation reaction (as shown below) may account for this latter behavior.
The fate of the reactive imido species postulated in this scheme has not been established. The data do appear to compel an interpretation (based on consideration of mass action, see above) in which the compound is lost as a product desorbing into the gas phase. Such species are in fact known in closely related osmium and rhenium systems;48,49a further, albeit less
explicit, analogy is found in the work of Cummins et al. on the activity of homogeneous molybdenum amido complexes as reagents for the low-temperature cleavage of N2triple bonds.50
The reactions limiting the growth thus appear to be ones more directly related to the rupture of surface-bound amido/imido ligand structures. These processes involve the cleavage of the
Figure 9. Functional fit of the m/e ) 40 scattering profile. The data
were normalized to one.
ν ) Cnse -EC/RT Cns σse -EC/RT+ 1 (9)
C-N bond and significant activation of both C-C and C-H bonds in the chemisorbed fragments. The energies required to activate these latter pathways are sufficiently large as to compete with nitrogen extrusion. The growth of a stoichiometric W2N
phase would thus appear to require the use of a secondary reactant gas (e.g., N2or NH3) to maintain the stoichiometry of
the film.
Acknowledgment. We thank the National Science Founda-tion (CHE 96-26871) for their generous support of this work and the Department of Energy via the Seitz Materials Research Laboratory (DEFG02-91ER45439). H.-T. Chiu would like to thank the National Science Council of Taiwan, R. O. C., for the travel funds.
References and Notes
(1) Matsuhashi, H.; Nishikawa, S. Jpn. J. Appl. Phys., Part 1 1994, 33, 1293-1297.
(2) Lee, C. W.; Kim, Y. T. Solid-State Electron. 1995, 38, 679-682. (3) Mun, J. K.; Lim, J. W.; Lee, J. J.; Yang, J. W. Microelectron. Reliability 1999, 39, 1793-1800.
(4) Claflin, B.; Binger, M.; Lucovsky, G. J. Vac. Sci. Technol., A 1998, 16, 1757-1761.
(5) Meunier, C.; Monteil, C.; Savall, C.; Plamino, F.; Weber, J.; Berjoan, R.; Durand, J. Appl. Surf. Sci. 1998, 125, 313-320.
(6) Marcus, S. D.; Foster, R. F. Thin Solid Films 1993, 236, 330-333.
(7) Tsai, M. H.; Sun, S. C.; Chiu, H. T.; Chuang, S. H. Appl. Phys. Lett. 1996, 68, 1412-1414.
(8) Lee, C. W.; Kim, Y. T.; Lee, C.; Lee, J. Y.; Min, S.-K.; Park, Y. W. J. Vac. Sci. Technol., B 1994, 12, 69-72.
(9) Kelsey, J. E.; Goldberg, C.; Nuesca, G.; Peterson, G.; Kaloyeros, A. E.; Arkles, B. J. Vac. Sci. Technol., B 1999, 17, 1101-1104.
(10) Chiu, H.-T.; Chuang, S.-H. J. Mater. Res. 1993, 8, 1353-1360. (11) Ganguli, S.; Chen, L.; Levine, T.; Zheng, B.; Chang, M. J. Vac. Sci. Technol., B 2000, 18, 237-241.
(12) Gokce, O. H.; Amin, S.; Ravindra, N. M.; Szostak, D. J.; Paff, R. J.; Fleming, J. G.; Galewski, C. J.; Shallenberger, J.; Eby, R. Thin Solid Films 1999, 353, 149-156.
(13) Li, H.; Jin, S.; Bender, H.; Lanckmans, F.; Heyvaert, I.; Maex, K.; Froyen, L. J. Vac. Sci. Technol., B 2000, 18, 242-251.
(14) Lin, J.; Tsukune, A.; Suzuki, T.; Yamada, M. J. Vac. Sci. Technol., A 1999, 17, 936-938.
(15) Fleming, J. G.; Osmun-Roherty, E.; Smith, P. M.; Custer, J. S.; Kim, Y.-D.; Kacsich, T.; Nicolet, M.-A.; Galewski, C. J. Thin Solid Films 1998, 320, 10-14.
(16) Lai, K. K.; Mak, A. W.; Wendling, T. P. H. F.; Jian, P.; Hathcock, B. Thin Solid Films 1998, 332, 329-334.
(17) Lin, J.; Tsukune, A.; Suzuki, T.; Yamada, M. J. Vac. Sci. Technol., A 1998, 16, 611-614.
(18) Lee, C. W.; Kim, Y. T.; Lee, J. Y. Appl. Phys. Lett. 1994, 64, 619-621.
(19) Lee, C. W.; Kim, Y. T. Appl. Phys. Lett. 1994, 65, 965-967. (20) Chang, K.-M.; Yeh, T.-H.; Deng, I.-C. J. Appl. Phys. 1997, 81, 3670-3676.
(21) Park, B. L.; Ko, K.-H.; Kim, Y. S.; Ha, J. M.; Park, Y. W.; Lee, S. I.; Lee, H.-D.; Lee, M. B.; Chung, U. I.; Koh, Y. B.; Lee, M. Y. J. Electron. Mater. 1997, 25, L1-L5.
(22) Kim, Y. T.; Lee, C. W. J. Appl. Phys. 1994, 76, 542-545. (23) Kim, Y. T.; Lee, C. W.; Min, S.-K. Jpn. J. Appl. Phys. 1993, 32, 6126-6131.
(24) Nicolet, M.-A. In Tungsten and Other Refractory Metals for VLSI Applications II; Broadbent, E. K., Ed.; MRS Publishers: Pittsburgh, PA, 1987; pp 19-26.
(25) Wittmer, M. Thin Solid Films 1983, 107, 99-110.
(26) Ensinger, W.; Kiuchi, M. Surf. Coat. Technol. 1996, 84, 425-428.
(27) Toth, L. E. Transition Metal Carbides and Nitrides; Academic Press: New York, 1971.
(28) Weil, K. S.; Kim, J. Y.; Kumta, P. N. Mater. Lett. 1999, 39, 292-297.
(29) Travis, E. O.; Paulson, W. M.; Pintchovski, F.; Boeck, B.; Parrillo, L. C.; Kottke, M. L.; Fu, K.-Y.; Rice Jr., M. J.; Price, J. B.; Eichman, E. C. Proc. Int. Electron DeVices Meeting, December 1990; IEEE: New York, 1990; pp 47-50.
(30) Hillman, J. T.; Triggs, W. M.; Rice, M. J., Jr.; Sommer, B.; Chruley, M.; Bell, C. In AdVanced Metallization for ULSI Applications; Eichman, E. C., Rana, V.; Joshi, R., Eds. Materials Research Society: Pittsburgh, PA, 1992; pp 311-317.
(31) Hillman, J. T.; Studiner, D. W. IMIC VLSI MultileVel Intercon-nection Conference Proceedings; Wade, T. E., Eds.; IMIC: New York, 1992; p 295.
(32) Rocke, M.; Schneegans, M. J. Vac. Sci. Technol., B 1988, 6, 1113. (33) Ting, C. Y. J. Vac. Sci. Technol. 1982, 21, 14.
(34) Hong, Q. Z.; Jeng, S. P.; Havemann, R. H.; Tsai, H. L.; Liu, H. Y. J. Appl. Phys. 1995, 78, 7419-7421.
(35) Hashimoto, K.; Onoda, H. Appl. Phys. Lett. 1989, 10, 120-122. (36) Chun, J.-S.; Petrov, I.; Greene, J. E. J. Appl. Phys. 1999, 86, 3633-3641.
(37) Wang, S.-Q. MRS Bull. 1994, 19, 30.
(38) Bent, B. E.; Nuzzo, R. G.; Dubois, L. H. J. Am. Chem. Soc. 1989, 111, 1634-1644.
(39) Nugent, W. A.; Harlow, R. L. Inorg. Chem. 1980, 19, 777. (40) Lee, C. W.; Kim, Y. T. Solid State Electron. 1995, 38, 542. (41) Reid, J. S.; Kolawa, E.; Ruiz, R. P.; Nicolet, M.-A. Thin Solid Films 1993, 236, 319.
(42) Affolter, K.; Kattelus, H.; Nicolet, M.-A. Mat. Res. Soc. Symp. Proc. 1985, 47, 167.
(43) Nakajima, T.; Watanbe, K.; Watanbe, N. J. Electrochem. Soc. 1987, 134, 3175.
(44) Although this peak appears to reach a maximum at∼850 K, this is an experimental artifact resulting from the slowing of the heating ramp rate as the crystal approaches its temperature set point.
(45) Dubois, L. H.; Zegarski, B. R.; Kao, C.-T.; Nuzzo, R. G. Surf. Sci. 1990, 236, 77-84.
(46) Kevan, S. D. Ph.D. Thesis, University of California, Berkeley, CA, 1980.
(47) Redhead, P. A. Vacuum 1962, 12, 203-211.
(48) Anhaus, J. T.; Kee, T. P.; H., S. M.; Schrock, R. R. J. Am. Chem. Soc. 1990, 112, 1642-1643.
(49) Williams, D. S.; Schrock, R. R. Organomet. 1993, 12, 1148-1160. (50) Laplaza, C. E.; Cummins, C. C. Science 1995, 268, 861-863.