Electrically switchable spatial filter based on polymer-dispersed liquid crystal film
Andy Y.- G. Fuha)
Department of Physics, Institute of Electro-optical Science and Engineering, National Cheng Kung University, Tainan, Taiwan 701, Republic of China
Tsung-Hsien Lin
Institute of Electro-Optical Science and Engineering, National Cheng Kung University, Tainan, Taiwan 701, Republic of China
(Received 5 April 2004; accepted 18 August 2004)
This work demonstrates the feasibility of using polymer-dispersed liquid crystal(PDLC) films as electrically switchable spatial filters in the optical signal process. The fabrication relies on the fact that the size of the liquid crystal droplet formed in a PDLC film is inversely proportional to the intensity of curing. Controlling the driving voltage on the PDLC sample can filter particular spatial frequencies in the Fourier optical signal process. A simulation is also performed, and the results are highly consistent with those of experiments. © 2004 American Institute of Physics.
[DOI: 10.1063/1.1805185]
Recently, liquid crystals(LCs) have been widely used as light modulators. The refractive index of LCs can be changed significantly by applying a substantially lower voltage than is required to change the refractive index of other materials.
Also, LCs is highly transparent in the visible and near- infrared wavelength regions, and so can be used as modula- tors, switches, and wavelength filters for optical communica- tion.
Polymer-dispersed liquid crystal (PDLC) films, includ- ing micron sized liquid crystalline droplets dispersed in a polymer matrix, have recently been widely used. As well as being useful in displays, PDLC films have also been reported for various other applications, such as variable transmittance windows1–8 and holographic gratings.9,10 The size of LC droplets and the driving voltage are strongly related to the rate of curing.7,11Accordingly, PDLCs have been developed for use as Gaussian filters,11 and recently the electrically as tunable Fresnel lenses that use nano-PDLCs.12
Controlling the spatial distribution of optical information is very important. Such control has been practically applied in the fields of photographic image enhancement, pattern rec- ognition, and image inversion using a highly nonlinear dye- doped nematic LC film as a phase-modulation element.13An- other, selective spatial frequency reconstruction was demonstrated using functionalized mesogenic composites with holographic capability.14
This work demonstrates the feasibility of using PDLC films as electrically switchable spatial filters in the Fourier optical signal process.
A PDLC sample was prepared by mixing a photocurable polymer(Norland Optical Adhesive NOA65) material with a nematic liquid crystal(E7, Merck) in a weight ratio of 1:1. A small amount of photoinitiator⬃1 wt % (Rose Bengal) was added to cure the PDLC sample at the wavelength of green
light 共532 nm兲. After homogeneous mixing, the compound was injected into an empty cell that was made with two glass plates coated with indium-tin oxide(ITO) and separated by 25m spacers.
Figure 1 presents the experimental setup, a typical Fou- rier optical transform setup. The coherent light source is a DPSS (diode-pump solid state) laser that provides a maxi- mum power of ⬃2 W 共=532 nm兲. Lenses L1 and L2 are placed to expand the laser beam. Through a diaphragm, the input light can be considered to be a plane-wave source. The object is a grating mask with a 25m spacing. Lens 3共L3兲 is the Fourier-transform lens. The PDLC sample is placed at the transform plane to filter the spatial frequency. Finally, lens 4 共L4兲, the inverse transform lens, transforms the dif- fraction pattern of the object over the transform plane to the image plane.
According to Fig. 2, the object is a grating. The diffrac- tion patterns lie in the transform plane, in which a PDLC sample is placed. Each diffracted spot represents a specific spatial frequency whose order is proportional to its distance from the optical axis.15
The diffracted beams polymerize the PDLC sample. The central spot of the diffraction pattern represents the zeroth order of spatial frequency and has maximal intensity. A higher spatial frequency corresponds to lower intensity in typical Fraunhofer diffraction. Additionally, the higher cur- ing intensity accelerates the polymerization of PDLC, yield- ing smaller LC droplets.10–12 Therefore, a diffracted beam with lower spatial order is scattered more quickly by the
a)Author to whom correspondence should be addressed: Electronic mail:
FIG. 1. Experimental setup. Lenses one and two are used to expand a plane wave, and D is a diaphragm. Lenses three and four are the transformation lenses. The PDLC sample is placed in the transform plane.
JOURNAL OF APPLIED PHYSICS VOLUME 96, NUMBER 10 15 NOVEMBER 2004
0021-8979/2004/96(10)/5402/3/$22.00 5402 © 2004 American Institute of Physics
Downloaded 11 Sep 2008 to 140.116.208.41. Redistribution subject to AIP license or copyright; see http://jap.aip.org/jap/copyright.jsp
polymerized PDLC dot. Eventually, almost all orders are scattered. Real-time spatial frequency filtering occurs from low order to all orders(dark image state).
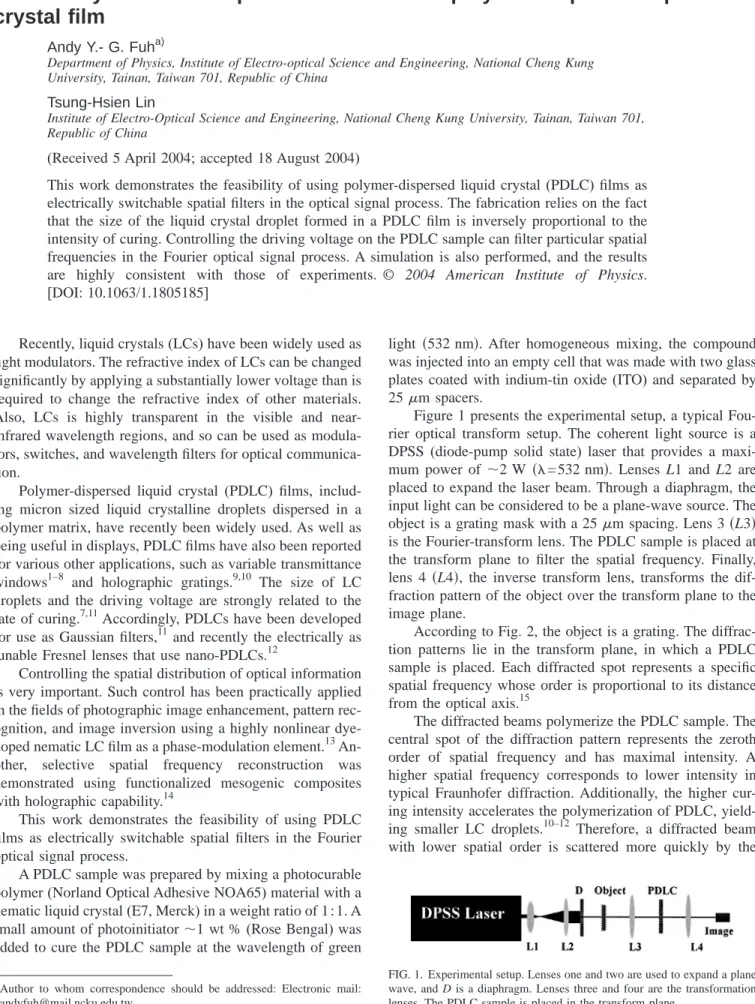
In addition, the controllability of LC droplets size would be dependent on the mixing ratio of LC and polymers, and on the film thickness. Figure 3 gives the obtained results from the study of such dependences for the materials used in the present experiment. It is seen from Fig. 3 that the drop- lets size can be precisely controlled by the film thickness and the mixing ratio of LC and polymers.
The light-scattering ability of a given PDLC sample var- ies almost exponential with the thickness of the sample.16 High scattering is desirable for completely filtering the sig- nal. However, the switching voltage increases with the thick- ness of the film. In this work, 25m thick samples are used to produce desired scattering, without an excessively high switching voltage. Additionally, the intensity profile of the diffracted beams is Gaussian. For a given order, a smaller LC droplet size is nearer the center of the beam. Droplets that are much larger or smaller than the wavelength of the light do not significantly scatter it.17,18Therefore, an input beam with a suitable intensity must be selected so that the polymerized droplets among the diffracted orders have the appropriate size to scatter light.
Figure 4 presents cured PDLC dots from the zeroth order to the third order. The intensity of the lower diffracted orders is higher, so the size of the droplets increases with the order.
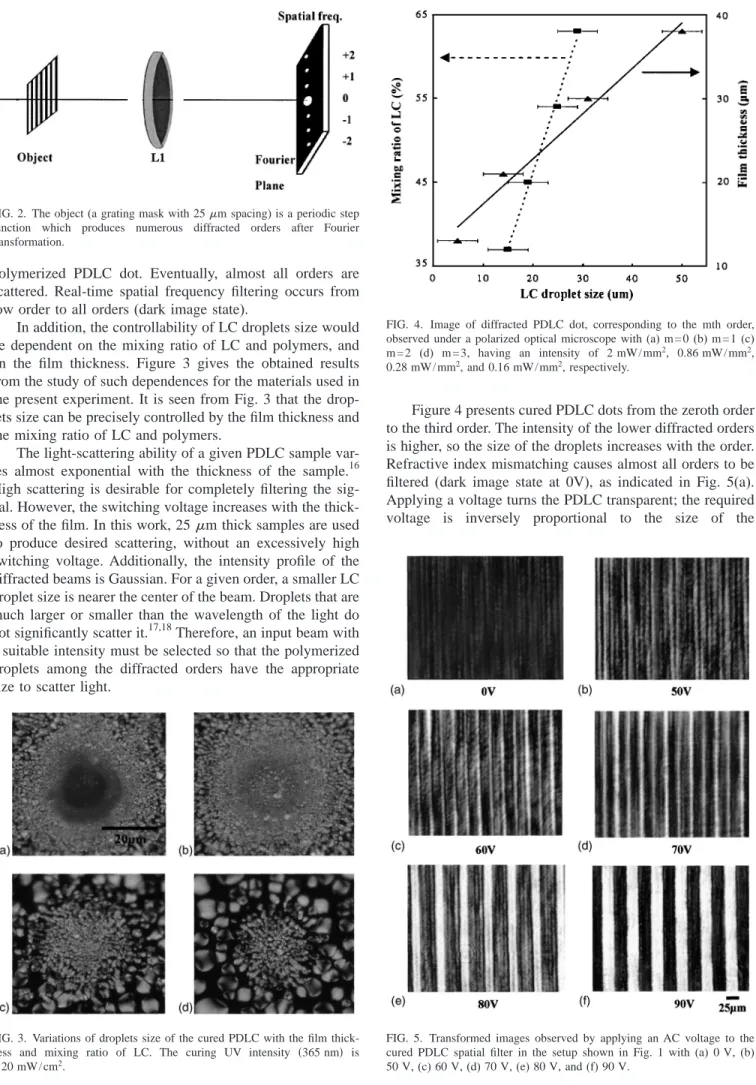
Refractive index mismatching causes almost all orders to be filtered (dark image state at 0V), as indicated in Fig. 5(a).
Applying a voltage turns the PDLC transparent; the required voltage is inversely proportional to the size of the
FIG. 2. The object(a grating mask with 25m spacing) is a periodic step function which produces numerous diffracted orders after Fourier transformation.
FIG. 3. Variations of droplets size of the cured PDLC with the film thick- ness and mixing ratio of LC. The curing UV intensity 共365 nm兲 is
⬃20 mW/cm2.
FIG. 4. Image of diffracted PDLC dot, corresponding to the mth order, observed under a polarized optical microscope with(a) m=0 (b) m=1 (c) m = 2 (d) m=3, having an intensity of 2 mW/mm2, 0.86 mW/ mm2, 0.28 mW/ mm2, and 0.16 mW/ mm2, respectively.
FIG. 5. Transformed images observed by applying an AC voltage to the cured PDLC spatial filter in the setup shown in Fig. 1 with(a) 0 V, (b) 50 V,(c) 60 V, (d) 70 V, (e) 80 V, and (f) 90 V.
J. Appl. Phys., Vol. 96, No. 10, 15 November 2004 A. Y. Fuh and T. Lin 5403
Downloaded 11 Sep 2008 to 140.116.208.41. Redistribution subject to AIP license or copyright; see http://jap.aip.org/jap/copyright.jsp
droplet.19,20Increasing the applied voltage from zero causes the highest diffracted order dot to become transparent first, followed by the second highest diffracted order dot, and so on. Figures 5(b)–5(f) present the transformed images when the PDLC sample is applied 50 V, 60 V, 70 V, 80 V, and 90 V, respectively. High spatial frequencies contribute to the detail of the sharp edge between the light and dark regions of the image, as is also observed in Fig. 5. Increasing the ap- plied voltage increases the number of low-frequency dots that become transparent. Figure 5(f) shows that all the spatial frequencies are transparent. The transformed image is the reprint of the object. Notably, the images are observed in reverse order, Fig. 5(f)–5(a), during dynamic curing. These findings clearly demonstrate that the PDLC spatial filter can be electrically switchable.
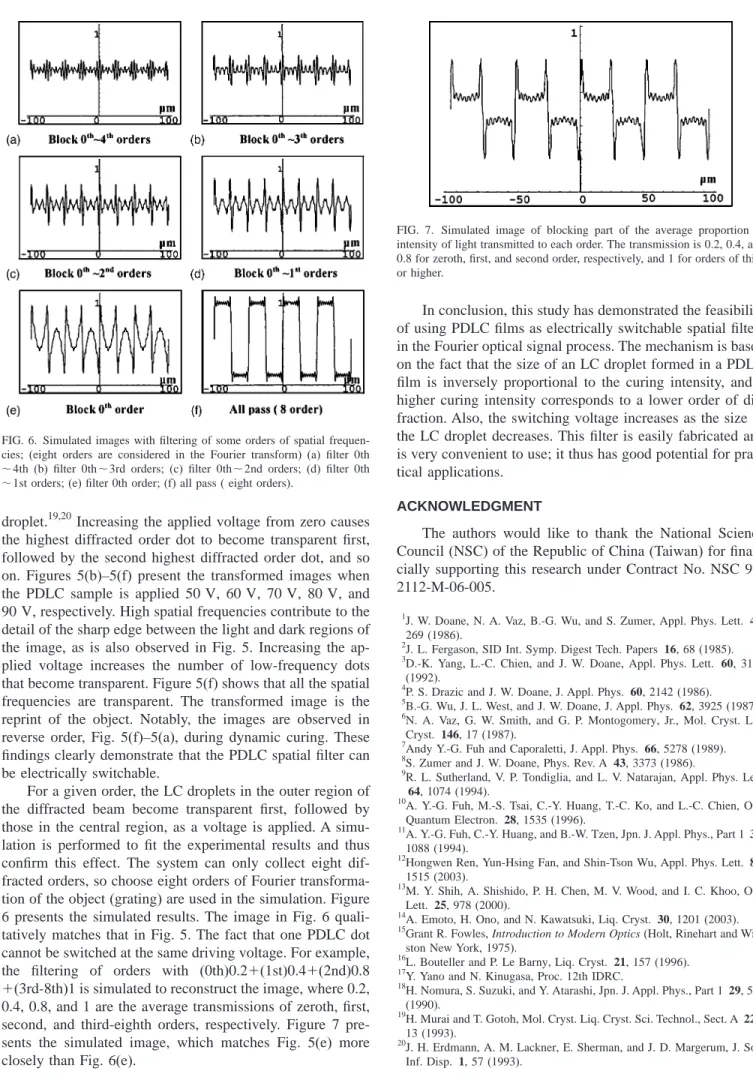
For a given order, the LC droplets in the outer region of the diffracted beam become transparent first, followed by those in the central region, as a voltage is applied. A simu- lation is performed to fit the experimental results and thus confirm this effect. The system can only collect eight dif- fracted orders, so choose eight orders of Fourier transforma- tion of the object(grating) are used in the simulation. Figure 6 presents the simulated results. The image in Fig. 6 quali- tatively matches that in Fig. 5. The fact that one PDLC dot cannot be switched at the same driving voltage. For example, the filtering of orders with (0th)0.2⫹(1st)0.4⫹(2nd)0.8
⫹(3rd-8th)1 is simulated to reconstruct the image, where 0.2, 0.4, 0.8, and 1 are the average transmissions of zeroth, first, second, and third-eighth orders, respectively. Figure 7 pre- sents the simulated image, which matches Fig. 5(e) more closely than Fig. 6(e).
In conclusion, this study has demonstrated the feasibility of using PDLC films as electrically switchable spatial filters in the Fourier optical signal process. The mechanism is based on the fact that the size of an LC droplet formed in a PDLC film is inversely proportional to the curing intensity, and a higher curing intensity corresponds to a lower order of dif- fraction. Also, the switching voltage increases as the size of the LC droplet decreases. This filter is easily fabricated and is very convenient to use; it thus has good potential for prac- tical applications.
ACKNOWLEDGMENT
The authors would like to thank the National Science Council(NSC) of the Republic of China (Taiwan) for finan- cially supporting this research under Contract No. NSC 92- 2112-M-06-005.
1J. W. Doane, N. A. Vaz, B.-G. Wu, and S. Zumer, Appl. Phys. Lett. 48, 269(1986).
2J. L. Fergason, SID Int. Symp. Digest Tech. Papers 16, 68(1985).
3D.-K. Yang, L.-C. Chien, and J. W. Doane, Appl. Phys. Lett. 60, 3102 (1992).
4P. S. Drazic and J. W. Doane, J. Appl. Phys. 60, 2142(1986).
5B.-G. Wu, J. L. West, and J. W. Doane, J. Appl. Phys. 62, 3925(1987).
6N. A. Vaz, G. W. Smith, and G. P. Montogomery, Jr., Mol. Cryst. Liq.
Cryst. 146, 17(1987).
7Andy Y.-G. Fuh and Caporaletti, J. Appl. Phys. 66, 5278(1989).
8S. Zumer and J. W. Doane, Phys. Rev. A 43, 3373(1986).
9R. L. Sutherland, V. P. Tondiglia, and L. V. Natarajan, Appl. Phys. Lett.
64, 1074(1994).
10A. Y.-G. Fuh, M.-S. Tsai, C.-Y. Huang, T.-C. Ko, and L.-C. Chien, Opt.
Quantum Electron. 28, 1535(1996).
11A. Y.-G. Fuh, C.-Y. Huang, and B.-W. Tzen, Jpn. J. Appl. Phys., Part 1 33, 1088(1994).
12Hongwen Ren, Yun-Hsing Fan, and Shin-Tson Wu, Appl. Phys. Lett. 83, 1515(2003).
13M. Y. Shih, A. Shishido, P. H. Chen, M. V. Wood, and I. C. Khoo, Opt.
Lett. 25, 978(2000).
14A. Emoto, H. Ono, and N. Kawatsuki, Liq. Cryst. 30, 1201(2003).
15Grant R. Fowles, Introduction to Modern Optics(Holt, Rinehart and Win- ston New York, 1975).
16L. Bouteller and P. Le Barny, Liq. Cryst. 21, 157(1996).
17Y. Yano and N. Kinugasa, Proc. 12th IDRC.
18H. Nomura, S. Suzuki, and Y. Atarashi, Jpn. J. Appl. Phys., Part 1 29, 522 (1990).
19H. Murai and T. Gotoh, Mol. Cryst. Liq. Cryst. Sci. Technol., Sect. A 226, 13(1993).
20J. H. Erdmann, A. M. Lackner, E. Sherman, and J. D. Margerum, J. Soc.
Inf. Disp. 1, 57(1993).
FIG. 6. Simulated images with filtering of some orders of spatial frequen- cies; (eight orders are considered in the Fourier transform) (a) filter 0th
⬃4th (b) filter 0th⬃3rd orders; (c) filter 0th⬃2nd orders; (d) filter 0th
⬃1st orders; (e) filter 0th order; (f) all pass ( eight orders).
FIG. 7. Simulated image of blocking part of the average proportion of intensity of light transmitted to each order. The transmission is 0.2, 0.4, and 0.8 for zeroth, first, and second order, respectively, and 1 for orders of third or higher.
5404 J. Appl. Phys., Vol. 96, No. 10, 15 November 2004 A. Y. Fuh and T. Lin
Downloaded 11 Sep 2008 to 140.116.208.41. Redistribution subject to AIP license or copyright; see http://jap.aip.org/jap/copyright.jsp