Flywheel Energy Storage System for Voltage Sag Compensation
W. R. Yang, M. H. Hu, G. W. Jhang, Z. Y.
He, K. Y. Huang, C. S. Wang, L. R. Chen, and T. Y. Guo
Dept. of Electrical Engineering, National Changhua University of Education, Changhua, Taiwan.
C. P. Young
Dept. of Computer Engineering, National Cheng-Kung University, Tainan, Taiwan.
Abstract—This paper presents a real-time voltage sag monitoring system. Discrete wavelet transform (DWT) is implemented by using an embedded chipset in order to monitor initial and ending points of voltage sag. A flywheel energy storage system (FESS) is designed for voltage sag compensation, and proof-of-principle experiment is presented.
Keywords: Discrete wavelet transform, voltage sag, flywheel energy storage system
I. INTRODUCTION
Voltage sag is considered to be one serious instantaneous attack to the power grid and important facilities. For power quality issues, harmonics problem leads to disturbance, and voltage sag directly shut down facilities. Equipment failure due to insufficient voltage, undervoltage circuit trips, unbalanced relay tripping, and reset circuits may incorrectly trip are major problems caused by voltage sag [1]-[3].
This paper presents design for a flywheel energy storage system (FESS) in application of real-time voltage sag compensation. Short-time discrete wavelet transform (STDWT) derived from DWT and neural network system are used to monitoring and determining initial of voltage sag; including digital implementation for the decision flow. For the proof-of- principle experiment, a small-scale FESS is used to investigate monitoring, compensation timing diagram, and parallel operations. Brushless AC and DC motors are used to test FESS transient operational characteristics.
II. SYSTEMS
A. Embedded real-time voltage sag moniotring system
Use of embedded system for real-time voltage sag monitoring is because of the reliability. The signal processing for monitoring implemented by embedded system ensures low complexity data processing. In the following section, STDWT is derived and implemented for voltage sag monitoring.
B. Flywheel energy storage system
The solution to voltage sag includes voltage compensation unit. The FESS used in this research rather than static active filter is because of reliability and high instantaneous power supplied to the loads. In the following sections, DC and AC FESSs are designed and tested for proof-of-principle experiments.
III. DISCRETE WAVELET TRANSFORM [4]-[6]
This section investigates basics of wavelet transform, and develops STDWT for real-time voltage sag monitoring.
A. Wavelet transform basics
Continuous Wavelet Transform is simply the correlation of the wavelet function and the data. The wavelet function is defined as
0 , :
0 , :
) 1 (
)
, (
>
>
= −
b t coefficien n
translatio b
a t coefficien scaling
a
a b t t a
b
a ψ
ψ
(1)
The Continuous Wavelet Transform Coefficient
C ( b a , )
is C(a,b)=∫
f(t)ψ
∗a,b(t)dt(2)
function Wavelet
t Signal t
f(): ,ψa,b():
In (1),
a
andb
are both real number, or continuous. We can discretize them to integers as shown in (3)
index scaling m
index Time n
b a nb b a a
a m m
: , :
0 ,
, 1
, 0 0 0 0
0 > = >
=
(3) (1) can now be rewritten as
ψ
m,n(t)=a0−m/2ψ
(a0−mt−nb0)(4)
The implementation of DWT is called “Multiresolution Analysis”, “Subband Filtering”, or “Dyadic Filtering” because of the filtering structure.
In Multiresolution Analysis, assuming the signal
f
can be constructed by orthogonal base of approximation,f
and detailsδ
are as follows
1 1
1 2 3 3
1 2 2 1 1 0
+
+ +
=
=>
+ + +
=
+ +
= +
=
j j
j f
f f
f f
f
δ δ δ δ
δ δ δ
(5)
In (5) we are decomposing
f
j intof
j+1 andδ
j+1 ,where
j
is the present level andj + 1
is the next level.The definition of
f
is constructed using the scaling functionφ
and the approximation coefficientc
,δ
isconstructed using the wavelet function
ψ
and detail coefficientd
.
,...
2 , 1 , 0
, ,
1
=
+
= +
=
∑ ∑
−
k
d c
f f
k jk
j k
k jk
j k j j
j
δ φ ψ
(6)
By substituting 2 for
a
0, we can rewrite (4) as) 2
( 2 ) (
) 2
( 2 ) (
, 2 , 2
k n n
k n n
j j k
j
j j k
j
−
=
−
=
− −
− −
φ φ
ψ
ψ
(7)
The filters used in Subband Filtering are defined as follows
) (n
g
,g
'( n )
: High-pass Decomposition and Reconstruction Quadrature Mirror Filters) (n
h
,h
'( n )
: Low-pass Decomposition and Reconstruction Quadrature Mirror FiltersThe wavelet and scaling functions in (7) are related to the filter functions as follows
∑
∑
−
−
−
=
−
=
n
j k
j n
j k
j
n k n h
n k n g
) ( ) 2 (
) ( ) 2 (
1 '
,
1 '
,
φ φ
φ ψ
(8)
The first stage is Analysis or Decomposition, the equations for which are shown in (9).
∑
∑
−
−
−
=
−
=
n
j n j
k n
j n j
k
c k n g d
c k n h c
1 1
) 2 (
) 2 (
(9)
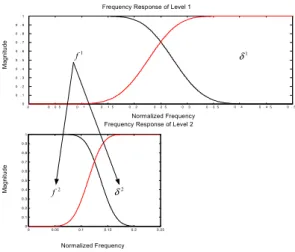
In Fig. 1, we can see symmetry between low-pass and high- pass filters in the frequency domain than that in the time domain. Figure 1 is the frequency response of 2-Level (
j = 2
in (6)) Subband Filtering. Level 2 decomposes the lower half
0 0 . 0 5 0 . 1 0 . 1 5 0 . 2 0 . 2 5 0 . 3 0 . 3 5 0 . 4 0 . 4 5 0 . 5
0 0 . 1 0 . 2 0 . 3 0 . 4 0 . 5 0 . 6 0 . 7 0 . 8 0 . 9 1
0 0.05 0.1 0.1 5 0.2 0.25
0 0.1 0.2 0.3 0.4 0.5 0.6 0.7 0.8 0.9 1
f1 δ1
f2 δ2
Magnitude
Frequency Response of Level 1
Frequency Response of Level 2
Magnitude
Normalized Frequency
Normalized Frequency
Fig. 1. 2-Level frequency response of DWT.
For the applications presented in this paper, decomposition is used and reconstruction is not introduced. In hardware implementation, DWT is the only one because of analog-to- digital interface used; CWT is only for theory fundamentals.
The implementation of DWT is subband filtering, and therefore it is a total digital filtering structure. According to simulation, experiment, and hardware structure, point-by-point processing is not practical. Therefore observation for local energy transition is applied, and STDWT is derived and applied for real-time or in-line applications.
B. Short-time discrete wavelet transform for real-time voltage sag moniotring
The followings define STDWT processing. Assume incoming discrete signal is collected and buffered as a framed incoming data sequence [7]:
{
( ),..., ( 1)}
)
(n = xm⋅L xi⋅L−
xi , m= i−1
⎩⎨
⎧ ≤ ≤ −
= else
L n n
w 0,
1 0
, ) 1
( or other window functions (10)
and therefore the buffered data to be processed by DWT is yi(m)=xi(m)w(n−m),m=0, 1, 2,... L−1
(11)
The local energy for the STDWT is defined as
∑
−=
= 1
0 2( ) 1
1 L
n
i d n
d ,
∑
−=
= 1
0 2( ) 6
6 L
n
i c n
c
(12)
The window (frame) size in (10) is defined as the average resolution. The choice for window (frame) size is a trade-off to average analysis resolution. Shorter window size leads to
irregular pattern of the STDWT curve, and automatic identification cannot be applied. Both windowing function in STDWT in (10)-(12) use Finite Impulse Response (FIR) filter, and therefore the entire electrical signal computations have complexity of
n
; STDWT does not require domain transformation. Hamming window function is used, and other functions can be used.Voltage sag initiation and recovery generate high frequency transients. These phenomena are quite significant in the output which is therefore used for voltage sag detection [4].
Figure 2 shows the test waveform for the case of interruption preceded by voltage sag. There is a high-frequency transient around point 450. Figure 3 shows the magnitude of the output of the high-pass (d12) filter. The filtering delay introduced by convolution and significant increasing of output magnitude is around point 500. Edge-effects caused by filtering are truncated by zero-padding the first 128 points.
High-Frequency T ransient at Voltage Sag Initiation
Magnitude (p.u)
Num ber of P oints
Fig. 2. Interruption preceded by a voltage sag.
Number of Points
Magnitude
Significant increase of magnitude because of high- frequency transient at voltage sag initiation
Fig. 3. d12 in DWT.
Figure 4 shows a waveform recorded by power meter [8], and its STDWT simulation (emulation of fast-decayed sinusoidal signal) shows that the regular distribution pattern can be used. The STDWT monitoring can be used to determine voltage compensation initiation and magnitude.
Otherwise, the equipment will be reset because of loss of power supply; overvoltage compensation will also lead to breaker tripping.
Fig. 4. Three-phase voltage sag waveform. [8]
Fig. 5. Fast-decayed power source recorded from experiment.
0 5 10 15 20 25 30
0 1 2 3 4 5 6 7 8 9 10
Number of frames
Magnitude
D1 & A6 for each frame
D1 A6
Fig. 6. Fast-decayed power line signal analyzed by using STDWT [9].
The simulation and experiment waveforms are to verify that facts that voltage sag monitoring has to be aimed at fast- decayed voltage with noise (high-frequency transient). Figure 7 shows the decision diagram for the experiment and STDWT applied to the monitoring.
Subband Filtering
Voltage Sag Initiation
V oltage Recovery
) 1 ( 1 ) ( 1i ≥ D i−
D α
) 1 ( 6 ) ( 6 9 .
0 A i ≥A i+
) 1 ( 6 9 . 0 ) (
6i ≤ A i+ A
No
Y es
N o Y es
Y es N o
Dum p Data
∑
∑
−
=
−
=
=
=
1
0 2 1
0 2
) ( 6 ) ( 6
) ( 1 ) ( 1
L
n L
n
n A i A
n D i
D 6-level S ubband Filtering
i : Present fram e L : Fram e Size
t cons tan α:
Fig. 7. Decision flow diagram.
C. Embedded system implementation
The real-time voltage sag monitoring based on STDWT is implemented by using Simulink/DSP Builder, and loaded to the Altera chipset.
Fig. 8. System diagram for STDWT implementation in embedded system.
Figure 8 shows the system diagram for STDWT implementation in embedded system. Figure 9 is the system layout for DWT. STDWT is activated by using state controller in Fig. 8. Figure 10 shows one of the voltage sag waveforms to be tested by STDWT. The test is conducted within the red region since phase locked loop is not considered in this research.
Fig. 9. Unit diagram of STDWT implementation.
0 200 400 600 800 1000 1200 1400 1600
-100 -50 0 50 100
Number of point
Amplitude
W aveform6:Voltage Sag
Fig. 10. Fast-decayed voltage sag recorded by IEEE P1159.2.
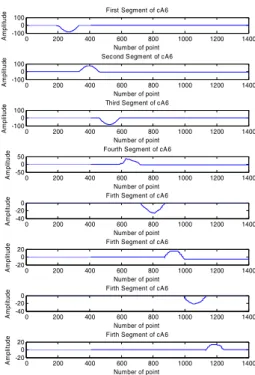
Figures 11 and 12 show the waveform decomposition by embedded system based on STDWT. Figure 13 presents voltage sag monitoring according to decision flow diagram in Fig. 7. The abrupt regional high-frequency transient average power can be easily observed. The fundamental frequency component is also decreased gradually.
0 200 400 600 800 1000 1200 1400 -1
0 1
Number of point
Amplitude
First Segment of cD1
0 200 400 600 800 1000 1200 1400
-2 -1 0
Number of point
Amplitude Second Segment of cD1
0 200 400 600 800 1000 1200 1400
-5 0 5
Number of point
Amplitude
Third Segment of cD1
0 200 400 600 800 1000 1200 1400
-2 0 2
Number of point Amplitude Fourth Segment of cD1
0 200 400 600 800 1000 1200 1400
-1 -0.5 0
Number of point
Amplitude
Firth Segment of cD1
0 200 400 600 800 1000 1200 1400
-1 -0.5 0
Number of point
Amplitude
Firth Segment of cD1
0 200 400 600 800 1000 1200 1400
-1 -0.5 0
Number of point
Amplitude
Firth Segment of cD1
0 200 400 600 800 1000 1200 1400
-1 -0.5 0
Number of point
Amplitude Firth Segment of cD1
Fig. 11. cD1 coefficient from STDWT.
0 200 400 600 800 1000 1200 1400
-100 0 100
Number of point
Amplitude First Segment of cA6
0 200 400 600 800 1000 1200 1400
-100 0 100
Number of point
Amplitude Second Segment of cA6
0 200 400 600 800 1000 1200 1400
-100 0 100
Number of point
Amplitude Third Segment of cA6
0 200 400 600 800 1000 1200 1400
-50 0 50
Number of point
Amplitude Fourth Segment of cA6
0 200 400 600 800 1000 1200 1400
-40 -20 0
Number of point
Amplitude Firth Segment of cA6
0 200 400 600 800 1000 1200 1400
-20 0 20
Number of point
Amplitude Firth Segment of cA6
0 200 400 600 800 1000 1200 1400
-40 -20 0
Number of point
Amplitude Firth Segment of cA6
0 200 400 600 800 1000 1200 1400
-20 0 20
Number of point
Amplitude Firth Segment of cA6
Fig. 12. cA6 coefficient from STDWT.
1 2 3 4 5 6 7 8
0 0.5 1
The power of cD1 for W aveform6
Magnitude
Number of Segments
1 2 3 4 5 6 7 8
0 200 400
The power of cA6 for W aveform6
Magnitude
Number of Segments
Fig. 13. Local energy of Figs. 11 and 12 according to (12).
IV. FLYWHEEL ENERGY STORAGE SYSTEM
The following sections present the proof-of-principle experiments for FESS in application of voltage sag compensation.
A. Experiments
This section presents a DC brushless motor/generator and AC brushless motor/generator for voltage compensation experiments. Figure 14 shows the layout of DC FESS system, and the experiment is based on sudden loss of supply voltage.
Electrical relay is used for the switching of the entire system.
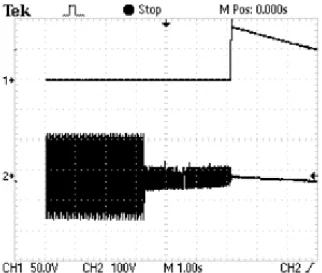
Figure 17 shows a 3k Watts AC FESS and its fed-back voltage in Fig. 18.
Fig. 14. DC brushless FESS.
Fig. 15. CH1 is voltage fed back from DC FESS and CH2 is power line voltage.
Fig. 16. CH1 is voltage fed back from DC FESS and CH2 is electrical relay switching voltage.
Fig. 18. Voltage fed back from AC FESS and its maximum root-mean-square value is 220 volts.
V. CONCLUSIONS
This paper presents design and proof-of-principle experiments for a real-time voltage sag monitoring and compensation system. The next step of this research is to implement a semiconductor fabrication production line, and the FESS will be installed. Switching and control reliability for the monitoring-FESS will be the key factors to the research.
ACKNOWLEDGMENT
This research is supported by NSC 982221-E-018023.
REFERENCES
[1] J. Douglas, ”Solving problems of power quality”. EPRI Journal, vol. 18, no. 8, pp. 6~15, Dec. 1993.
[2] Application Note, Understanding SEMI F47 voltage sag standard.
Interpretation of voltage sag test results of Schneider electric relays and contactors.
[3] IEEE power quality event characterization 1159.2, Feb. 2001.
[4] Y. H. Gu and M. H. J. Bollen, “Time-frequency and time-scale domain analysis of voltage disturbance,” IEEE Transactions on Power Delivery, vol. 15, no. 4, pp. 1279~1284, Oct. 2000.
[5] I. Daubechies, Ten Lectures on Wavelets. SIAM, Philadelphia, Pennsylvania, 1992.
[6] Wen-Ren Yang, Robert M. O’Connell, Chau-Shing Wang, and Liang- Rui Chen, “Modeling of a wavelet-based voltage sag monitoring system and design for the mixed-signal integration circuit implementation,”
IEEE International Conference on Industrial Technology, Chengdu, China. April 2008.
[7] J. G. Proakis and D. G. Manolakis, Digital Signal Processing, 3rd ed.
Prentice Hall, 1996.
[8] Resource: http://www.i-grid.com.
[9] Wen-Ren Yang, “Discrete wavelet transform applications: microcrack detection and voltage sag moniotring,” National Symposium on System Science and Engineering, Taipei, Taiwan. June 2009.