添加下水道污泥灰渣對於高性能混凝土影響之研究
王和源
國立高雄應用科技大學/土木工程與防災科技研究所
江慶堂
正修科技大學/土木與工程資訊系
摘 要
本研究利用緻密配比法探討添加當作細骨材的下水道污泥灰渣對高性能 混凝土配比及抗壓強度之影響,水膠比有 0.28、0.32、0.36、0.40 及 0.44 等五 種;下水道污泥灰渣佔細骨材之比例為 0%、5%、10%及 15% 等四種;混凝 土抗壓強度齡期為 3、7、28 及 56 天。結果顯示,添加適量的下水道污泥灰渣,
產製成高性能混凝土,其抗壓強度略有提高之情形,為維持混凝土固定水膠比 及緻密配比,混凝土之單位強塑劑用量隨著污泥灰渣含量增加而增加,單位用 水量則為減少之趨勢;污泥灰渣最佳含量隨著水膠比增加而增加;若過量添加 污泥灰渣會影響混凝土抗壓強度及工作度,顯示混凝土中添加下水道污泥灰渣 之應用具有可行性。
關鍵詞:下水道污泥灰渣,高性能混凝土,緻密配比法,抗壓強度。
EFFECTS OF SEWAGE SLUDGE ASH ON HIGH PERFORMANCE CONCRETE
Her-Yung Wang Department of Civil Engineering, National Kaohsiung University of Applied Sciences
Kaohsiung, Taiwan 807, R.O.C.
Cing-Tang Chiang
Department of Civil Engineering and Engineering Informatics, Cheng Shiu University
Kaohsiung, Taiwan 833, R.O.C.
Key Words: sewage sludge ash (SSA), HPC, densified mixture designed algorithm (DMDA), compressive strength.
ABSTRACT
This study focuses primarily on the use of recycled sewage sludge ash (SSA) as part of the fine aggregate in High Performance Concrete (HPC) designed using the Densified Mixture Designed Algorithm (DMDA).
Four replacement ratios of the fine aggregate, 0%, 5%, 10% and 15%, and five paste qualities, expressed as W/b (water-to-binder) ratios of 0.28, 0.32, 0.36, 0.40 and 0.44, are the parameters utilized to discuss the effects at
three, seven, 28, and 56 days. Experimental results demonstrate that the compressive strength of HPC is slightly improved when made with the proposed mixtures containing appropriate amounts of SSA. Under a fixed W/b ratio and using DMDA, the dosage of superplasticizer (SP) utilized in concrete increases as the amount of SSA increases and water content de- creases. The optimum SSA content increases as the W/b ratio increases.
An excessive amount of SSA affects workability and compressive strength.
Results indicate that using sewage sludge ash in concrete is feasible.
I. INTRODUCTION
The rapid economic growth of Taiwan has driven a continuous need to further develop municipal sewer sys- tems that clean wastewater. In Taiwan, sewer systems serve up to 53% and 20% of households in Taipei City and Kaohsiung City, respectively, as compared to 8% nation- wide. The system is expected to serve 28% of house- holds nationwide by 2011 with an annual installation rate of 3% to address severe water pollution and environmental sanitation problems that are the responsibility of the Con- struction and Planning Agency, Ministry of the Interior, Taiwan [1].
The estimated volume of sewage sludge produced daily will be roughly 400,000 m3 in 2009; a landfill 1,460 hectare in size and 10 meters deep will be required to con- tain this sludge for processing [2]. This is a significant problem for Taiwan, as the country is densely populated and has limited available land for landfills. Decreasing the amount of sewage sludge using incineration, an effec- tive approach, generates sewage sludge ash (SSA) which constitutes another environmental problem. A creative and innovative alternative to dumping sludge into landfills [3] proposes to treat SSA as a resource rather than as a waste product. Many studies on SSA suggest that it can be recycled [1-10]. Monzo [5] and Wang et al. [1, 2]
demonstrated that, due to its pozzolanic material properties, rich calcium content and porous structure, SSA is a reac- tive material [6] that can serve as a forming agent in the production of lightweight aggregates [1, 2]. SSA can also be used to replace some ingredients in mortar [4, 5].
A disadvantage of utilizing SSA is that its pozzolanic activity is low compared with those of normal pozzolan materials [7], resulting in low compressive strength.
Other shortcomings of SSA are its poor morphology, ir- regular porosity and water-absorbing characteristic; these significantly reduce workability and mortar strength [4].
Thus, this study focuses on improving mortar quality and the application of SSA using a superplasticizer (SP) to improve workability and compressive strength.
II. STUDY PLAN
1. Test Material
Type I cement with a specific gravity of 3.15 was ob- tained from the Taiwan Cement Corporation. Sewage sludge was collected from the Chong-chou Wastewater Treatment Plant, Kaohsiung, Taiwan. It was incinerated at 900 °C for 12 hours to yield SSA. The SSA was then ground to a fine powder, oven dried and stored to avoid moisture absorption. The SSA specific gravity was 2.61.
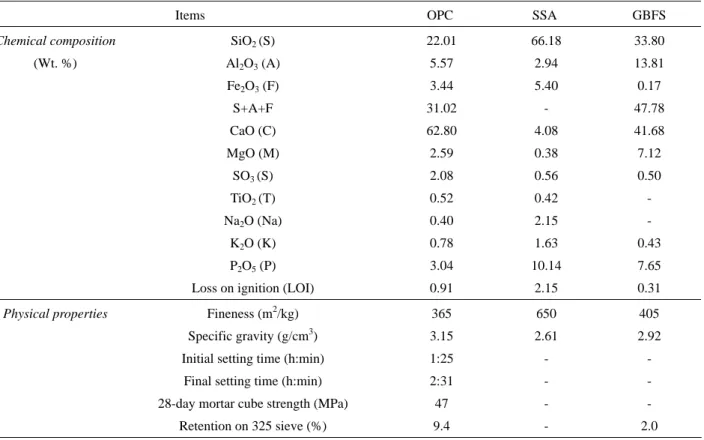
Table 1 presents the chemical compositions and physical properties of the cement and SSA. Granulated blast fur- nace slag (GBFS) with a specific gravity of 2.92 was ob- tained from the Chung Lien Factory. Also utilized were coarse aggregates and fine aggregates that were in accor- dance with ASTM C33 and Type G superplasticizer that complied with the ASTM C 494 type G admixture manu- factured in Taiwan with a specific gravity of 1.21, moisture content of 58.1% and pH of 9.
2. Mixture Design Strategy
This study applies a mixture design algorithm that fixes all solid material proportions under the maximum density condition to minimize paste content [11]. Ta- bles 2 and 3 present test parameters and mixture propor- tions, respectively. The GBFS substituted 40% by weight of cementitious material for paste material and paste volume accounted for 1.3 times the void volume within the aggregate. The SSA replaces river sand at 0%, 5%, 10% and 15% by weight of the fine aggregate, accounting for approximately 54% of the total aggregate.
Twenty concrete mixtures covering all W/b ratios achieved the desired slump, which was bigger then 200 mm. Slump and slump flow tests were conducted for each mixed proportion at the fresh stage. Twelve sets of 120 × 240 mm cylinder specimens were prepared for each mixture. 240 specimens for measuring compres- sive strength at 3, 7, 28 and 56 days under moisture cur- ing were prepared.
Table 1 Chemical composition and physical properties of cement, SSA and GBFS
Items OPC SSA GBFS
Chemical composition SiO2 (S) 22.01 66.18 33.80
(Wt. %) Al2O3 (A) 5.57 2.94 13.81 Fe2O3 (F) 3.44 5.40 0.17
S+A+F 31.02 - 47.78
CaO (C) 62.80 4.08 41.68
MgO (M) 2.59 0.38 7.12
SO3 (S) 2.08 0.56 0.50
TiO2 (T) 0.52 0.42 -
Na2O (Na) 0.40 2.15 -
K2O (K) 0.78 1.63 0.43 P2O5 (P) 3.04 10.14 7.65 Loss on ignition (LOI) 0.91 2.15 0.31
Physical properties Fineness (m2/kg) 365 650 405
Specific gravity (g/cm3) 3.15 2.61 2.92 Initial setting time (h:min) 1:25 - -
Final setting time (h:min) 2:31 - - 28-day mortar cube strength (MPa) 47 - - Retention on 325 sieve (%) 9.4 - 2.0
Table 2 Test variables W/b ratio 0.28, 0.32, 0.36, 0.40 and 0.44
SSA (%) 0, 5, 10 and 15 Age(days) 3, 7, 28 and 56
Workability Slump ≧ 200 mm, Slump flows ≧ 600 mm
3. Mixture Proportion Algorithm of SSAHPC (1) Select proper materials
The selection of appropriate materials is an important step when proportioning the HPC mixtures. Knowledge of the basic properties of the cement, SSA, GBFS, sand and SP are required for quality control and the use of ap- propriate proportions in the concrete.
(2) Acquire the highest packing density by calculating the least void between the aggregate and other solid parti- cles
(a) Mix normal sand with SSA and obtain the ratio of maximum bulk density:
ssa
ssa cs
W
W W
α=
+ (1)
Table 3 Designation of concrete mix W/b ratio
SSA (%)
0.28 0.32 0.36 0.40 0.44 0 28W00 32W00 36W00 40W00 44W00 5 28W05 32W05 36W05 40W05 44W05 10 28W10 32W10 36W10 40W10 44W10 15 28W15 32W15 36W15 40W15 44W15
Remark 1. 28 indicates W/b = 0.28; 2.W05 indicates 5% SSA.
where WCS the is the normal weight of sand, and WSSA is the weight of SSA.
(b) Mix coarse aggregate with blended sand and SSA under a fixed α ratio to obtain
( )
ssa cs
ssa cs ca
W W
W W W
β= +
+ + (2)
where β is the densest blended aggregate ratio and Wca is the weight of the coarse aggregate.
(c) The least void, Vv, can be obtained by
1 i
v
i
V W
= − ∑γ . (3)
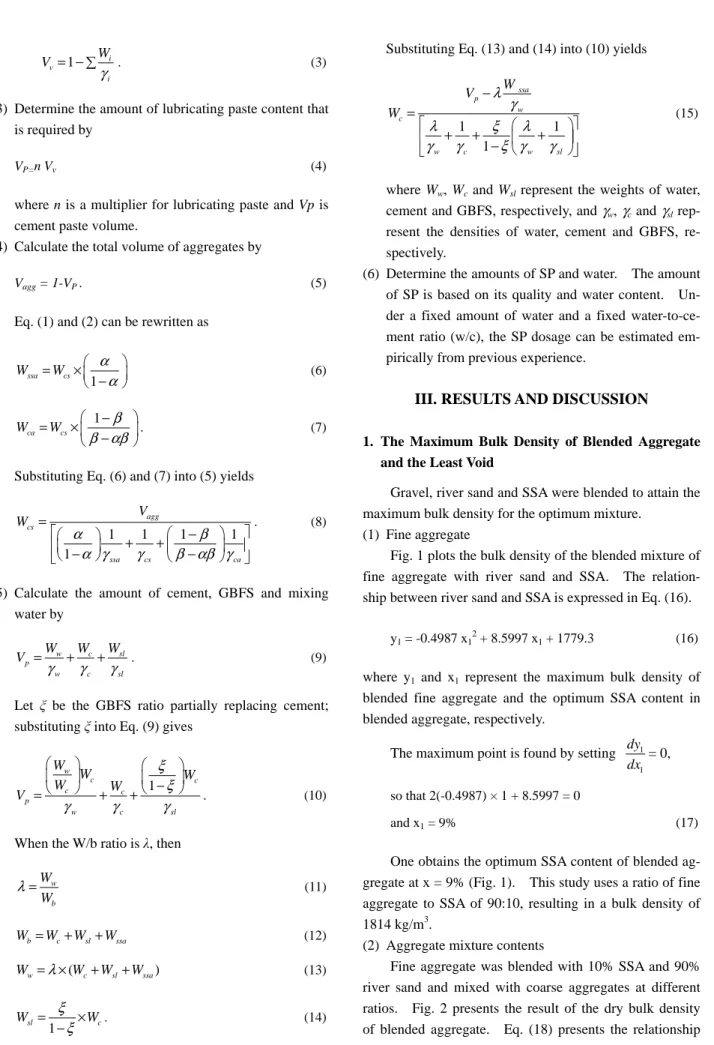
(3) Determine the amount of lubricating paste content that is required by
VP=n Vv (4)
where n is a multiplier for lubricating paste and Vp is cement paste volume.
(4) Calculate the total volume of aggregates by
Vagg = 1-VP . (5)
Eq. (1) and (2) can be rewritten as
ssa cs 1
W W α
α
⎛ ⎞
= ×⎜⎝ − ⎟⎠ (6)
1
ca cs
W W β
β αβ
⎛ − ⎞
= ×⎜ ⎟
−
⎝ ⎠. (7)
Substituting Eq. (6) and (7) into (5) yields
1 1 1 1
1
agg cs
ssa cs ca
W V
α β
α γ γ β αβ γ
=⎡⎛ ⎞ ⎛ − ⎞ ⎤
+ +
⎢⎜⎝ − ⎟⎠ ⎜⎝ − ⎟⎠ ⎥
⎣ ⎦
. (8)
(5) Calculate the amount of cement, GBFS and mixing water by
w c sl
p
w c sl
W W W
V =γ +γ +γ . (9)
Let ξ be the GBFS ratio partially replacing cement;
substituting ξ into Eq. (9) gives
1
w
c c
c c
p
w c sl
W W W
W W
V
ξ ξ
γ γ γ
⎛ ⎞ ⎛ ⎞
⎜ ⎟ ⎜ − ⎟
⎝ ⎠ ⎝ ⎠
= + + . (10)
When the W/b ratio is λ, then
w b
W
λ=W (11)
b c sl ssa
W =W +W +W (12)
( )
w c sl ssa
W = ×λ W +W +W (13)
sl 1 c
W ξ W
= ξ×
− . (14)
Substituting Eq. (13) and (14) into (10) yields
1 1
1
ssa p
w c
w c w sl
V W W
λ γ
λ ξ λ
γ γ ξ γ γ
−
=⎡ ⎛ ⎞⎤
+ + +
⎢ ⎜ ⎟⎥
− ⎝ ⎠
⎣ ⎦
(15)
where Ww, Wc and Wsl represent the weights of water, cement and GBFS, respectively, and γw, γc and γsl rep- resent the densities of water, cement and GBFS, re- spectively.
(6) Determine the amounts of SP and water. The amount of SP is based on its quality and water content. Un- der a fixed amount of water and a fixed water-to-ce- ment ratio (w/c), the SP dosage can be estimated em- pirically from previous experience.
III. RESULTS AND DISCUSSION
1. The Maximum Bulk Density of Blended Aggregate and the Least Void
Gravel, river sand and SSA were blended to attain the maximum bulk density for the optimum mixture.
(1) Fine aggregate
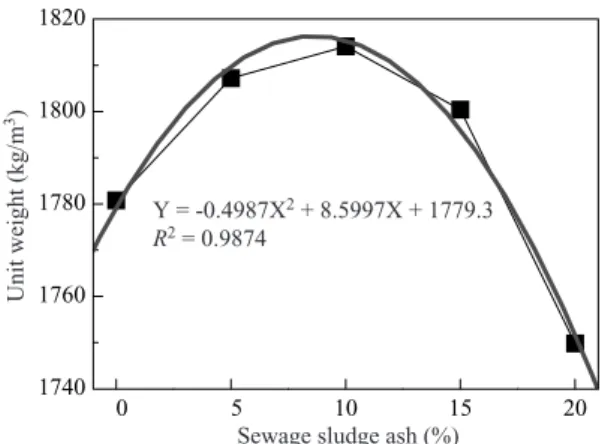
Fig. 1 plots the bulk density of the blended mixture of fine aggregate with river sand and SSA. The relation- ship between river sand and SSA is expressed in Eq. (16).
y1 = -0.4987 x12
+ 8.5997 x1 + 1779.3 (16)
where y1 and x1 represent the maximum bulk density of blended fine aggregate and the optimum SSA content in blended aggregate, respectively.
The maximum point is found by setting 1
1
dy dx = 0, so that 2(-0.4987) × 1 + 8.5997 = 0
and x1 = 9% (17)
One obtains the optimum SSA content of blended ag- gregate at x = 9% (Fig. 1). This study uses a ratio of fine aggregate to SSA of 90:10, resulting in a bulk density of 1814 kg/m3.
(2) Aggregate mixture contents
Fine aggregate was blended with 10% SSA and 90%
river sand and mixed with coarse aggregates at different ratios. Fig. 2 presents the result of the dry bulk density of blended aggregate. Eq. (18) presents the relationship
0 5 10 15 20 1740
1760 1780 1800 1820
Unit weight (kg/m3)
Sewage sludge ash (%) Y = -0.4987X2 + 8.5997X + 1779.3 R2 = 0.9874
Fig. 1. Relationship of bulk density and SSA content in fine aggregate
between bulk density and the blended ratio of aggregate.
y 2 = -0.1812 x22
+ 19.201 x2 + 1481.7 (18)
where y2 and x2 represent the maximum bulk density of blended aggregate and the optimum blended fine aggregate content in total aggregate, respectively.
x2 is found by setting 2
2
dy
dx = 0, so that
2(-0.1812) x2 + 19.201 = 0, and x2 = 53% (19)
The optimum blended fine aggregate content in total aggregates is 53% (Fig. 2), and the corresponding maxi- mum bulk density of blended aggregate is 1987 kg/m3. 2. MixtureProportion of HPC with SSA
Once the relationship between coarse aggregate, river sand and SSA was obtained, paste content with differing qualities, such as water-to-binder (W/b) ratio under the desired low water content and a required w/c ratio bigger then 0.42, was developed after several trial batches, and finally HPC was obtained [11]. Table 4, Fig. 3 and Fig. 4 plot the effects of SSA content on water demand and the corresponding water-to-solid (w/s) ratio for water content in HPC, respectively. They indicate that the addition of SSA increases the SP demand and decreases water content under a fixed W/b ratio due to its porous feature, high sur- face area and low density. SSA reduces water content and increases the superplasticizer dosage because the mix- ture design method in this study requires that water content and SP be fixed.
30 35 40 45 50 55 60 65
1920 1940 1960 1980 2000
Unit weight (kg/m3)
Fine aggregate contents (%)
Y = -0.1812X2 + 19.201X + 1481.7 R2 = 0.9719
Fig. 2. Relationship of bulk density and blended fine aggregate content in blended aggregate
3. Fresh Properties of HPC with SSA
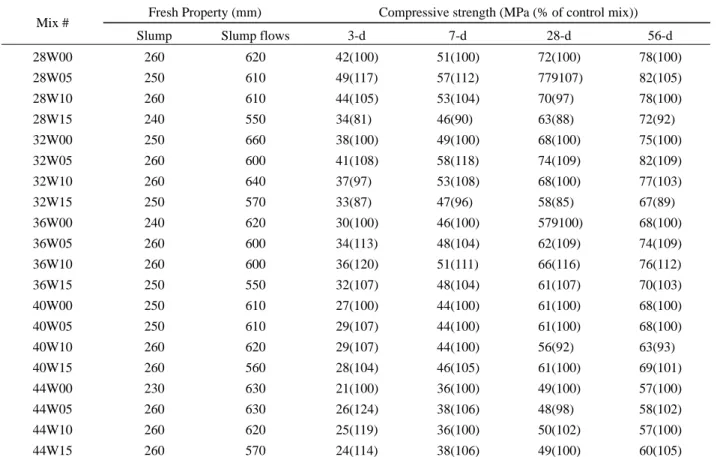
The fresh properties of HPC with different SSA con- tents, expressed as slumps and as slump flows, are re- ported in Table 5 and indicate that the slump is 230-260 mm and the slump flows are 550-660 mm. Adding SSA decreases the slump flow slightly and slump flows can be controlled by adjusting water content and the SP dosage.
For different W/b ratios, the addition of 15% SSA was suitable for achieving excellent workability.
4. Compressive Strength of HPC with SSA (1) The effects of SSA content
Adding SSA slightly improves the compressive strength of HPC, by as much as 10%, as shown in Fig. 5 and Table 5. This finding clearly demonstrates that an appropriate mixture design approach can produce high strength without any difficulties. Moreover, it demon- strates that adding SSA has a smaller effect at W/b = 0.44 than at W/b = 0.36. These test results can be utilized to generate a mixture design data bank for achieving the de- sired strength of HPC with varying SSA contents.
(2) The effects of W/b ratio and age
Fig. 6 shows that the strength of HPC roughly dou- bled from day 3 to 56. In the case of 15% SSA content, the developed strength is very close to that at a W/b ratio of 0.28–0.4, indicating that the high concentration of paste does not contribute to the strength of HPC when a high amount of SSA is added. Comparing the data of Fig. 6(a) and Fig. 6(b), it is concluded that adding SSA decreases the strength of HPC. Hence, SSA content can be varied and combined with different W/b ratios in concrete using a densified mixing proportion at a minimum paste content;
Table 4 Mixture proportion of HPC containing SSA Mixture Proportion (kg/m3) Mix # W/C W/b W/S
Water Cement GBFS SSA Fine aggregate
Coarse
aggregate SP Unit weight 28W00 0.063 130 307 204 0 959 817 13 2431 28W05 0.063 126 302 201 48 913 819 14 2423 28W10 0.063 123 299 199 97 872 825 16 2431 28W15
0.47 0.28
0.064 123 297 198 148 836 838 16 2455 32W00 0.068 141 289 193 0 964 821 13 2421 32W05 0.067 136 280 187 48 904 810 14 2378 32W10 0.066 136 283 188 98 880 833 15 2432 32W15
0.53 0.32
0.065 132 277 184 146 828 830 15 2412 36W00 0.073 153 272 181 0 963 820 10 2399 36W05 0.072 149 268 179 48 919 824 12 2400 36W10 0.071 146 266 177 98 878 831 13 2408 36W15
0.60 0.36
0.070 141 261 174 147 831 833 15 2402 40W00 0.077 162 257 171 0 963 820 9 2382 40W05 0.076 158 253 169 48 918 823 11 2381 40W10 0.075 152 247 164 96 863 816 12 2350 40W15
0.67 0.40
0.074 150 246 164 146 827 829 14 2375 44W00 0.082 170 244 163 0 963 821 8 2369 44W05 0.080 168 240 160 48 919 824 8 2367 44W10 0.072 163 236 157 97 871 825 10 2359 44W15
0.73 0.44
0.078 156 229 153 144 813 815 12 2322
Remark.fine aggregate: SSA= 90:10, with bulk density = 1814 kg/m3
.coarse aggregate: fine aggregate = 47:53, with bulk density = 1987 kg/m3
0 5 10 15
120 130 140 150 160 170 180 190 200
0.28 0.32 0.36 0.40 0.44 (W/b)
Unit water use (kg/m3)
Sewage sludge ash (%)
Fig. 3. Relationship of the water content and SSA content
this preparation will provide relatively good performance at all ages.
For different SSA contents and ages, the desired compressive strength can be achieved by adjusting the
0 5 10 15
0.060 0.065 0.070 0.075 0.080 0.085 0.090
0.28 0.32 0.36 0.40 0.44 (W/b)
W/S
Sewage sludge ash (%)
Fig. 4. Relationship of the w/s ratio and SSA content
W/b ratio. Fig. 7 shows that at day 7, when the W/b ratio was bigger then 0.36, the addition of SSA did not sig- nify-cantly increase HPC strength; however, when the W/b ratio was smaller than 0.36, the optimum SSA content was
Table 5 Compressive strength of HPC with SSA
Fresh Property (mm) Compressive strength (MPa (% of control mix)) Mix #
Slump Slump flows 3-d 7-d 28-d 56-d 28W00 260 620 42(100) 51(100) 72(100) 78(100) 28W05 250 610 49(117) 57(112) 779107) 82(105) 28W10 260 610 44(105) 53(104) 70(97) 78(100) 28W15 240 550 34(81) 46(90) 63(88) 72(92) 32W00 250 660 38(100) 49(100) 68(100) 75(100) 32W05 260 600 41(108) 58(118) 74(109) 82(109) 32W10 260 640 37(97) 53(108) 68(100) 77(103) 32W15 250 570 33(87) 47(96) 58(85) 67(89) 36W00 240 620 30(100) 46(100) 579100) 68(100) 36W05 260 600 34(113) 48(104) 62(109) 74(109) 36W10 260 600 36(120) 51(111) 66(116) 76(112) 36W15 250 550 32(107) 48(104) 61(107) 70(103) 40W00 250 610 27(100) 44(100) 61(100) 68(100) 40W05 250 610 29(107) 44(100) 61(100) 68(100) 40W10 260 620 29(107) 44(100) 56(92) 63(93) 40W15 260 560 28(104) 46(105) 61(100) 69(101) 44W00 230 630 21(100) 36(100) 49(100) 57(100) 44W05 260 630 26(124) 38(106) 48(98) 58(102) 44W10 260 620 25(119) 36(100) 50(102) 57(100) 44W15 260 570 24(114) 38(106) 49(100) 60(105)
1 10 100
20 40 60 80 100
1 10 100
0% 5%
10% 15%
w/b = 0.36
(b) (a) Age (Days)
0% 5%
10% 15%
w/b = 0.44
Compressive strength (MPa)
Fig. 5. Compressive strength growth with W/b ratio of (a) 0.36 and (b) 0.44 under different SSA contents
approximately 5%. An SSA content of 5% increased performance at days 7 and 28, when the W/b ratio was smaller than 0.32. Furthermore, as SSA content reached 15%, the compressive strengths for W/b ratios of 0.28–0.4 became similar, indicating that adding large amounts of SSA significantly reduced HPC strength.
5. SSA Content at Different W/b Ratios
Table 6 and Fig. 8 present the linear relationships of
1 10 100
20 40 60 80 100
1 10 100
0.28 0.32 0.36
0.40 0.44 (W/b) Contents 5%
(a) Age (Days) (b)
0.28 0.32 0.36 0.40 0.44 (W/b) Contents 15%
Compressive strength (MPa)
Fig. 6. Compressive strength growth of HPC with (a) 5%
and (b) 15% SSA under various W/b ratios
W/b ratios and the corresponding SSA content for HPC.
As the W/b ratio is increased, the SSA content increases (R2 = 0.9426). Water typically enhances the reaction of SSA and thus improves strength.
IV. CONCLUSIONS AND SUGGESTION 1. With SSA replacing 9% of the fine aggregate, and
blended fine aggregate occupying 54% of total aggre-
Table 6 SSA contents for various water-to-binder ratios W/b 0.28 0.32 0.36 0.40 0.44 SSA contents (%) 4.9 5.3 9.2 10.8 15.0
0 5 10 15
20 40 60 80
Compressive strength (MPa)
100
0 5 10 15
(a)
0.28 0.32 0.36 0.40 0.44 (W/b) 7 days
(b) Sewage sludge ash (%)
0.28 0.32 0.36 0.40 0.44 (W/b) 28 days
Fig. 7. Relation of SSA contents and Compressive strength at (a) 7-day and (b) 28-day age with dif- ferent W/b ratios
0.28 0.32 0.36 0.40 0.44
0 5 10 15
The sewage sludge ash (%)
20
W/b
Y = 63.675X-13.887 R2 = 0.9426
Fig. 8. Relation of W/b ratio and SSA content
gate, one can obtain the minimum void and a maximum bulk density of blended aggregate.
2. Replacing fine aggregate with appropriate amounts of SSA and adjusting the SP dosage and W/b ratio pro- duces HPC with a high-flow characteristic and the de- sired strength.
3. The amount of SSA in HPC generally increases as the W/b ratio increases. However, excessive amounts of SSA can reduce compressive strength and increase slump loss, especially for high-strength HPC.
4. SSA high performance concrete’s durability and other properties should be interesting and worth while sub- jects of study.
ACKNOWLEDGMENTS
The authors would like to thank the National Science Council of the Republic of China, Taiwan, for financially supporting this research under Contract No. NSC 95-2221- E-151-045.
REFERENCES
1. Wang, K. S., Chiou, I. J., Chen, C. H., and Wang, D.,
“Lightweight Properties and Pore Structure of Foamed Material Made from Sewage Sludge Ash,” Construction and Building Materials, Vol. 19, pp. 627-633 (2005).
2. Wang, K. S., Yu, Y. F., Tsai, C. C., and Yang, C. C., “A Discussion on the Conditions Controlling Factors in Using Sewage Sludge Ash for Fine Aggregate,” Pro- ceedings, 10th session sewage seminar collected papers, pp. 119-127 (2000).
3. Anderson, M., “Encouraging Prospects for Recycling Incinerated Sewage Sludge Ash (ISSA) Into Claybased Building Products,” Journal of Chemical Technology
& Biotechnology, Vol. 77, No. 3, pp. 352-360 (2002).
4. Tzeng, D. H., Pan, S. C., Lee, C. C., and Lee, C.,
“Ground and Improved Sewage Sludge Ash Po and Mortar Properties,” Proceedings, 10th session sewage seminar collected papers, pp. 103-112 (2000).
5. Monzo, J., Paya, J., Borrachero, M. V., and Peris-Mora E., “Mechanical Behavior of Mortars Containing Sew- age Sludge Ash (SSA) and Portland Cements with Different Tricalcium Aluminates Content,” Cement and Concrete Research, Vol. 29, pp. 87-94 (1999).
6. Wang, K. S., Wang, D. W., Chiou, Y. C., and Cheng, C.
R., “A Study on Municipal Sewage Sludge Ash Fine Heat Proof Concrete High Temperature Behavior,”
Proceedings, 11th sewage and water environmental re- cycling seminar collected papers, pp. 181-186 (2001).
7. Wang, K. S., Cheng, C. R., Chiou, Y. C., Lin, Y. T., and Tzeng, C. R., “A Study on Sewage Sludge Ash Light- weight Porous Structure and Heat Conducting Prop- erty,” Proceedings, 17th session waste seminar (2002).
8. Tzeng, D. H., Pan, S. C., and Lee, C., “A preliminary study on sewage sludge ash properties and its applica- tion in cement mortar,” Proceedings, 9th session sew- age seminar collected papers, pp. 239-253 (1999).
9. Tzeng, D. H., Pan, S. C., Lee, C. C., and Lee, C., “Ap- ply Superplasticizer to Improve Sewage Sludge Ash Mortar Properties,” Proceedings, 11th session sewage and water environment recycling seminar collected
papers, pp. 181-186 (2001).
10. Lin, D. F., Lee, J. Y., and Lin, M. Y., “A Study on the Applicability of Sewage Sludge Ash in Glazed Giles,”
Journal of Architecture, No. 46, pp. 103-113 (2004).
11. Hwang, C. L., High performance concrete theory and practice, Jan’s Books (2008).
Manuscript Received: Oct. 23, 2007 First Revision Received: Nov. 27, 2007 Second Revision Received: Jan. 22, 2008 and Accepted: Fab. 13, 2008