Trading Decision Maker: Stock Trading Decision by Price Series Smoothing and Tendency Transition Inference
Hsin-Tsung Peng1, Hahn-Ming Lee2 and Jan-Ming Ho3 Institute of Information Science, Academia Sinica, Taipei, Taiwan1, 3
Department of Computer Science and Information Engineering, National Taiwan University of Science and Technology, Taipei, Taiwan2
{m91150131, hoho3}@iis.sinica.edu.tw, hmlee@mail.ntust.edu.tw2
Abstract
Financial engineering, such as trading decision- making, is a major topic for research and also has commercial applications. The stock price series has a series of change-points, and accurate prediction of its movements is the key to successful trading. However, making correct trading decisions is difficult because of the influence of embedded noise and price fluctuations that confuse the interpretation of stock trends. This paper proposes a novel stock trading method, called the Trading Decision Maker (TDM), based on price series smoothing to reveal important change-points, which reflect changes in stock trends more precisely.
Tendency transition inference is used to identify these important change-points effectively. We demonstrate the usefulness of TDM in evaluating profitability capacity, and prove that its accumulated rate of return performed 199.05% better than other buy-and-hold strategies used by open-ended mutual funds on the Taiwan Stock Exchange Capitalization Weighted Index (TAIEX) from 2001 to 2003.
1. Introduction
The stock market is a complex and dynamic system.
The stock price series, therefore, is inherently noisy, non-stationary and chaotic [1] [2]. Modeling stock market behavior is a challenging task for financial experts because it is always complex, but artificial intelligence techniques [3] [4] can make the task easier.
In recent years, various theories and methods have been developed to help investors earn higher profits.
The stock price series is affected by a mixture of deterministic and random factors [5], and accurate prediction of its movements is the key to successful trading. Although random factors, such as embedded noise, make the stock price series unpredictable,
deterministic factors like political events, institutional investors, foreign investors and governments, have a direct influence on the stock market. Therefore, we can conjecture that there is a series of change-points in stock trends. Obviously, investors want to sell stocks at the top of the range and buy stocks at the bottom of the range within the stock trends [6]. Thus, only a couple of important change-points, which reflect more precisely the changes in stock trends, are the key to helping investors reach their goals.
In this paper, we propose a novel stock trading method, called the Trading Decision Maker (TDM), based on price series smoothing to smooth out price fluctuations. Important change-points are identified through tendency transition inference. The combination of price series smoothing and tendency transition inference will help investors optimize their investment decisions.
The remainder of paper is organized as follows:
Section 2 presents TDM in detail. Section 3 gives the environment and assumptions of the experiments. In Section 4, we conduct an experiment to compare the trading performance of TDM with some open-ended mutual funds from 2001 to 2003. Finally, in Section 5, we present our conclusion.
2. The Trading Decision Maker
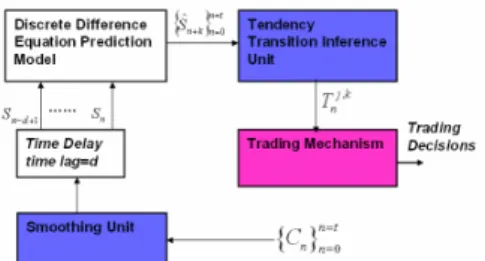
2.1. Architecture of Trading Decision Maker The system architecture of TDM is comprised of four components: namely, the smoothing unit, the Discrete Difference Equation Prediction Model (DDEPM) [7], which is a time series prediction model derived from the grey prediction model, the tendency transition inference unit and the trading mechanism.
The architecture of TDM is shown in Figure 1.
On each trading day n, the smoothing unit reads the closing price Cn and transforms it into the smoothing
value Sn. At the same time, Sn is buffered d time-steps by the time delay block, which saves the smoothing values of the pervious d trading days. TDM uses DDEPM predicts the next k-day’s smoothing value Ŝn+k using the saved smoothing values {Sn, Sn-1, …, Ŝn- d+1}. To identify changes in the stock trend, the tendency transition inference unit uses the predicted results, which cover the period from trading day j in the past to trading day k in the future, to calculate the inference score Tnj k, on trading day n. Finally, the trading mechanism is based on the inference score to make a trading decision for investors.
Figure 1: Architecture of TDM.
2.2. Smoothing Unit
The stock price series has a number of change- points, of which only a few can precisely reflect the changes in stock trends. Most change-points cause embedded noise and price fluctuations, and provide very little information to investors. Furthermore, the information that they do provide can mislead investors about effective stock trading strategies.
It is essential, therefore, to reveal important change- points from the stock price series. Smoothing out price fluctuations and embedded noise will reflect changes in stock trends in the stock price series more precisely, and thereby help investors earn higher profits in the long-term. In order to filter out price fluctuations and embedded noise, we assign a lower weight to each closing price in the stock price series.
The smoothing function based on an exponential moving average curve [8], is defined as follows:
r C r S
Sn = n−1⋅(1− )+ n⋅ , (1) with
) 1 (
2 m
r= + , (2) where Sn is the smoothing value of trading day n, Cn is the closing price of trading day n, r is the weight function and m is the smooth constant.
In Equations (1) and (2), the smoothing function gives the lower weight to the latest closing price Cn
depending on the definition of the smooth constant m
and can be more sensitive in reflecting the stock price changes and emphasizing the direction of stock trends.
2.3. Discrete Difference Equation Prediction Model
By smoothing out the stock price series, each change-point in the smoothing series plays an important role in determining changes in the stock trend. It is essential, therefore, to enhance the prediction performance at the change-points. For this purpose, DDEPM [7] is applied to the prediction module in TDM.
The concept of DDEPM is derived from the grey prediction model, which uses a mathematical hypothesis and approximation to transform a continuous differential equation into a discrete difference equation. We can summarize the properties of DDEPM as follows: 1) It is computationally simple and few data items are needed. 2) It can serve as a chaotic time series prediction problem. 3) It has good prediction performance at change-points.
2.4. Tendency Transition Inference Unit
As mentioned previously, the key to earning high profits in stock trading is to determine a suitable trading decision before the direction of the stock trend changes. Hence, identifying the changes in the stock trend is very important for investors.
We construct an inference function to obtain the position of the smoothing value for the current trading day in a consecutive period. If it appears that the future stock trend will develop strongly in the future, the position of the smoothing value for the current trading day will be near the bottom of a consecutive period, and vice versa. Thus, each investor can adjust the trading strategy based on individual confidence and risk endurance capacity.
The inference function, which is derived from the Williams overbought/oversold index (WMS%R) [9], is defined as follows:
⎪⎪
⎪⎪
⎩
⎪⎪
⎪⎪
⎨
⎧
<
− −
− −
>
− −
−
= + + −
− + =
−
= +−
=
− + +
− + =
−
= +
−
=
otherwise S S S if Min S Max
S Min S
S S S if Min S Max
S S Max
T n k n j
i k n
j n i i k n
j n i
i k n
j n i n
j n k n i k n
j n i i k n
j n i
n i k n
j n i
k j n
0
0 ˆ ) (ˆ ˆ ˆ
ˆ ˆ
0 ˆ ) (ˆ ˆ ˆ
ˆ ˆ
,
, (3) where Tnj,k is the inference score of trading day n, and ranges from 1 to -1; j is the backward scoring range, and k is the forward scoring range.
In Equation (3), the inference score identifies the changes in the stock trend on trading day n. When the stock trends change its behavior in the future, the inference score will be zero, which helps each investor define a trading strategy based on individual confidence and risk endurance capacity.
2.5. Trading Mechanism
The trading mechanism is responsible for generating the trading decision based on the inference score. As mentioned previously, when the inference score is zero, the direction of the stock trend will change in the future. Herein, we introduce the following two concepts to develop our trading mechanism: 1) When
k j
Tn, is zero and Tnj−,1k is greater than or equal to zero, the stock trend is expected to indicate a bearish market in the future; hence, we sell holding stocks and borrow stocks to sell. 2) When Tnj,k is zero and Tnj−,1k is smaller than or equal to zero, the stock trend is expected to indicate a bullish market in the future, so we buy stocks to repay the previously borrowed stocks and buy new stocks using our own money.
3. Setting of Experiments
In our experiments, we use the Taiwan Stock Exchange Capitalization Weighted Index (TAIEX) price series from 1995 to 2003. The experimental data set collected from 1995 to 2000, was used in the parameter selection procedure, while other data collected from 2001 to 2003 was used in the trading performance evaluation of TDM. At the end of the experimental period, the stock held is sold and the accumulated rate of return is calculated together with other trades. To evaluate the trading performance, all the rates of return are calculated after considering the actual transaction cost for each trade.
In the parameter selection procedure, we define d=20 in the time delay block and k=1 in the inference function. In addition, two important parameters need to be selected in the following experiments; one is the smooth constant m, which determines the weight function in the smoothing function; and the other is the backward scoring range j, which determines the backward length of scoring data sequence in the inference function. We define a parameter selection algorithm, which considers the balance between profits and risks, to retrieve the pair of parameters (m, j) as the recommended pair, and finally choose a pair of parameters (30, 1) to evaluate the trading performance.
4. Experiments
The trading performance of TDM was evaluated from January 2001 to December 2003. To assess the trading performance of TDM, the evaluation criteria [10] were taken into the consideration. To prove that TDM can be applied to the real Taiwan stock market, we compare its trading performance on the TAIEX with three open-ended mutual funds that use buy-and- hold trading strategies. The selection procedure is as follows: the open-ended mutual funds, which are equity funds, are ranked by their accumulated rate of return for the period 2001 to 2003, and the top three are selected. The funds selected are: SHINKONG Fu Kuei Fund, SHINKONG Competitiveness Fund and PRESIDENT TRUST SHIN Fund.
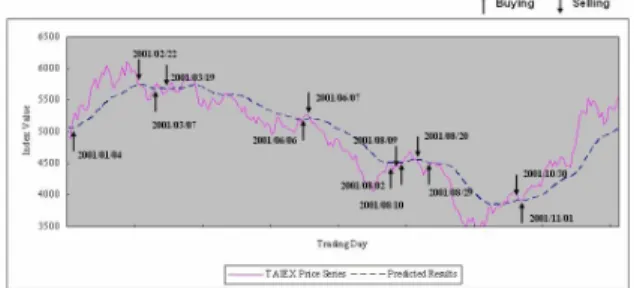
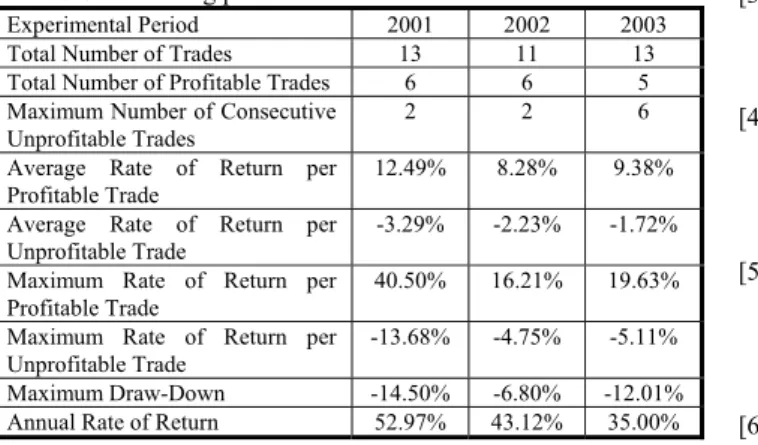
Figures 2, 3 and 4 show the experiment results of buying/selling timing for the period 2001 to 2003. We can see that the buying/selling timing suggested by TDM can help investors identify the changes in the stock trend. To avoid higher losses, TDM revises the wrong trading decisions immediately. For example, when TDM suggested that investors take a long position on 2001/06/06, TDM considered that the future stock trend indicated a bullish trend. However, since the bearish trend lasted until September, TDM revised its suggestion on 2001/06/07 to avoid higher loss. Specifically, in the period 2003/03/18 to 2003/05/23, the TAIEX price series seems to be non- stationary and causes successive losses. As shown in Tables 1, the maximum draw-down is -12.01%
compared to the annual rate of return of 35.00%, which is high enough to cover losses. Finally, Table 2 shows that the accumulated rate of return obtained by TDM is superior to the TAIEX and all the open-ended mutual funds.
Figure 2: Experiment result of buying/selling timing in 2001.
Figure 3: Experiment result of buying/selling timing in 2002.
Figure 4: Experiment result of buying/selling timing in 2003.
Table 1: Trading performance evaluation of TDM
Experimental Period 2001 2002 2003 Total Number of Trades 13 11 13 Total Number of Profitable Trades 6 6 5 Maximum Number of Consecutive
Unprofitable Trades
2 2 6 Average Rate of Return per
Profitable Trade
12.49% 8.28% 9.38%
Average Rate of Return per
Unprofitable Trade -3.29% -2.23% -1.72%
Maximum Rate of Return per
Profitable Trade 40.50% 16.21% 19.63%
Maximum Rate of Return per Unprofitable Trade
-13.68% -4.75% -5.11%
Maximum Draw-Down -14.50% -6.80% -12.01%
Annual Rate of Return 52.97% 43.12% 35.00%
Table 2: Comparison of TDM with mutual funds based on the accumulated rate of return from 2001 to 2003
Comparative Units Accumulated Rate of Return
TDM 199.05%
SHINKONG Fu Kuei Fund 128.46%
SHINKONG Competitiveness Fund 78.89%
PRESIDENT TRUST SHIN Fund 70.70%
TAIEX 24.30%
5. Conclusion
In this paper, we have proposed the Trading Decision Maker (TDM), based on price series smoothing, to reveal important change-points in the stock price series; and tendency transition inference to
identify these important change-points effectively. We assume that the important change-points reflect the changes in the stock trend more precisely; in other words, profits in the long-term will be kept in the stock price series between successive important change- points. Identifying these important change-points will help investors make profitable trading decisions by selling at the top of the range and buying at the bottom of the range within the stock trends. Experiment results show that TDM can help investors earn high profits in the long-term. It also has a higher trading performance than the open-ended mutual funds used in the benchmark.
In the future, we will continue to refine TDM, including the design of parameter selection algorithm and trading mechanism for short-term investment.
References
[1] S.A.M. Yaser and A.F. Atiya, “Introduction to financial forecasting,” Appl. Intell., pp. 205-213, 1996.
[2] C. Klimasauskas, “Basics of building market timing systems: Making money with neural networks,”
Tutorial at IEEE World Conger. Comput. Intell., Orlando, FL, 1994.
[3] A.F. Shapiro, “Capital Market Applications of Neural Networks, Fuzzy Logic and Genetic Algorithms,” In Proceedings of the 13th International AFIR Colloquium, vol. 1, pp. 493-514, 2003.
[4] R.S.T. Lee, “iJADE stock advisor: an intelligent agent based stock prediction system using hybrid RBF recurrent network,” IEEE Transactions on Systems, Man and Cybernetics, Part A, vol. 34, no. 3, pp. 421- 428, May 2004.
[5] E.W. Saad, D.V. Prokhorov and D.C. Wunsch, II,
“Comparative Study of Stock Trend Prediction Using Time Delay, Recurrent and Probabilistic Neural Networks,” IEEE Transactions on Neural Networks, vol. 9, no. 6, pp. 1456-1470, November 1998.
[6] G.A. Torben and J. Lund, “Estimating continuous-time stochastic volatility models of the short-term interest rate,” Journal of Econometrics, vol. 77, pp. 343-378, 1997.
[7] C.M. Chen and H.M. Lee, “An Efficient Gradient Forecasting Search Method Utilizing the Discrete Difference Equation Prediction Model,” Applied Intelligence, vol.16, pp. 43-58, 2002.
[8] M.J. Pring, Technical Analysis Explained, Third Edition, New York: McGraw-Hill, 1991.
[9] P.J. Kaufman, The New Commodity Trading Systems and Methods, Wiley, New York, 1987.
[10] C.C. Yang, C.H. Chan and F. Lai, “A rule-based neural stock trading decision support system,” In Proceedings of the IEEE/IAFE 1996 Conference on Computational Intelligence for Financial Engineering, pp. 148 –154, March 1996.


