國立臺灣大學管理學院資訊管理學研究所 碩士論文
Graduate Institute of Information Management College of Management
National Taiwan University Master Thesis
行動應用程式使用者轉移使用延伸應用程式影響因素之研究 Factors of Mobile Application User Transferring to
Use Extended Application
謝慈恩 Tzu-En Hsieh
指導教授:曹承礎 博士 Advisor: Seng-Cho T. Chou, Ph.D.
中華民國 102 年 7 月
July, 2013
i
誌謝
本論文的育成要感謝很多人的幫助,首先要感謝我的指導教授 曹承礎博士。
若不是曹老師在我研究過程中適時地提供其獨到創新的見解,並勉勵我在研究中 應突破窠臼、創造亮點,及教導我要有所取捨,我想我的研究終究也只會被侷限 在我最初單純的研究動機以及研究的框架之下,而無法取得現有的成果。
由衷感謝口試委員 王貞雅老師在我撰寫論文的過程中,不厭其煩地幫我解 惑及不斷地為我打氣,並細心地審閱論文後加以指正,使我能順利地完成研究並 通過論文考試。並特別感謝口試委員 陳文國老師以其專業領域之知識提出諸多 寶貴的建議,並在考試的過程中始終對我的研究方向表達支持,對我來說是很大 的鼓勵。
感謝所有同甘共苦的實驗室夥伴:陳陳、aiko、容萱、小腹、小力與美欣。那 些日子裡一起蹲實驗室寫論文、有疑難一起找尋解決辦法、有困惑一起分享情報、
有食物一起分享、有壓力一起抒發,口試時也一起面對、互助合作,我想我們真 的不愧是感人溫馨的 KMLab。
謝謝所有同樣身為碩二,互相加油打氣、從大學一路走來的好同學們、陪我 度過很多美好時光的籃球球友們,我的碩士時光因你們而美好;以及所有幫助我 完成問卷,認識與不認識的人們,沒有你們我就無法順利完成我的論文。特別要 感謝陪我度過編寫論文初稿及論文口試階段的工友,謝謝妳的包容與無微不至的 照顧。
最後我要感謝我的家人,我的爸爸、媽媽與姐姐。沒有你們的鞭策、鼓勵、
期望與傾聽,我沒有辦法熬過一些艱難的時刻,謝謝你們。
ii
中文摘要
在行動應用程式市場的競爭持續白熱化之下,行動應用程式供應商的生存也 越來越艱難。一旦一個行動應用程式爬上了熱門排行榜的頂端,幾天後它可能就 掉出排行榜,而它所累積的人氣與使用者也因為沒有善加利用在推廣同供應商的 下一個行動應用程式產品而淪為無用。為了幫助這些行動應用程式供應商能抓住 行動應用程式市場所提供的大好機會,本研究致力於理解哪些因素能有助於原行 動應用程式的使用者增加採用同供應商開發的新應用程式的意圖。
研究發放的網路問卷根據分類理論及與影響行動應用程式採用因素相關的前 人研究所設計,使用行動通訊應用程式作為親代行動應用程式,行動照相應用程 式及行動遊戲應用程式作為延伸行動應用程式。總共回收了 253 份有效問卷,這 些問卷提供了 506 個樣本以供分析。
分析結果顯示不只親代行動應用程式的知覺品質,連親代行動應用程式的知 覺有用性也可被移轉至延伸行動應用程式上。甚至,親代行動應用程式及延伸行 動應用程式之間的知覺配適度也對知覺品質及知覺有用性的移轉有顯著且正面的 影響。
本研究進一步地驗證了分類理論在研究行動應用程式方面的應用,並且對使 用者在同一行動程式供應商所提供的應用程式之間的知覺行為有更深的認識。除 此之外,根據研究結果也建議在實務上更重視知覺有用性在知覺意圖移轉上的重 要性。
關鍵詞:行動應用程式;分類理論;知覺移轉;知覺有用性;知覺品質;知覺配 適度
iii
ABSTRACT
As the competition in the mobile app market continues to rise, the survival of the developers became harder. Once an app climbs up to the top of the leaderboard, it came down really quickly, and the popularity it once owns is hard to generate value for the next released app provided by the same developer. To help the developer seize the promising opportunity of the mobile app market, this research aims at realizing what kind of factors will influence the user of the original mobile app intending to adopt the new extended app.
An online survey based on the previous studies using categorization theory and technology acceptance model was conducted using a messenger app as the parent app and a camera app and gaming app as the extended apps. A total of 253 validate respondents was received, which yielded 506 samples to analysis.
The results indicate that not only perceived quality but also perceived usefulness of the parent app can be transferred to its extensions. Furthermore, the perceived fit between the parent app and the extended apps has significant positive influence on perceived quality and perceived usefulness of the extensions.
This study further confirms the application of categorization theory in the context of mobile app and improves deeper understanding of the user behavior between mobile
iv
apps provided by the same developer. In addition, findings of the research suggest the importance of perceived usefulness in usage intention transfer in practical use.
Keywords: Mobile app; Categorization theory; Perception transfer; Perceived usefulness; Perceived quality; Perceived fit
v
CONTENTS
誌謝 ... i
中文摘要 ... ii
ABSTRACT ... iii
CONTENTS ... v
LIST OF FIGURES ... vii
LIST OF TABLES ... viii
Chapter 1 Introduction ... 1
1.1 Background and Motivation ... 1
1.2 Research Purpose and Scope ... 6
1.3 Research Process ... 7
Chapter 2 Literature review... 10
2.1 Mobile Application ... 10
2.2 Categorization Theory ... 11
2.2.1 Evaluation of extended product based on Categorization Theory .. 12
2.2.2 Application of Categorization Theory ... 14
2.3 Factors Related with Mobile App Adoption ... 15
Chapter 3 Research Approach ... 19
3.1 Research Model ... 19
3.2 Variable Definition and Research Hypotheses ... 20
3.2.1 Perceived Quality and Perceived Usefulness ... 20
3.2.2 Perceived Fit and Perceived Tie ... 22
3.2.3 Behavior Intention ... 25
3.3 Research Design ... 26
vi
3.3.1 Measurement of the constructs ... 26
3.3.2 Data Collection ... 31
3.3.3 Analysis Method ... 34
Chapter 4 Analysis and Results ... 35
4.1 Demographic Statistic ... 35
4.2 Measurement Model ... 39
4.2.1 Individual Item Reliability ... 39
4.2.2 Convergent Validity ... 41
4.2.3 Discriminant Validity ... 42
4.3 Structural Model ... 44
4.3.1 Explanatory Power of the Structural Model ... 44
4.3.2 Validation of the Structural Model ... 48
4.4 Supplemental Analysis ... 51
Chapter 5 Discussion and Conclusion ... 57
5.1 Discussion of Findings ... 57
5.2 Implications ... 60
5.3 Limitations and Future Research ... 62
5.4 Conclusion ... 63
REFERENCE ... 65
Appendix A. Questionnaire ... 75
vii
LIST OF FIGURES
Figure 1-1 Research process ... 8
Figure 2-1 Model proposed by (Song et al., 2010) ... 14
Figure 3-1 Research Model ... 19
Figure 3-2 Analysis flowchart ... 34
Figure 4-1 Results of PLS-SEM analysis ... 50
Figure 4-2 Results of PLS-SEM analysis in original model ... 52
Figure 4-3 Results of PLS-SEM analysis in lower 27% group of perceived fit ... 53
Figure 4-4 Results of PLS-SEM analysis in upper 27% group of perceived fit ... 54
Figure 4-5 Results of PLS-SEM analysis with LINE Camera as extension ... 55
Figure 4-6 Results of PLS-SEM analysis with LINE POP as extension ... 56
viii
LIST OF TABLES
Table 1-1 Summary of existing studies of m-service adoption ... 5
Table 2-1 Existing studies of perceived usefulness as factor of m-service adoption ... 16
Table 3-1 Survey item design ... 28
Table 3-2 Pre-test analysis result ... 31
Table 4-1 Demographic distribution of sample respondents ... 37
Table 4-2 Gender distribution of early and late respondents ... 38
Table 4-3 Education level distribution of early and late respondents ... 38
Table 4-4 Age distribution of early and late respondents ... 38
Table 4-5 Usage rate of the parent app and the extended app ... 39
Table 4-6 Construct loadings ... 40
Table 4-7 Convergent validity ... 41
Table 4-8 Construct correlations ... 44
Table 4-9 R2 value of dependent construct ... 45
Table 4-10 Results of effective size (f2) analysis... 47
Table 4-11 Results of structural model ... 49
Table 4-12 Direct and indirect effects between constructs ... 51
1
Chapter 1 Introduction
1.1 Background and Motivation
As the user number of smartphone and smart device constantly rises up, the number of mobile application provider and mobile application (app) in different categories has also risen up tremendously. In the report of Mary Meeker and Liang Wu, 2012 KPCB Internet Trends Year-End Update and KPCB Internet Trends 2013, pointed out the following statistics of smart phone and smart device. Up to 2013 May, the number of global smartphone subscriber has grown to 1.5 billion with growth rate at 31%, and only accounts 21% of global mobile phone subscriber. There was 29% of adults in USA owns tablet/eReader until 2012, while there was less than 2% in 2009.
The global mobile traffic has grown to 15% of global internet traffic in 2013, growing 1.5 times per year, whereas the global mobile traffic was only 1% of global internet traffic in 2009. In India, the mobile traffic has surpassed traditional computer traffic in the second half of 2009. The amount of global mobile device, including smart phone and tablet, will surpass the amount of traditional computer, including desktop computer and notebook, in the second quarter of 2013. The revenue produced by global mobile App, including charge app and advertising revenue, has grown from 700 million USD in 2008 to 19 billion USD in 2012 (Mary Meeker & Liang Wu,
2
2012, 2013). According to the news from emgadget.com, the amount of mobile app of the top two popular mobile app platforms, Google play, used to call Android market, and App store had reached 700,000 in October 2012 and 900,000 in June 2013 separately, and both platforms are considered to hit 1 million apps in 2013, despite the fact that both platforms were established in less than 5 years ago (Steve Dent, 2012; Sharif Sakr, 2013; McCarra, 2013).
Although the above data shows that developing mobile app is promising, however, among the successful minority of all mobile apps, which attract vast amount of mobile users, many often get to the top in just one night, and then fall to the bottom the next morning. For example, the entertainment app, Draw Something, once had 1.2 million downloads in 10 days, 12 million downloads in 1 month, 20million downloads in 5 weeks, 100 million draws and 15 million active user per day in just few month, and 250 thousand USD revenue per day when there was a fever for it in first half of 2012, but then a year passed and the fever was gone, even if Draw Something 2 was released, the team of Draw Something was still dismissed (Sean Hollister, 2013; 夔蒽, 2013). Yet in another different example, the team manages to keep their popularity. Angry Birds, an entertainment app launched in 2010 by Finland developer, Rovio, and its team continues to release its serial app, Bad Piggies, Angry
3
Birds: Star Wars and the upcoming new app, Angry Birds Go!(Francisco & London, 2013; “Angry Birds Go,” 2013). They success in maintaining their popularity and
preserve their achievement in the initial Angry Birds app, which is seldom seen in the mobile app market. Generally, mobile app users won’t remember the mobile app provider and only have some vague impression of the content and the name of the mobile app, and when the mobile app provider launch a new mobile app with a new look, they have to make the users rediscover the app without effectively using the good image they already built or the familiar users they already have in their original mobile app. So even if the original app was a great success with a lot of users, it may not drive the user number of the newly developed app.
In the related field of academic research, there has been a lot of studies focus on the adoption or continuous use of mobile service, and also on the user readopt or rebuy intention in the context of e-commerce or m-commerce (Table 1-1). In spite of the immense interest in the mobile device research field, few studies have aimed at discussing the transfer of existing achievement of original mobile app to the next mobile app. One of the unique studies is the work of Wang and Li (2012), which explore mobile services adoption from a brand-equity perspective. In the studies, they concentrated on the factors which can improve the brand-equity of the mobile service,
4
because they believe that to transform the value of the mobile service into the value of the brand can make consumers buy things from the brand next time. Another study from Song, Zhang, Xu and Huang (2010) in the context of web service, however, concentrated on the factors that influence the transfer of the value from parent brand to its extension, but there are several differences between conventional web service and mobile service. According to some researches, mobile service has certain distinctive characteristic, which can derive value like ubiquity, personalization, flexibility, dissemination, usability, identifiability, and perceived enjoyment, and those value are not available in traditional wired e-commerce (Wei-Tsong Wang & Hui-Min Li, 2012;
Yi-Shun Wang, Hsin-Hui Lin, & Pin Luarn, 2006; Scharl, Dickinger, & Murphy, 2005a;
Mahatanankoon, Wen, & Lim, 2005; Siau, Lim, & Shen, 2001). And another major difference is that adopting a mobile app unlike adopting a web service because the former might require user to consider whether the space of their smartphone is enough for the app to occupy or whether the transmission quantity required for downloading the app surpass the user’s remain amount of their limit transmission quantity, according to their contract with their telecom provider. Since people may make different judgment in such different contexts, mobile and conventional web environment, this research examines the model proposed by Song, Zhang, Xu and Huang in mobile environment
5
and makes changes if necessary.
To make the mobile app providers to survive or even strengthen their competitiveness in a market environment so full of opportunity yet having intense competition, this
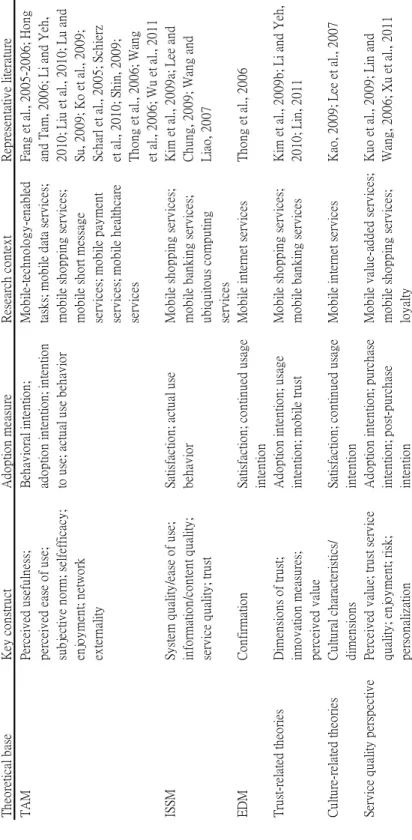
Theoretical baseKey constructAdoption measureResearch contextRepresentative literature TAMPerceived usefulness;Behavioral intention;Mobile-technology-enabledFang et al., 2005-2006; Hong perceived ease of use;adoption intention; intentiontasks; mobile data services;and Tam, 2006; Li and Yeh, subjective norm; selfefficacy;to use; actual use behaviormobile shopping services;2010; Liu et al., 2010; Lu and enjoyment; networkmobile short messageSu, 2009; Ko et al., 2009; externalityservices; mobile paymentScharl et al., 2005; Schierz services; mobile healthcareet al., 2010; Shin, 2009; servicesThong et al., 2006; Wang et al., 2006; Wu et al., 2011 ISSMSystem quality/ease of use;Satisfaction; actual useMobile shopping services;Kim et al., 2009a; Lee and information/content quality;behaviormobile banking services;Chung, 2009; Wang and service quality; trustubiquitous computingLiao, 2007 services EDMConfirmationSatisfaction; continued usageMobile internet servicesThong et al., 2006 intention Trust-related theoriesDimensions of trust;Adoption intention; usageMobile shopping services;Kim et al., 2009b; Li and Yeh, innovation measures;intention; mobile trustmobile banking services2010; Lin, 2011 perceived value Culture-related theoriesCultural characteristics/Satisfaction; continued usageMobile internet servicesKao, 2009; Lee et al., 2007 dimensionsintention Service quality perspectivePerceived value; trust serviceAdoption intention; purchaseMobile value-added services;Kuo et al., 2009; Lin and quality; enjoyment; risk;intention; post-purchasemobile shopping services;Wang, 2006; Xu et al., 2011 personalizationintentionloyalty
Table 1-1 Summary of existing studies of m-service adoption (W.-T. Wang & Li, 2012)
6
research aims at studying the factors which may increase the transfer of good image and users from original mobile app to newly developed mobile app, helping the app provider to get competitive advantage in developing new apps.
1.2 Research Purpose and Scope
Based on the motivation mentioned before, this research aims at realizing what kind of perception factor between the original and new mobile app, which both come from the same mobile app provider, will influence the user of the original mobile app to adopt the new mobile app. It should be noted that this research mainly focus on preserving the good achievement from the original mobile app and transferring it to the new app, but not reversing or reducing any negative impression of original mobile app so that the new app can get better popularity or more downloads.
It is to be expected that this research can contribute to both industry and academic world. For the mobile application industry, if the mobile app provider could grasp and employ the factor that can successfully transfer the user of the original mobile app to the new one, then maybe it can ensure the basic market share of the new mobile app without having to spend extra cost to popularize the app to the user they already knew, and reach the goal of saving marketing cost, increasing profit, and becoming more sustainable in this world where users like the new and hate the old, and from the
7
perspective of the mobile app user, they can adapt to the new mobile app faster and reduce the search cost for the mobile app they might like, so it is a win-win situation.
Academically, this research can further expand the not yet fully develop field of user behavior toward mobile app. The related system usage research started to became primary in IS research in 1970s and has been developing till now, but only few has consider different products as interrelated bundle, which because that the adoption of one product may rely on the adoption or user experience of another (Song, Zhang, Xu,
& Huang, 2010), and this study can provide yet another complement to this area.
Overall, this research can give a different perspective to the use of user assets, hoping to improve the development of related academic and industries.
1.3 Research Process
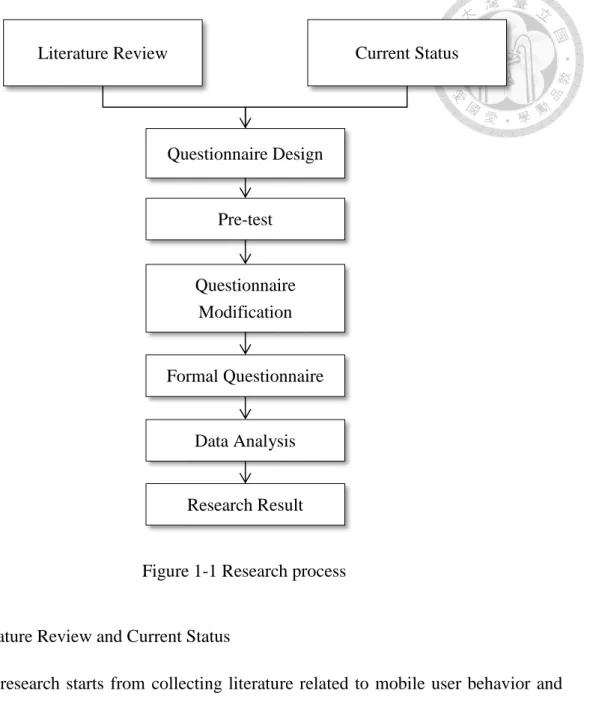
As shown in Figure 1-1, the first step of this research is to collect and review literature and current status related to mobile user behavior and mobile app market, for determining the research model and data source, and designing effective questionnaire scale to disseminate to the object. Finally, collect the questionnaire results and analysis it with structural equation modeling (SEM) to get research result.
8
Figure 1-1 Research process
1. Literature Review and Current Status
This research starts from collecting literature related to mobile user behavior and investigate current status of mobile app market. Related literature includes papers which studies m-commerce, e-commerce and system usage and technique related to questionnaire scale design. Current status includes the development, app categories and number, popularity, etc. of the market.
Literature Review Current Status
Questionnaire Design
Pre-test
Questionnaire Modification
Formal Questionnaire
Data Analysis
Research Result
9
2. Questionnaire
Following the first step, according to the factor construct from the literature review to build the research model and hypothesizes, and design corresponding questionnaire from the questionnaire items collected from the literature review. After pre-test, which includes item analysis and reliability analysis, the questionnaire was modified and the
formal survey was conducted.
3. Data Analysis and Result
Next, collect the results of distributed questionnaire, and analysis the data collected with SPSS 16 and with SmartPLS 2.0 using PLS-SEM technique to test the research hypothesizes. Finally, organize the analysis results and reach the purpose of this research.
10
Chapter 2 Literature review
In the following sections of literature review will discussed the context of this research, i.e. mobile application, and the main theory used in this research, i.e.
categorization theory, and extracted mobile app adoption related factors from existing researches in sequence.
2.1 Mobile Application
Mobile application (app)-refers to software application which runs on mobile
device including smartphone, tablet PC, iTouch, etc. Usually distribute by application platforms like App Store and Google Play, on which full of mobile app providers who develop the apps and release them on the platform. For applying the mobile app, user has to download it from the platforms, some of which are chargeable while others are free and only has the user bear the transmission fee (“Mobile app,” 2013). There are all sorts of mobile app available now, categorizing from Business, Education, Entertainment, Family & Kids, Finance, Food & Drink, Games and Health & Fitness to Lifestyle, Music, Mews, Photo & Video, Productivity, Social Networking, Sports and Travel(“Apple-iPhone 5 - Learn about apps from the App Store.,” 2013).
Since 1999 when mobile phone first provides the function of internet access, the ecosystem of mobile service has been continuing in developing. Before the smart phone appears on the market, the old type of mobile phone acquire users to join in an
11
m-service group (e.g. i-Mode) supported by a telecommunication company to access variety of m-service, including email, music, animation, shopping, news, game, stock market, ticket, fortune-telling, personals, book, auction, m-banking, etc. (Yi-Shun Wang et al., 2006). And then, the first app was added to the App Store in 2008. The initial purpose of mobile apps was general productivity and information retrieval, such as email, calendar, contacts, stock market information and weather information, but as the public demand rise, plus the availability of the development tool for app, the categories grown to the scale mentioned in previous paragraph. Because of the number and categories of mobile app has rapidly expanded, causing trouble for users to search
required app, multi-type of media have offer the service of commenting the mobile app (“Mobile app,” 2013).
2.2 Categorization Theory
Categorization is the process by which object is recognized, differentiated, and understood by our mind. To handle the explosion of information confronted every day, people cluster things and objects, which share some perceived similarity, into categories to simplify the complex world, so the people can function more effectively (Ozanne, Brucks, & Grewal, 1992; Rosch, 1975; Song et al., 2010). This research uses the theory of categorization to try to understand whether the achievement of original mobile app
12
can be transfer to its extension app somehow for the following reasons. First, categorization is fundamental in human inference and decision making, which can explain the situation when user adopts the extend mobile app considering the good experience or impression with its parent app (Song et al., 2010). Second, the extension mobile app can be assumed as a new instance which has some similarity with the parent app and awaits the process of categorization. Last but not least, the mobile app provider often use the parent app as a promotion platform for the extended app, like advertising for extended app, providing download link and discount, and designing all sorts of interaction between parent app and extended app which can benefit the users. And from the perspective of users, the more the interaction between the apps, the more likely they will assume the apps are associated with each other.
2.2.1 Evaluation of extended product based on Categorization Theory
The earliest concept of categorization can be traced back to the work of Greek philosophers, Plato and Aristotle, who introduces the approach of grouping objects
based on their similar properties and further explore and systemized the approach (“Categorization,” 2013). In modern times, this concept has been developed to explain
how people evaluate extended product initially. Researches indicate that evaluation toward extended product can be formed in at least two ways, according to whether the
13
extended product is perceived as similar to the existing product or not (Aaker & Keller, 1990; Boush & Loken, 1991). If the extension is perceived as dissimilar to existing one, then an evaluation based on a function composed of some specific attribute is invoked, which termed “analytical,” “piecemeal,” or “computational.” On the other hand, if perceived as similar, a categorization process is invoked, that is, the extension is viewed as belonging to the category which includes the existing product, and the evaluation related to the category can be transferred to the extension (Boush & Loken, 1991; Song et al., 2010). And there are two different two-step evaluation process are proposed by previous research. One of them is proposed by (Fiske, S. T. & Pavelchak, M. A., 1986), in which the first step is to match the new object with existing category, if there is a match, then a categorization process is launched, otherwise a piecemeal process is launched. Another one, proposed by (Smith, Shoben, & Rips, 1974), is that the first step is also doing match. When a clear match or clear mismatch is made, a categorization process is launched, but if some of the feature match and some do not, a second stage of evaluation is invoked and a piecemeal process is launched, but a more careful comparison to the existing category is also launched. With a mention, research shows that a more category based evaluation process is faster than a more piecemeal based evaluation process, and the second process indicate that the reason why it is faster is
14
because a more piecemeal based process involves two stages of evaluation(Ozanne et al., 1992; Sujan, 1985).
2.2.2 Application of Categorization Theory
There has been a long history of the development and application of categorization theory. A lot of empirical research in the social psychology (Fiske, S. T. & Pavelchak, M.
A., 1986; Smith et al., 1974) and marketing discipline (Boush & Loken, 1991; Sujan &
Dekleva, 1987; Sujan, 1985) has been established, and hence the validity of the categorization theory has been empirically confirmed in various marketing contexts (Song et al., 2010). Some of the research in marketing discipline has applied categorization theory in examining consumers’ attitudes toward brand extensions (Aaker & Keller, 1990; Boush & Loken, 1991; Song et al., 2010).
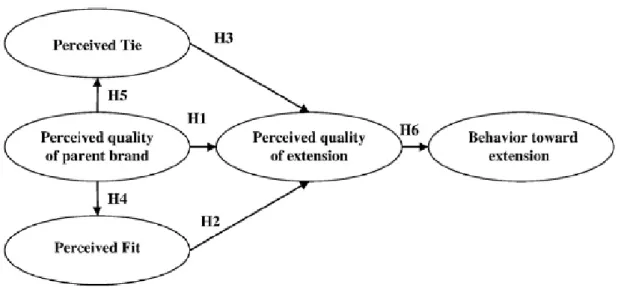
Figure 2-1 Model proposed by (Song et al., 2010)
(Song et al., 2010) proposed a model (Figure 2-1) to understand the brand
15
extension in the traditional online context. Their research employs categorization theory and attempt to realize the factors which determine the popularity of extended online product. The model was examined in the context of web search engine and its extension to a virtual community service and online news service. The result of the research shows that perceived quality of a parent brand can be transferred to its extensions, and perceived fit and perceived tie between the parent brand and extension have a positive influence on the perceived quality of the extension. The present study will validate this model in a mobile app context and modify the model if there’s a chance that can make the model more fit in this specific context of mobile app.
2.3 Factors Related with Mobile App Adoption
The extended mobile app can be viewed as a new information service to the parent app users. According to Technology Acceptance Model (TAM) (Davis, 1989), user’s behavioral intention toward use will eventually lead to actual system usage, and because of the differences of people, mission, system and organization in different technology or information system, the factors which influence the intention could change in different contexts, so it is important to figure what factors might influence the adoption of mobile app extension in order to modify the categorization theory-based model so it can be more fit in current research context.
16
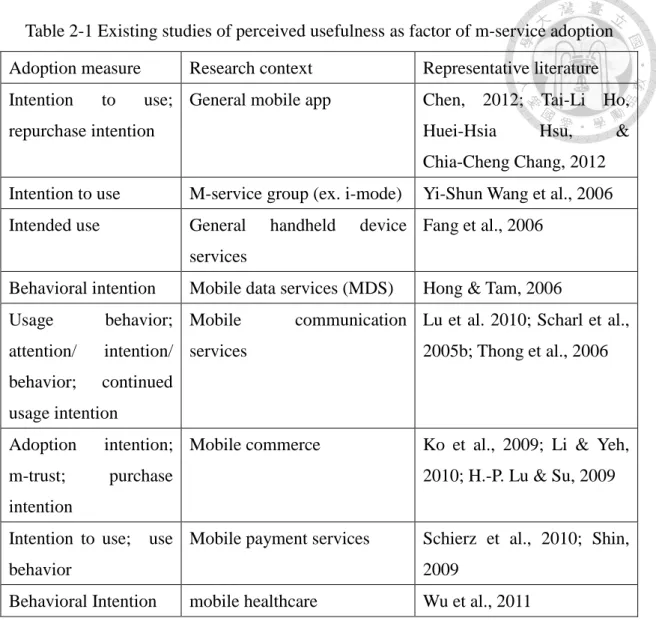
Table 2-1 Existing studies of perceived usefulness as factor of m-service adoption
As the competition of mobile app market becomes more intense, the research associated to adoption of mobile services has continuous in thriving regardless of frontiers. Mentioned in the categorization based model proposed by (Song et al., 2010), perceived quality is a crucial factor in transferring the achievement of parent product to the extended product, likewise, it is also an important factor in a TAM based model. In the research of (Wei-Tsong Wang & Hui-Min Li, 2012), perceived quality is confirmed to have significance positive influence on purchase intention in the context of mobile
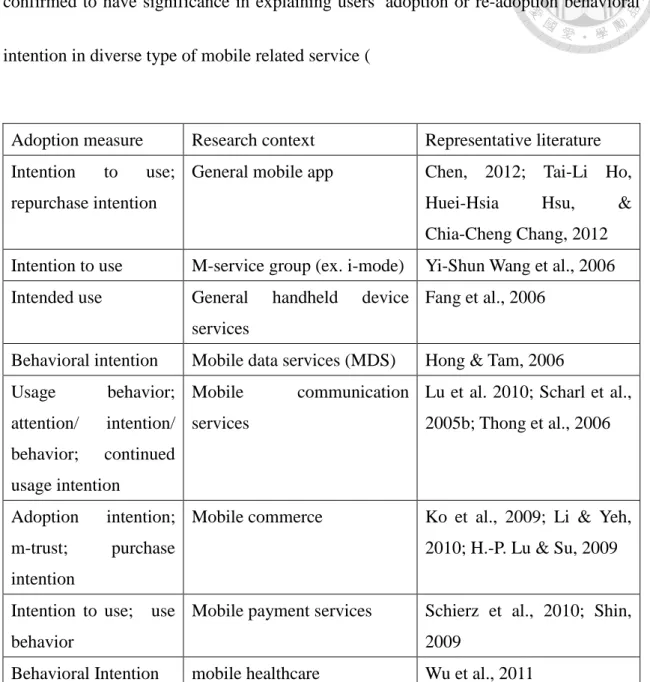
Adoption measure Research context Representative literature Intention to use;
repurchase intention
General mobile app Chen, 2012; Tai-Li Ho, Huei-Hsia Hsu, &
Chia-Cheng Chang, 2012 Intention to use M-service group (ex. i-mode) Yi-Shun Wang et al., 2006 Intended use General handheld device
services
Fang et al., 2006
Behavioral intention Mobile data services (MDS) Hong & Tam, 2006 Usage behavior;
attention/ intention/
behavior; continued usage intention
Mobile communication services
Lu et al. 2010; Scharl et al., 2005b; Thong et al., 2006
Adoption intention;
m-trust; purchase intention
Mobile commerce Ko et al., 2009; Li & Yeh, 2010; H.-P. Lu & Su, 2009
Intention to use; use behavior
Mobile payment services Schierz et al., 2010; Shin, 2009
Behavioral Intention mobile healthcare Wu et al., 2011
17
value-added service consumption. However, perceived usefulness has also been confirmed to have significance in explaining users’ adoption or re-adoption behavioral intention in diverse type of mobile related service (
Table 2-1). Therefore in current research perceived usefulness will be added to the model considering its influence on mobile service related adoption. On the other hand, according to (Fang et al., 2006), another factor in classic TAM, perceived ease of use, remains controversial to its relationship with users’ behavioral intention toward
Adoption measure Research context Representative literature Intention to use;
repurchase intention
General mobile app Chen, 2012; Tai-Li Ho, Huei-Hsia Hsu, &
Chia-Cheng Chang, 2012 Intention to use M-service group (ex. i-mode) Yi-Shun Wang et al., 2006 Intended use General handheld device
services
Fang et al., 2006
Behavioral intention Mobile data services (MDS) Hong & Tam, 2006 Usage behavior;
attention/ intention/
behavior; continued usage intention
Mobile communication services
Lu et al. 2010; Scharl et al., 2005b; Thong et al., 2006
Adoption intention;
m-trust; purchase intention
Mobile commerce Ko et al., 2009; Li & Yeh, 2010; H.-P. Lu & Su, 2009
Intention to use; use behavior
Mobile payment services Schierz et al., 2010; Shin, 2009
Behavioral Intention mobile healthcare Wu et al., 2011
18
information system, since some of the researches report that perceived ease of use has directly influence on intention of information system use while some of researches do not. Likewise, although some of the researches indicate that perceived enjoyment or perceived playfulness to be a factor which influences mobile app adoption, but it mainly affect the gaming type of mobile app. And because of the trend of free app, free trial app or limit free app in App Store and Google Play, and the nature of mobile app which lack of binding contract, price related factors, such as perceived price, perceived credibility are not suitable in the study context of mobile app. Thence in current study these factors, perceived ease of use, perceived enjoyment and perceived price, won’t present in the model.
19
Chapter 3 Research Approach
3.1 Research Model
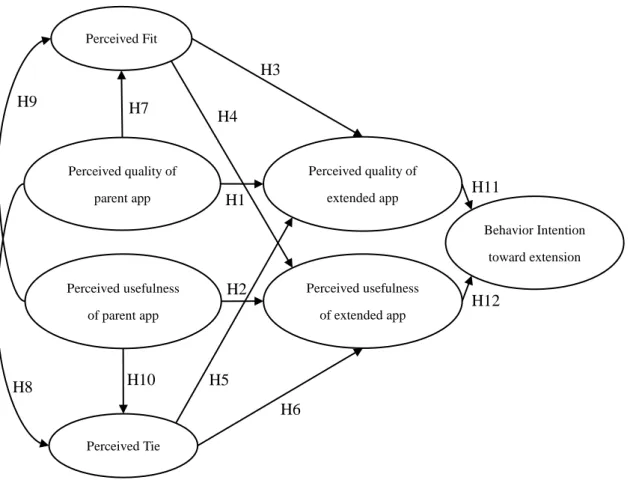
In last chapter, related literature was reviewed and based on the result of the review, a research model describing parent app transferring positive image to extended app is presented in Figure 3-1.
Figure 3-1 Research Model
This model is adapted from the model proposed by (Song et al., 2010) for present study context of mobile app extension, and can be better understood with reference to their simpler single cognitive factor model mentioned in previous sections (Figure 2-1).
Perceived quality of parent app
Perceived quality of extended app
Behavior Intention toward extension
Perceived usefulness of parent app
Perceived usefulness of extended app Perceived Fit
Perceived Tie
H2
H5
H6 H3 H7 H4
H9
H8 H10
H11
H12 H1
20
Compare to the original model, there are several differences in this model. First, there is an extra cognitive factor, perceived usefulness, because earlier studies with refer to last chapter suggested that perceived usefulness is an important factor in mobile app adoption. Another difference is that this research replaces the original construct, behavior toward extension, with behavior intention toward extension, and the reason is that from TAM it can be seen that behavioral intention toward use will eventually lead to actual system usage. From overall perspective, this model attempts to combine the research achievements of categorization theory and other existing researches, and to implement the function, explaining the relationship between two different systems, of the original model in mobile app context.
3.2 Variable Definition and Research Hypotheses
3.2.1 Perceived Quality and Perceived Usefulness
Perceived quality has been the basis of global customers’ judgment toward all kinds of products (Hwang & Kim, 2007; Song et al., 2010; Wei-Tsong Wang & Hui-Min Li, 2012; Zeithaml, 1988). Perceived usefulness in this research, adapted from existing researches (Davis, Bagozzi, & Warshaw, 1989; Davis, 1989), is the extent to which a mobile user believes that using a particular app will enhance his or her performance on specific task. Before the extended app is launched, people probably have had an
21
evaluation of quality and usefulness toward the parent app. Because of the relationship between the parent app and extended app, and the unfamiliarity of the extended app causing by imperfect and asymmetric information, people tended to transfer the already established evaluation, including perceived quality and usefulness, toward parent app on to the extended app. While reducing the uncertainty toward the extension, it also reduces the information cost and risk perception of users, consequently causing better evaluation toward the extension (Erdem & Swait, 1998). Therefore current research assumed that the perceived quality and perceived usefulness of the parent app have a positive influence on the perceived quality and perceived usefulness of the extended app.
The relationship between the perceived quality of parent app and the perceived quality of the extension has been examined in diverse context (Aaker & Keller, 1990; P.
Bottomley & Holden, 2001; Chowdhury, 2007; Song et al., 2010; Völckner & Sattler, 2006). Although there is no research indicate clear relationship between perceived usefulness of parent app and the perceived usefulness of the extension, when users perceived higher usefulness toward the parent app, their needs are satisfied and they are likely to think that the app provider has the ability to provide extended apps which can meet their needs especially when the apps are perceived to be in the same category by the users, wherefore the transfer of usefulness perception between parent app and the
22
extension is to be tested. In conclusion, the following hypotheses are proposed.
H1. A higher perceived quality of parent app is associated with a higher perceived
quality of the extended app.
H2. A higher perceived usefulness of parent app is associated with a higher perceived
usefulness of the extended app.
3.2.2 Perceived Fit and Perceived Tie
Perceived fit is defined as the extended app’s perceived similarity to the parent app mainly on dimensions like category and attributes (Park, Milberg, & Lawson, 1991;
Song et al., 2010). In the memory of users, product categories are conceptualize as cognitive categories(Boush & Loken, 1991), and it is likely that the extended app will be assigned to the same category as the parent app for the reason that they generally have some common attributes. Thus if there is perceived fit between parent app and extended app, a categorization process is probably to follow, and the perceptions toward parent app would be apply to the extended app. Otherwise, a piecemeal process will be launched and the attribute of the extended app will be examined carefully so the user can arrive at a final judgment toward the extension (Sujan, 1985). Furthermore, when the result of perceived fit is low, user may even doubt the provider’s capability of developing the extended app and hence causing a poorer evaluation of the extended app
23
(Czellar, 2003; Park et al., 1991). This leads to the following hypotheses.
H3. The perceived fit between the parent app and the extended app has a positive
association with the perceived quality of the extended app.
H4. The perceived fit between the parent app and the extended app has a positive
association with the perceived usefulness of the extended app.
In this research, perceived tie is defined as the strength of perceivable interactions between different apps (Song et al., 2010; K. Stewart, 2006). Due to the design of mobile app, which not only provide connectivity through hyperlinks to the extended app, but also provide various interactive ways between parent app and its extension, parent app can act as promoting platform for its extension (Sviokla & Paoni, 2005), and the perceived tie between the parent app and its extension can easily be established by mobile user. If user perceived a strong tie between parent app and its extension, both the apps would be assumed to be a bonded coherent group (K. J. Stewart, 2003; K. Stewart, 2006), and thus more likely to be allocated into the same category. Just as the same situation when perceiving a fit between apps, the categorization process will take place and the evaluation of parent app will be transferred to the extended app. However, if there is no perceived tie or the perceived tie is weak, then the reason why the app provider is launching the extension will be question. Hence the following hypotheses
24
are proposed.
H5. The perceived tie between the parent app and the extended app has a positive
association with the perceived quality of the extended app.
H6. The perceived tie between the parent app and the extended app has a positive
association with the perceived usefulness of the extended app.
An overall evaluation of product may be deposited and retrieved apart from specific attribute information in memory, therefore the evaluation of parent app can have impact on perceived fit and perceived tie by the retrieval of memory (Broniarczyk
& Alba, 1994; Gwee, Hui, & Chau, 2002). If the perceived quality and the perceived usefulness of the parent app are positive, users will expect the providers to be capable of developing a new app, and causing the perceived fit and perceived tie to be higher. In contrast, if the perceived quality and the perceived usefulness of the parent app are negative, the technique and ability of the provider in developing a new app will be doubt, and result in lower perceived fit and perceived tie. The situation brings about the following hypotheses.
H7. The perceived quality of a parent app has a positive association with the perceived
fit.
25
H8. The perceived quality of a parent app has a positive association with the perceived
tie.
H9. The perceived usefulness of a parent app has a positive association with the
perceived fit.
H10. The perceived usefulness of a parent app has a positive association with the
perceived tie.
3.2.3 Behavior Intention
Perceived quality is a critical determinant of intention (Aaker & Keller, 1990;
Jacobson & Aaker, 1987), and many researches have empirically confirmed the positive
effect of perceived quality on the user’s intention (Baker, Sciglimpaglia, & Saghafi, 2010; Liaogang, Chongyan, & Zi’an, 2007; Tsiotsou, 2006; Zeithaml, Berry, &
Parasuraman, 1996). Therefore this study proposes the following hypothesis.
H11. The perceived quality of the extended app is positively associated with the usage
behavioral intention toward the extended app.
The primary reason why people adopted an app is that the app provides some specific function which can make people find it helpful. And there is extensive research in related context which has proven the effect of perceived usefulness on usage intention (Chen, 2012; Fang et al., 2006; Hong & Tam, 2006; Ko et al., 2009; Li & Yeh,
26
2010; H.-P. Lu & Su, 2009; Y. Lu et al., 2010; Scharl et al., 2005b; Schierz et al., 2010;
Shin, 2009; Tai-Li Ho et al., 2012; Thong et al., 2006; Wu et al., 2011; Yi-Shun Wang et al., 2006). Hence the following hypothesis will be tested.
H12. The perceived usefulness of the extended app is positively associated with the
usage behavioral intention toward the extended app.
3.3 Research Design
3.3.1 Measurement of the constructs
According to (Eagly, 1992), if researchers only adopt the most relevant research, then they will miss the chance to discover potential theoretical ideas and make their research be limited by the constraints of the research paradigm. Therefore the current research will use real mobile app and its extension as research target.
In this research, the free mobile messenger app, LINE, and its extensions were chosen to be the target parent app and extended apps. Launched in June, 2011, LINE has rapidly occupied the communication app market in Taiwan (“LINE,” 2013). After that, its provider launched its extensions, LINE camera and LINE POP in April and November next year respectively (Rick Martin, 2012a, 2012b). The recent report indicated that LINE is the top app which has the highest reach rate and its extensions, LINE camera and LINE POP, are also on the popular list during the research period,
27
November 2012 to January 2013, in Taiwan (InsightXplorer, 2013). There are four reasons why LINE and its extensions are chosen to be the research target. First of all, the popularity of LINE and its extensions, and that the function of them are all major and practical in everyday use, which make it more effective to obtain valid questionnaires and make the research result to be more representative. Secondly, the adoption of the apps selected is usually voluntary, so there is no influence from any coercion to confound user perceptions and intention. Third, according to Taiwan Network Information Center (TWNIC), the apps belong to different categories, which are sociality for LINE messenger, photo editing/ photography for LINE camera and game for LINE POP (TWNIC, 2012a). Therefore LINE camera and LINE POP can be seen as new product category for LINE. Lastly, the launch time of the apps, as mentioned previously, follow the order of parent app and then the extensions.
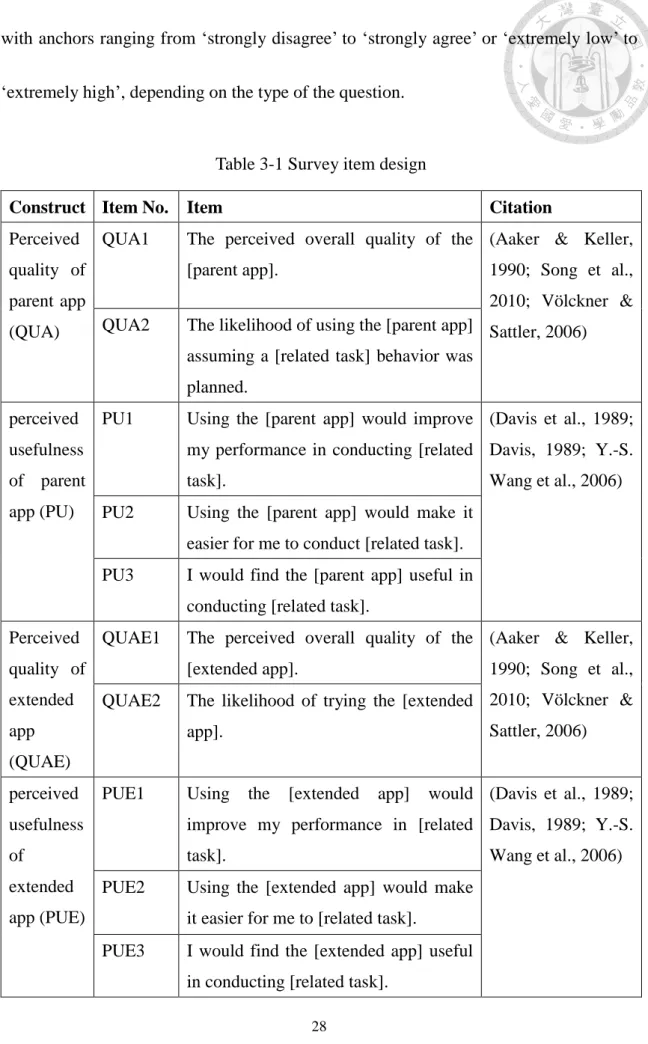
Validated survey items are adopted from previous research, see Table 3-1. Few changes in the wording have been made so that the items can fit in the research context.
Parent app refers to the mobile messenger app, LINE, whose related task is mobile message-sending. Extended app refers to the mobile photographing app, LINE camera, whose related task is photo shooting, and another one refers to the mobile entertainment app, LINE POP, whose related task is game playing. 7-point Likert scales was used,
28
with anchors ranging from ‘strongly disagree’ to ‘strongly agree’ or ‘extremely low’ to
‘extremely high’, depending on the type of the question.
Table 3-1 Survey item design
Construct Item No. Item Citation
Perceived quality of parent app (QUA)
QUA1 The perceived overall quality of the [parent app].
(Aaker & Keller, 1990; Song et al., 2010; Völckner &
Sattler, 2006) QUA2 The likelihood of using the [parent app]
assuming a [related task] behavior was planned.
perceived usefulness of parent app (PU)
PU1 Using the [parent app] would improve my performance in conducting [related task].
(Davis et al., 1989;
Davis, 1989; Y.-S.
Wang et al., 2006) PU2 Using the [parent app] would make it
easier for me to conduct [related task].
PU3 I would find the [parent app] useful in conducting [related task].
Perceived quality of extended app (QUAE)
QUAE1 The perceived overall quality of the [extended app].
(Aaker & Keller, 1990; Song et al., 2010; Völckner &
Sattler, 2006) QUAE2 The likelihood of trying the [extended
app].
perceived usefulness of
extended app (PUE)
PUE1 Using the [extended app] would improve my performance in [related task].
(Davis et al., 1989;
Davis, 1989; Y.-S.
Wang et al., 2006) PUE2 Using the [extended app] would make
it easier for me to [related task].
PUE3 I would find the [extended app] useful in conducting [related task].
29
Perceived Fit (FIT)
FIT1 Global similarity between [parent app]
and the [extended app].
(P. A. Bottomley &
Doyle, 1996; Song et al., 2010;
Völckner & Sattler, 2006)
FIT2 Would the people, facilities, and skills used in making the [parent app] be helpful if [app provider] were to provide the [extended app]?
FIT3 Extent to which [parent app]-specific associations are relevant in the [extended app].
Perceived Tie (TIE)
TIE1 The [parent app] is not connected to the [extended app]. (Reverse coded)
(Song et al., 2010;
K. J. Stewart, 2003;
K. Stewart, 2006) TIE2 The [parent app] is not likely to
recommend the [extended app] to individuals. (Reverse coded)
TIE3 The [parent app] and the [extended app] have a business relationship with one another.
Behavior Intention toward extension (BI)
BI1 Assuming that I have access to the [extended app], I intend to use it.
(Agarwal & Prasad, 1999; Venkatesh &
Davis, 1996;
Yi-Shun Wang et al., 2006)
BI2 I intend to increase my use of the [extended app] in the future.
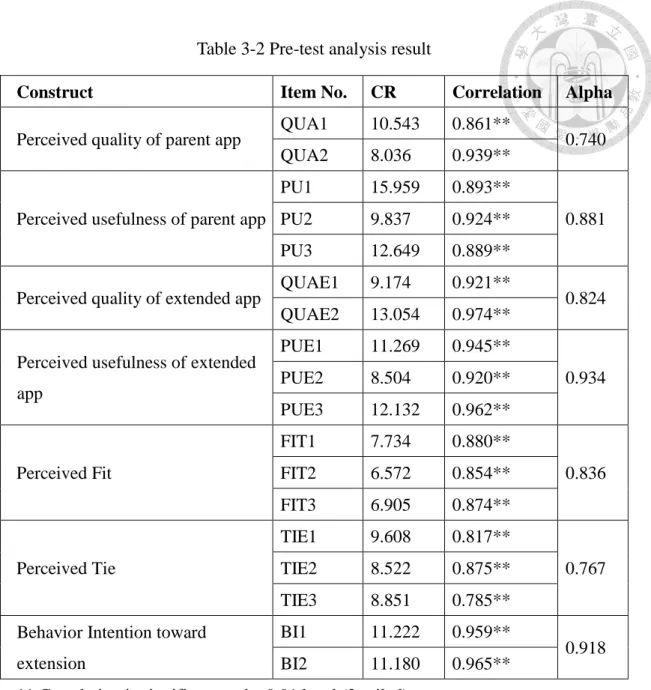
Before firing the formal questionnaire, pre-test of the measuring items was made by selected mobile app users. Item analysis using critical ratio method, item-to-total correlation coefficient analysis, and Cronbach’s alpha coefficient analysis was conducted to examine the quality of the items (Table 3-2). All items’ critical ratio is higher than 3.5 (Wang, B.J., 2002), and all items’ correlation with construct’s total score
30
is significant and highly relevant. Furthermore, the Cronbach’s alpha of all constructs are higher than 0.7 and the Cronbach’s alpha if any item was deleted (Anderson &
Gerbing, 1988). Therefore, the internal consistency and reliability of the items are verified. However, because the number of pre-test samples was insufficient, the pre-test stage doesn’t include factor analysis. The items were modified according to the analysis result and some of the opinions of the subjects. The complete formal questionnaire consists of introduction of the selected apps, measures of the constructs and request for demographic information, which is showed in Appendix A. Questionnaire
31
Table 3-2 Pre-test analysis result
Construct Item No. CR Correlation Alpha
Perceived quality of parent app QUA1 10.543 0.861**
0.740 QUA2 8.036 0.939**
Perceived usefulness of parent app
PU1 15.959 0.893**
0.881 PU2 9.837 0.924**
PU3 12.649 0.889**
Perceived quality of extended app QUAE1 9.174 0.921**
0.824 QUAE2 13.054 0.974**
Perceived usefulness of extended app
PUE1 11.269 0.945**
0.934 PUE2 8.504 0.920**
PUE3 12.132 0.962**
Perceived Fit
FIT1 7.734 0.880**
0.836 FIT2 6.572 0.854**
FIT3 6.905 0.874**
Perceived Tie
TIE1 9.608 0.817**
0.767 TIE2 8.522 0.875**
TIE3 8.851 0.785**
Behavior Intention toward extension
BI1 11.222 0.959**
0.918 BI2 11.180 0.965**
**.Correlation is significant at the 0.01 level (2-tailed).
Note: CR=Critical ratio, Correlation=Item-to-all correlation, Alpha=Cronbach’s alpha
3.3.2 Data Collection
This study takes place in Taiwan, which is an appropriate location because there are 41.97% of the people hold smart device and there are 66.92% of them, who has already downloaded apps, are qualified for this research (TWNIC, 2012a).
The research target of current research includes all individuals who has suitable
32
device which can obtain mobile app and has downloaded at least one of them. Because of choosing LINE messenger as the parent app in research, participation of the questionnaire also limited to those who have use mobile instant message app. However, the participation of the research doesn’t constraint to the user who use all three of the chosen app, LINE messenger, LINE camera, and LINE POP, for the reason that all three of the applications are popular and commonly used apps, hence users of mobile devices usually have some impression of them. Also, there are brief introductions of all three apps in the questionnaire before asking related questions. In addition, in the research of Song et al. (2010), the requirement of participating the survey was also only users who use general service similar to parent web service.
An online survey is conducted, which hosted by mySurvey system (www.mysurvey.tw), a well-known website which provides free construction of online survey and hosting service. To reach the general population of research target as close as possible, a number of the popular web forums, which discuss mobile app related topic, including ePrice (www.eprice.com.tw) and PTT Bulletin Board System (www.ptt.cc), and popular mobile accessible social website, Facebook (www.facebook.com) were choose to distribute the link of the online survey. There are several benefits to adopt online survey compared survey in paper (Wei-Tsong Wang & Hui-Min Li, 2012). First
33
of all, because the nature of online survey, which allows respondents to fill the questionnaire without the constraints of time and space, and to feel anonymous, researchers can reach respondents more easily and effectively (Bhattacherjee, 2002).
Next, the online survey system provides the function to restrict respondents to fill out every survey items, or else they can’t submit the responses, therefore prevent incomplete answers in survey results (Wang & Emurian, 2005). Third, the participants of online survey are usually voluntary, and thus tend to provide more meaningful responses than those who are not, which ensure the validity of the responses (Hsu, Ju, Yen, & Chang, 2007). Lastly, previous research indicated that the results of the online survey are less likely to be influenced by the presentation format or be affected negatively by non-serious or repeat responders (Gosling, Vazire, Srivastava, & John, 2004). Besides, the users, who can fill in the online survey, of web forums and Facebook are matched for the age and computer literacy for mobile app user.
In order to draw as many as possible participants of the survey, a lucky draw was conducted. Ten prizes were offered for the draw winners, and every respondent had approximately 4% chance of winning the prize. The data was collected from 6 June, 2013 to 4 July, 2013, a total of 4 weeks. Finally, 265 responses were collected. After deleting repeat responses and non-serious responses, the result provides 506 (253 × 2)
34
observations since each response evaluates two extensions.
3.3.3 Analysis Method
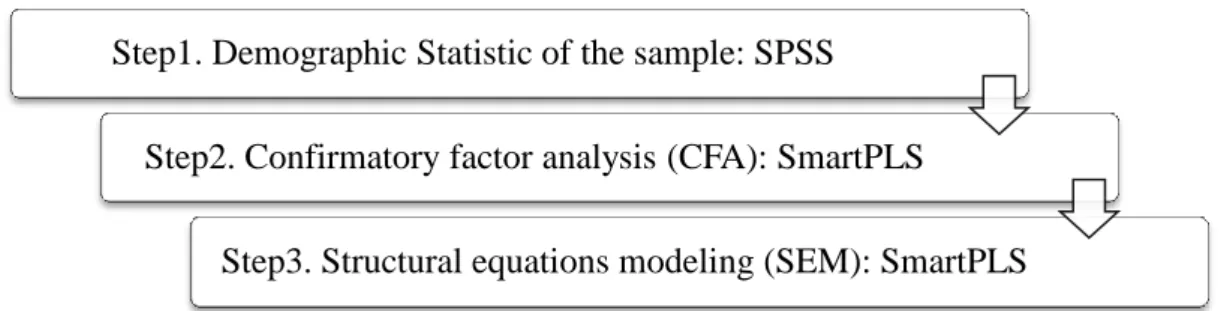
The collected data will be analyzed by SPSS 16 and SmartPLS 2.0, and follow the procedure showed in Figure 3-2. In step two and step three, a two-phase approach (Anderson & Gerbing, 1988) for SEM analysis was used with partial least square estimation approach following the procedure in the study of Aibinu and Al-Lawati (2010). Phase one is measurement model, which examined the overall fit, validity, and reliability using CFA. And then phase two is structural model, which examined the hypotheses.
PLS-SEM was used in this study because most of the items were perception-based measured on a Likert scale, which are of unknown distribution, and since normality of the items can’t be confirmed, PLS-SEM was preferred but not normality requested covariance-based SEM.
Figure 3-2 Analysis flowchart Step1. Demographic Statistic of the sample: SPSS
Step2. Confirmatory factor analysis (CFA): SmartPLS
Step3. Structural equations modeling (SEM): SmartPLS
35
Chapter 4 Analysis and Results
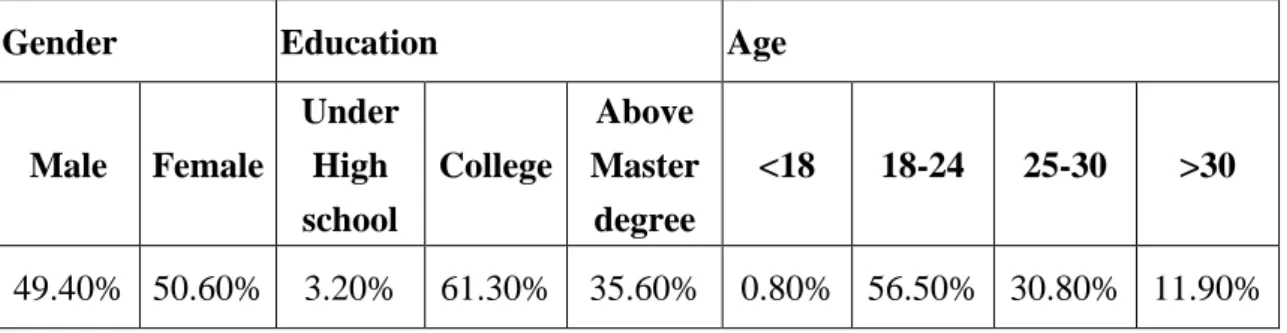
4.1 Demographic Statistic
After organizing the data, 506 samples were assessed for three major biases, which are noncoverage bias, sampling bias and nonresponse bias, in online survey (Best, Krueger, Hubbard, & Smith, 2001; Couper, 2000), to ensure the representativeness of the samples.
First, noncoverage bias means that not everyone in the research target population is in the sample frame, which in this research it represents that not everyone who use mobile app can access the online survey which distributed in the web forums and Facebook. A report in 2012 (TWNIC, 2012b) indicated that there is more than 77.25%
of people in Taiwan who has the experience in surfing internet, therefore the high internet penetration imply that whether the potential respondents have access to the internet so that they can participate in the online survey is not a serious problem.
Additionally, the distributed channels, web forums and Facebook are popular in Taiwan and open to everyone on the internet. Thus the research has no serious noncoverage bias.
Secondly, sampling bias refers to the situation that not all members of the sample frame are measured in the research. Because this research did not apply random