Volume 23, No.3, 2018, pp. 173-189 DOI 10.6574/JPRS.201809_23(3).0003
1國立政治大學地政學系 碩士 收到日期:民國 107 年 04 月 02 日
2國立政治大學地政學系 副教授 修改日期:民國 107 年 04 月 30 日
3韓國首爾市立大學 資深研究員 接受日期:民國 107 年 05 月 04 日
* 通訊作者, E-mail: [email protected]
利用偏移偵測法監測格陵蘭 Russell 冰河之位移
蔡亞倫
1*林士淵
2Jung-Rack Kim
3摘要
近年全球暖化現象日益嚴重,格陵蘭等極區融冰所造成之海平面上升將對全球人類帶來嚴重威脅。
因冰層質量之改變與冰河移動速度高度相關,故可藉由監測格陵蘭冰層(Greenland Ice Sheet, GrIS)上冰河 之移動推估全球暖化對其造成之影響。衛星影像因具有連續且快速獲得大範圍地表資訊之能力,故已廣 泛應用於廣域冰河之監測;然各項技術受限於快速移動且地貌不穩定之冰河表面而有諸多限制,故本研 究使用偏移偵測法(Pixel-offset, PO)以衛載光學及合成孔徑雷達(Synthetic Aperture Radar, SAR)影像獲得冰 河表面之位移向量。經比較不同影像品質、處理參數等調整對於變動偵測成果之影響後,本研究發現目 前免費衛載光學影像以 Landsat-8 的全色態波段有最佳成果,而 SAR 影像以經 Log 處理之 HH 偏極影像 為最優。
關鍵詞:偏移偵測法、格陵蘭冰層、合成孔徑雷達
1. 前言
近年全球暖化(Global warming)現象加劇,格 陵蘭冰層(Greenland ice sheet, GrIS)上的冰量已快 速減少(Rignot, 2008),其原因來自許多連接海洋的 冰川於近十幾年來快速向海移動崩解與冰體表面 消 融 所 致 (Joughin et al., 2004 、 Rignot and Kanagaratnam, 2006、van den Broeke et al., 2009)。
其上蘊含之冰量若全數融化於海中,將造成全球海 平面升高約 7 m (Weidick et al., 1995)。但全球約有 六億人口居住在海平面高 10 m 以下的海岸地區 (McGranahan et al., 2007),故全球海平面上升將會 對人類生活造成嚴重影響。
因 冰 層 質 量 與 冰 河 移 動 速 度 極 為 相 關 (Schellenberger et al., 2015),冰層移動速度的增快 或減緩均會影響冰層質量的變化 (Strozzi et al., 2008)。因此為了解格陵蘭冰層消融情況,對各主 要冰川的移動速度進行監測確屬必要,然傳統測量 方式常受限於可及性低、精度不足、觀測範圍小、
施測成本高、時間解析度低等限制,並無法有效率
獲得連續高精度成果。為克服以上缺點,過往許多 研究使用衛星影像,如合成孔徑雷達(Synthetic Aperture Radar, SAR)與光學影像進行監測,以達到 長時期、大區域、高精度之目標。
惟利用衛星影像估算地表幾何變形量之各項 技術,亦有其誤差因素與自然限制,更因冰河區域 之快速移動、地貌均質度高且位於高緯度區域等特 性,使得各技術應用於冰河監測受到諸多限制。如 合成孔徑雷達差分干涉(Differential Interferometric SAR, D-InSAR)雖為普遍的地表變形偵測技術,然 其易受到大氣延遲誤差(Hanssen, 2001)、高緯度之 電離層干擾(Massonnet et al., 1993、Fujiwara et al., 2000)等技術限制,且其同調性(Coherence)極易受 到冰河表面之快速地貌變化而降低,而難以正確解 算變形量。
因此本研究將使用衛載光學與雷達影像執行 透過偏移偵測法,並且比較不同參數與前處理程序 對於偵測成果之品質影響進行分析,進而求得合理 而可靠之格陵蘭冰河表面變動量。據此,以下先介 紹格陵蘭冰層近年消融狀態,並說明偏移偵測法,
再比較不同控制之偏移偵測成果,並提出結論與建 議。
2. 格陵蘭冰層消融狀態
格陵蘭島位於北極與北極海之間 ,面積約 1,700,000 km2,其上蘊含之冰量體積約 2,900,000 km3,若透過約百支之冰河全數流入並融化於海中,
將造 成全球平均 海水面 (Global mean sea level, GMSL)升高約 7 m(Weidick et al., 1995)並導致海洋 環流異常(Fichefet et al., 2003、Marsh et al., 2010、
Straneo et al., 2010)。然近年來,格陵蘭冰層(GrIS) 上 之 冰 量 已 快 速 融 化 而 減 少 (Rignot, 2008 、 Bhattacharya et al., 2009) 而 向 海 之 融 水 增 加 (Shepherd and Wingham, 2007、Bamber and Riva, 2010),其原因主要來自許多連接海洋的冰川於近 十幾年快速向海移動崩解(Luckman et al., 2006、
Rignot and Kanagaratnam, 2006、Howat et al., 2007) 與表面消融所致(van den Broeke et al., 2009)。
冰層變化之時間尺度原應為百年或千年(Alley and Whillans, 1984),然由於全球暖化作用,格陵 蘭 島 之 冰 河 融 化 與 移 動 速 度 均 有 顯 著 提 升 (Shepherd et al., 2012、 Khan et al., 2014),其作用 機制為全球暖化導致空氣溫度與海水溫度增加,進 而使與其接觸之冰層表面逐漸消融,且降雪增加速 度不及消融速度(Box et al., 2006、Ettema et al., 2009),故於兩者作用下使得冰層質量失衡且冰層 厚度緩慢改變(Holland et al., 2008)。經觀察 GrIS 發現,通常在七月至九月之夏季有較明顯移動速度 (Joughin et al., 1999、Moon et al., 2014)。
監測冰層移動速度對於監測冰層狀態而言十 分重要,因冰層質量與冰河移動速度極為相關,冰 層移動速度之增快或減緩均會影響冰層質量變化 (Strozzi et al., 2008、Khan et al., 2014)。近十年來 GrIS 消融對於海平線上升之貢獻已增加兩倍以上,
自 1996 年時 0.23 mm/yr 至 2005 年時增加為 0.57 mm/yr(Rignot and Kanagaratnam, 2006),而許多較 大型的冰河移動速度亦顯著提高 (Howat et al., 2005、Rignot and Kanagaratnam, 2006)。且許多研
究亦顯示格陵蘭島區域之冰雪累積量速度不足以 補充冰河消融造成之質量損失(Velicogna and Wahr, 2006、Howat et al., 2011、Moon et al., 2012)。
GrIS 因溫室效應造成冰層消融速度加劇,且 因冰層不穩定導致大量冰棚崩落與分解之事件 (Heinrich event),不僅造成海水面上升,亦因格陵 蘭鄰近北極海區域,而可能影響全球環流與氣候變 化(Bond et al., 1993),故為研究全球暖化之重要區 域。
因各冰川移動之速度自公分至公尺等級均有,
因此為了解格陵蘭地區冰量減少情況,對各主要冰 川之監測確屬必要。藉由對於冰川變遷監測,可了 解冰量在空間與時間上變化趨勢與變動情形,並推 估全球暖化對冰川造成之影響。
3. 偏移偵測法
雖然 D-InSAR 技術為現今普遍之地表變形偵 測技術,然其具有空間與時間不相關(Zebker and Villasenor, 1992)、大氣延遲誤差(Hanssen, 2001),
且只可觀測視衛星方向(Line of sight, LOS)即斜距 方向(Slant range)一維變動量(Massonnet et al., 1993、
Wright et al., 2004)等限制。隨技術演進,前兩者限 制已可有效解決,然最後一點則為該技術之原始限 制(Ferretti et al., 2001、Berardino et al., 2002)。且其 中 LOS 方向與衛星飛行方向相關,若衛星為北-
南方向飛行,則 D-InSAR 可利用升軌與降軌兩方 向取得兩 LOS 方向,然此兩方向測得之變動量僅 對上-下與東-西方向較為敏感(Rocca, 2003)。因 此,以現今 SAR 設計,D-InSAR 技術並無法取得 北-南方向,即沿軌方向的變動量。
為克服此限制, Michel et al. (1999)提出次像 元相關法(Subpixel correlation),又稱偏移量追蹤法 (Offset-Tracking method) , 或 偏 移 偵 測 法 (Pixel-offset, PO)。其以對位方式(Coregistration)偵 測兩 SAR 影像振幅波段偏移量,進而估計方位方 向(Azimuth)(沿軌方向)地表變形量。雖然次像元相 關法精度較傳統 D-InSAR 技術為低,然其具有多 項優勢,如可克服 D-InSAR 因劇烈地表位移產生
之干涉條紋過飽和與相似度過高狀況等(Chen and Zebker, 2001),故此方法可補足 D-InSAR 技術不足,
而被廣泛應用於地震偵測與冰河移動等(Grandin et al., 2009、Schellenberger et al., 2015、Ou et al., 2016、
Yun et al., 2016)。
然此方法精度與 SAR 影像之空間解析度及對 位精度極相關,軌道誤差、長空間基線(超過 300 m) 導致之地形誤差、拍攝角誤差或對位失準都會形成 對同一地區影像上之位移與扭曲 (Werner et al., 2005)。為了得到真實冰河移動速度,如何於對位 過程中,除去其他相關誤差即為重要課題。而若可 正確移除誤差,針對冰河移動速度之偵測精度通常 可達 1/10 甚至 1/20 像素大小(Fialko et al., 2001、
Strozzi et al., 2002)。
4. 影像與處理軟體
為針對 2016 當年之 Russell 冰河移動情形進行 監測,本研究將使用 2016 年可用之近代免費高解 析度衛載感測器影像,以下針對研究中使用之雷達 與光學影像群之詳細資訊與將使用之技術,分組說 明。
4.1 光學影像
4.1.1 ASTER
ASTER(Advanced Spaceborne Thermal Emission and Reflection Radiometer)感測器裝載於 美 國 太 空 總 署 (National Aeronautics and Space Administration, NASA)於 1999 年 12 月發射之 Terra 衛星上,較同年代衛星(如 Landsat-7)相比有更高之 解析度,然其重複拍攝範圍則較少而稀疏。其包含 三種儀器針對不同波段進行拍攝,可見光與近紅外 (Visible and Near Infrared, VNIR) 、 短 波 紅 外 (Shortwave Infrared, SWIR) 與 熱 紅 外 (Thermal Infrared, TIR),其中 SWIR 感測器自 2008 年 4 月 因儀器溫度異常而關閉至今。
4.1.2 Landsat-8
Landsat-8 為 NASA Landsat 計畫於 2013 年 11 月發射之第八顆衛星,其上酬載之 Operational Land Imager (OLI) 感測器確保各波段之品質精度
與穩定性。
4.1.3 Sentinel-2
Sentinel-2 為歐洲太空總署(ESA)之哥白尼計 畫(Copernicus)發射之第二組衛星,與 Sentinel-1 相 同為兩衛星組成,S2A 已於 2015 年 6 月發射,其 上酬載之 Multispectral Imager(MSI)感測器提供各 波段之紀錄。
由文獻可知,影像本身之幾何精度將對偏移偵 測成果有極大影像,故使用以上影像時均選擇最高 正射品質之幾何校正產品,如 ASTER 與 Landsat-8 之 L1T 及 Sentinel-2 之 Level-1C。
4.2 雷達影像
Sentinel-1 系列衛星係由同軌道但角度差 180 度之衛星群組合之系統,其意在於接續ESA 之 ERS 與 ENVISAT 衛星,其上搭載 C 波長 SAR 設備,
為哥白尼計畫衛星,S1A 於 2014 年 4 月發射,S1B 於 2016 年 4 月發射,至今均正常運作中。
為使用影像記載之回波強度資訊,將使用 IW 模式拍攝之單觀點複數影像(Single-look-complex image, SLC)。
研究區域 Russell 冰河位於格陵蘭西南部(中心 經緯度 67°N,49°W),其與一般消融於海中之冰川 (Marine-terminating)不同,屬於陸地消融型之冰川 (Land-terminating),故其冰量減損係因季節性表面 融水之侵蝕作用所致,而非裂解為冰山(Zwally et al., 2002、Joughin et al., 2008、Bartholomew et al., 2010)。該區域冰河大致包含 Isunnguata Sermia、
Russell、Leverett、Ørkendalen 與 Isorlersuup 冰河,
其位置與位移中心流線(Flow line)如圖 1 所示。
因該區域常年有極地氣旋壟罩,故上述各感測 器影像中,除雷達影像不受雲霧與天氣影響故各影 像均可進行分析外,光學影像極易受到雲霧遮蔽,
而導致可用影像數急遽減少,整理可用影像時間如 圖 2 所示。並整理所用影像之特性如表 1。
圖 1 研究區域與使用影像涵蓋範圍
4.3 處理軟體
偏移偵測法之原理歷史悠久,最早為透過人為
選 擇 共 軛 點 比 較 物 體 變 化 量 (Lucchitta and Ferguson, 1986),而該技術於早期即應用於冰河移 動之監測(Scambos et al., 1992),故發展至今已有極 多功能相似但演算法不同之軟體,整體而言可分為 七大類(Heid and Kääb, 2012):(1)於空間域執行 NCC;(2)於頻率域執行 CC;(3)於頻率域執行相位 相關(Phase Correlation);(4)於頻率域執行方向性 CC ; (5) 於 頻 率 域 執 行 方 向 性 相 位 相 關 ; (6)COSI-Corr 之相位相關;(7)最小二乘法匹配。其 中最後方式需設定初始值,故不常用於影像變形偵 測;方法(2)至(5)均透過相同之傅立葉匹配技術但 有不同之正規化方式,COSI-Corr 軟體雖亦為傅立 葉處理方式,然其於頻率域匹配完後並不轉換回空 間域(Leprince et al., 2007、Ayoub et al., 2009)。
圖 2 本研究使用影像之涵蓋時間區間,圖中 X 符號表示該影像之拍攝日期,可知 Sentinel 影像提供最佳 之時間涵蓋範圍
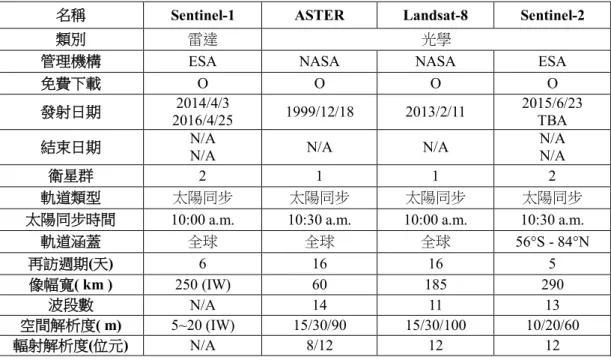
表 1 本研究使用影像之特性比較
名稱 Sentinel-1 ASTER Landsat-8 Sentinel-2
類別 雷達 光學
管理機構 ESA NASA NASA ESA
免費下載 O O O O
發射日期 2014/4/3
2016/4/25 1999/12/18 2013/2/11 2015/6/23 TBA
結束日期 N/A
N/A N/A N/A N/A
N/A
衛星群 2 1 1 2
軌道類型 太陽同步 太陽同步 太陽同步 太陽同步
太陽同步時間 10:00 a.m. 10:30 a.m. 10:00 a.m. 10:30 a.m.
軌道涵蓋 全球 全球 全球 56°S - 84°N
再訪週期(天) 6 16 16 5
像幅寬( km ) 250 (IW) 60 185 290
波段數 N/A 14 11 13
空間解析度( m) 5~20 (IW) 15/30/90 15/30/100 10/20/60
輻射解析度(位元) N/A 8/12 12 12
比較上述各演算法於冰河移動偵測之效果,
COSI-Corr 除可於低地貌對比度、雲霧及雪覆蓋影 像均有較其他演算法為好之成果外,亦於全球五個 冰河測試區中獲得最高偵測變動量準確率(Heid and Kääb, 2012)。此可歸因於 COSI-Corr 匹配罩窗 之權重為常態分配,故可避免邊緣效應;並以穩健 性函數及迭代權重最小誤差法排除錯誤離群值,進 而取得精度較高之位移量,故本研究中針對光學影 像之偏移偵測法將使用 COSI-Corr 軟體。
針對雷達影像之偏移偵測法,因該種影像成像 與紀錄之資訊與光學影像大相逕庭,使得影像具有 不同之扭曲如前坡倒轉等成像限制(Lillesand and Kiefer, 1994),且受到區域性回波隨機建設與破壞 性 干涉造成 之雜訊 (Speckle) 大幅降 低影像 品質 (Chan and Peng, 2003),故需採取與光學影像不同 之策略。回顧文獻,前人多利用自行開發(然並未 公開)之軟體執行偏移偵測法(Nagler et al., 2015),
或使用商用之 GAMMA 軟體進行處理(Strozzi et al., 2002、Schellenberger et al., 2016)。免費軟體方面,
ESA 之 SNAP(Sentinel Application Platform)雖亦可 解算並與 Sentinel 衛星有良好相容性,然直至 2016/12 發布之 5.0.0 版本其偏移偵測成果仍僅可 顯示整體平面位移速度,並無法拆分為縱與橫方向,
故分析上較有限制。然受限於 GAMMA 軟體所費 不 貲 , 本 研 究 將 使 用 ISCE(InSAR Scientific Computing Environment)軟體中承自 ROI_PAC 軟 體差分干涉前處理之主從影像對位之 ampcor 演算 法進行偏移偵測。
執行步驟為先執行聚焦處理(Focusing)形成單 觀點複數影像(Single Look Complex, SLC),然 SLC 影像雖保留影像原始解析度,但其並非為易判讀之 影像型態,故再經多視角處理(Multilook)為多觀點 複數影像(Multi Look Complex, MLC)。然各影像雖 均為相同軌道位置拍攝,各影像之影像涵蓋地理位 置仍因軌道或衛星角度等誤差而略有差異,故再利 用相同之範圍裁切各張影像至相同地理位置影像。
接著將相同地理範圍之裁切後 MLC 匯出至 ISCE 軟體,利用 Ampcor 演算法進行影像匹配與像素法 偵測。其提供使用者設定相關參數,如罩窗大小、
罩窗移動間距等等,執行完畢將輸出一文字檔記載 影像縱橫方向之位移量。
5. 成果分析
為判斷各影像與參數所求得位移量之方向與 量級正確與否,將與 ESA 之格陵蘭冰層氣候變遷 偵 測 計 畫 (Greenland Ice Sheet Climate Change Initiate project)發布之 2016 年平均冰河表面移動速 度進行比較。
由圖 3 可知,該區域五條冰河均向西移動,其 中又以 Ørkendalen 與 Isorlersuup 冰河有最大速度 量,約每天移動 50 cm 之多;而於南北方向,此兩 冰河有明顯上下交會之位移方向。故於後續各項成 果中,若位移量過大、過小或移動方位錯誤,將視 為不可靠之解算成果。
(a) 東西方向變動量
(b) 南北方向變動量
圖 3 ESA CCI 變動量產品(黑線表示冰河範圍與基 岩區域之分界)
5.1 光學影像 PO 成果
5.1.1 正射品質差異
首先將三種影像各自進行偏移偵測,使用 128
×128 大小之罩窗進行處理,ASTER、Sentinel-2 與 Landsat-8 之成果分別為圖 4、5 與 6 所示。
(a) 東西方向變動量
(b) 南北方向變動量
圖 4 ASTER(8/1-8/16)日均變動量成果
本研究使用之光學影像,均為正射化之產品,
然根據各自機構之說明文件,可知其用於正射化之 DEM 不同,如 Sentinel-2 為整合 SRTM 4.1 版本等 多來源 DEM 之 PlanetDEM 90 產品;Landsat-8 則 是 以 美 國 國 家 測 繪 局 National Imagery and Mapping Agency (NIMA)最初為軍事目的產製之 DTED (Digital Terrain Elevation Data)Level1 產品,
其解析度亦為 90 m。
(a) 7/15-7/31 變動量
(b) 7/31-9/26 變動量
圖 5 Sentinel-2 日均變動量成果 (左:東西方向變 動量;右:南北方向變動量)
(a) 7/10-7/26 變動量
(b) 7/26-9/12 變動量
圖 6 Landsat-8 日均變動量成果(左:東西方向變 動量;右:南北方向變動量)
但根據產製 PlanetDEM 90 之公司 PLANET OBSERVE 發 布 之 產 品 技 術 手 冊 記 載 , 受 限 於 SRTM 涵蓋範圍僅包含北緯 60 度至南緯 60 度之區 間,故該範圍外之高緯度區域將使用不同來源之高 程資料,檢視後可知格陵蘭島使用 1:250000 與 1:500000 之地形圖,故可知其平面誤差最大可達 250 m (0.5 mm × 5000000),遠較 DTED 為差,故 可 預 期 Sentinel-2 之 正 射 化 影 像 準 確 性 將 較 Landsat-8 為差。
而由研究中相似時間之 Landsat-8 與 Sentinel-2 影像對進行偏移偵測法,確可發現其中 Sentinel-2 之成果有嚴重之問題,如圖 7 所示,即冰舌區域發 生空間上不規則且不合理方向之移動,經放大檢視 對應時間之影像後,發現 Sentinel-2 之地表有明顯 位移與扭曲,然 Landsat-8 則肉眼幾乎無法看出扭 曲,故可知 Sentinel-2 之不合理變形為其影像之正 射化品質較差所致,而非匹配演算法之問題。此與 文獻中所謂 Sentinel-2 正射化影像對位精度可達 1/10 像元,且若執行偏移偵測法有誤應源自於匹配 之演算法之結論有明顯歧異。
(a) 7/15-7/31 變動量 (b) 7/31-9/26 變動量 圖 7 Sentinel-2 變動量放大圖
而 ASTER 成果亦顯示過大之變動量級,且似 乎有軌道誤差存在使得變動量有漸層關係,推測可 能與該衛星運作時間久而使軌道精度下降所致。故 於後續參數測試中,將僅以 Landsat-8 為光學影像 代表進行分析。
5.1.2 波段選擇
本研究使用之光學影像均為多解析度之多光 譜影像,然 COSI-Corr 軟體僅能讓主從影像各輸入 一波段,故如何挑選適合之影像即為一重要問題,
而挑選波段時,必須符合以下兩條件以對冰河區域 取得最細緻而正確之變形量偵測:
(1)空間解析度越高越好
(2)對於冰河均調之地貌有較大對比度
針對冰河之地貌,由文獻可知可見光之紅波段 與近紅外波段有對大地貌對比度(Kääb et al., 2002),
故對 Sentinel-2 而言為波段 4、8 與 11;Landsat-8 則為波段 4、5(Schellenberger et al., 2015)。
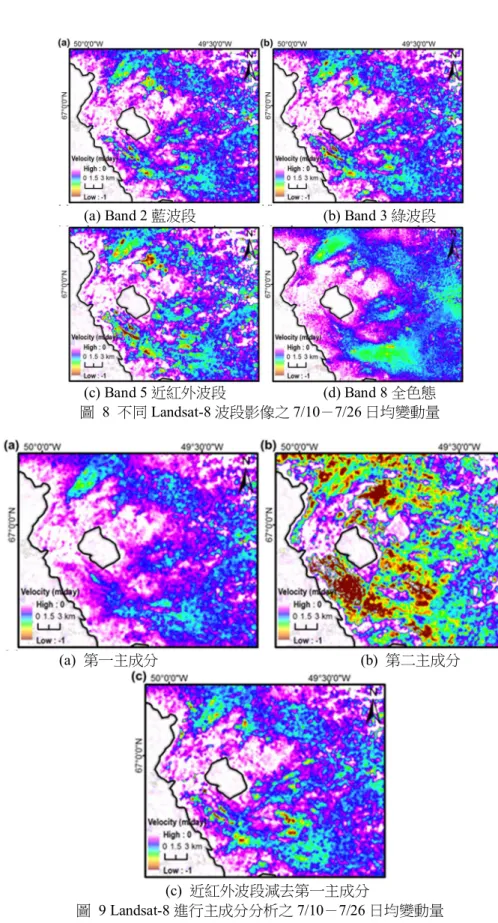
故為比較個波段對偏移偵測法之成果影響,分 別使用波段 2(藍)、3(綠)、5(近紅外)與 8(全色態) 進行處理,成果如圖 8 所示。
比較圖 8,可見以全色態有最完整而正確之成 果,然此係因影像之空間解析度亦為另一重要之因 素。全色態波段之空間解析度為 15 m,為近可見 光波段之兩倍,故可記載較細緻之地表特徵而有較 完整之成果。
然比較圖 8(a)(b)(c),仍可發現近紅外波段略 微較藍與綠波段有更近似全色態波段之成果,即有 較明顯之變化量,此觀察與理論符合。
由以上比較可知,空間解析度對偏移偵測法 的成果影響力,遠較波段反射度差異高出許多。
5.1.3 主成分分析處理
因 Landsat-8 與 Sentinel-2 皆為多光譜之影像,
故 可 於 進 行 偏 移 偵 測 法 前 先 以 主 成 分 分 析 (Principal Component Analysis, PCA)方式獲得蘊藏 最多資訊之光譜組合。其原理為藉由分析不同波段 之灰階值(Digital Numbers, DN)於空間上之變化,
可取得影像拍攝區域地貌之紋理特徵,如粗糙度、
對 稱 性 等 (Chica-Olmo and Abarca-Hernández, 2004)。
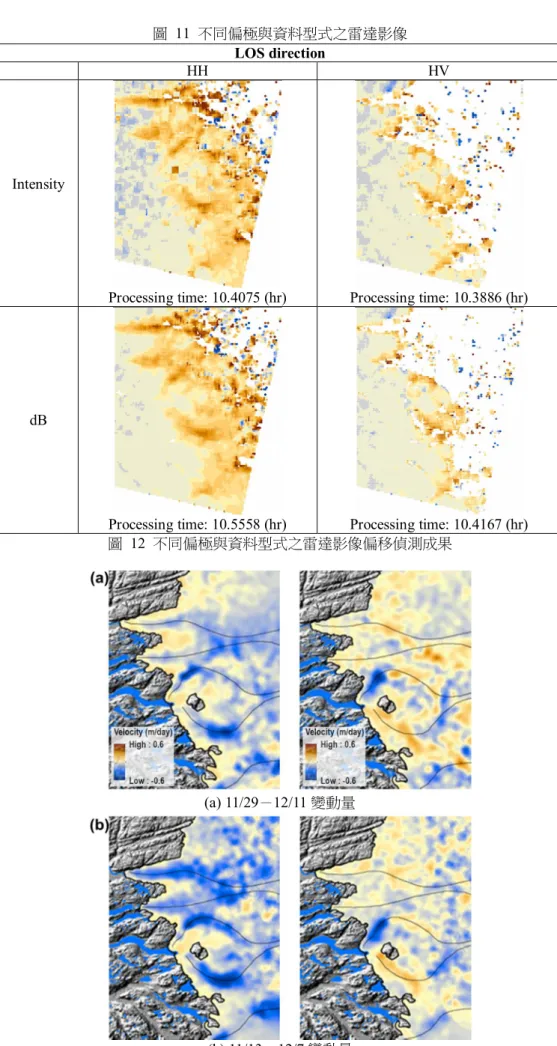
故將主從影像之藍、綠、近紅外波段進行 PCA 處理後,分別以第一與第二主成分影像進行偏移偵 測,成果如圖 9(a)與(b)。觀察可發現與原圖 8(a) 至(c)成果相比,第一主成分影像之成果並無更相似 圖 8(d)之全色態變動量,且反而更無法偵測細緻之 變動量;而第二主成分影像卻因太多雜訊而有大幅 高估變動量之狀況發生。
除直接以主成分元素進行偏移偵測法外,亦測 試將原影像對比度較高(即記載較多地貌特徵)之 近紅外波段減去第一主成分元素後,再進行偏移偵
測法,其成果如圖 9(c)。然比較亦可發現其並未明 顯提升成果之細節或正確性。故知若空間解析度較 差,則進行主成分分析並無法顯著提升成果品質。
5.1.4 罩窗大小
為比較罩窗大小對於偵測變動量之影響,將透 過不同大小之搜尋罩窗進行處理。影像部分選用時 間基線較長之 Landsat-8 影像對為樣本,其成果如 圖 10 所示。
(a) Band 2 藍波段 (b) Band 3 綠波段
(c) Band 5 近紅外波段 (d) Band 8 全色態 圖 8 不同 Landsat-8 波段影像之 7/10-7/26 日均變動量
(a) 第一主成分 (b) 第二主成分
(c) 近紅外波段減去第一主成分
圖 9 Landsat-8 進行主成分分析之 7/10-7/26 日均變動量
(a) 8×8 (b) 16×16
(c) 32×32 (d) 256×256 圖 10 不同罩窗大小處理之 Landsat-8 7/10-9/12 日均變動量 觀察可看出,當罩窗大小為 8×8 時,因影像間
隔時間內之地表特徵物位移大於照過罩窗大小,而 無法被正確匹配而有較差信噪比(Signal-to-Noise Ratio, SNR),使得於最後步驟中被濾除而空白;然 當罩窗大小擴大為 16×16 時,幾乎已可描繪所有變 動之位置,進一步增大至 32×32 時有更完整之變動 量。
然當罩窗逐漸放大至 256×256 時,可見其成果 幾乎與 32×32 時無異,僅略微平滑但仍幾乎不損變 動細節,故可之當罩窗大小超過得以偵測變動量之 距離門檻後,再增大並無明顯效果,但將顯著增加 搜尋與匹配之處理時間。
5.2 雷達影像 PO 成果
5.2.1 影像偏極與資料型式
針對以雷達影像執行偏移偵測法時,需先回顧 雷達影像不同形式之記載資訊,簡言之可分為以下
三種,其關係如下(Chan and Peng, 2003):
(1)Amplitude(振幅), (2)Intensity (強度), = 2 (3)Decibel(分貝), log I
其中強度影像值之分布具有統計模式,而振幅 影像則有相對縮限之值域,而分貝影像則可更顯著 降低極大極小值之差異。且加上所用之部分雷達影 像為具有雙偏極資訊,包含 HH 與 HV,而文獻指 出 HH 偏極因具有較高之信噪比與較高品質之地 貌特徵,故較 HV 偏極適用於冰河表面偵測(Nagler et al., 2015)。然為測試上述各種資訊形式與偏極之 效果,亦將各自執行偏移偵測法後比較之。
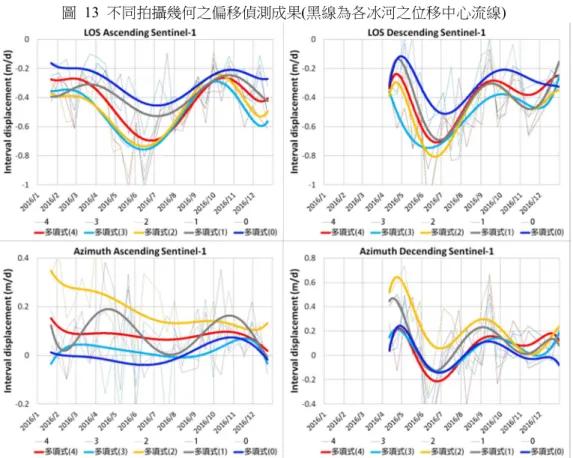
圖 11 為四種組合之區域放大圖。可看出經 Log 處理後之分貝影像確可使極值縮小而使得冰層上 特徵較為明顯,然峰值之縮小是否會使特徵偵測時 降低對比度而增加錯誤率則需執行後方可得知。而 比較偏極影像差異,可看出兩者呈現之表面特徵紋 理不相同,故無法明顯評估何者將有較好成果。故
以下將測試不同組合之差異,以取得最合理、可靠 而較高效率之成果。
將上述四種影像各自進行偏移偵測後,其成果 如圖 12 所示。比較四種組合之 LOS 方向變形量,
可看出分貝影像較強度影像為好,如觀察各圖中左 側應無變動量之基岩區域可看出其於分貝影像之 雜訊遠較強度影像為低,且於冰舌區域亦有較平滑 連續之變形。而偏極方面,則明顯以 HH 為佳,因 其於冰雪覆蓋區域之成果點數遠較 HV 為多而完 整。於效率分面,比較各組執行時間,均在 10.5 小時左右故無明顯差異。故經以上測試,可知應以 HH 偏極之分貝影像執行偏移偵測法,將有最完整 而合理之變形量。
5.2.2 升降軌
因雷達感測均為右側視系統,故軌道飛行方向 的升降將使成像幾何不同,故將測試其對於偏移偵 測法之成果差異。偏極與資料型式方面,將均使用 HH 偏極之分貝影像執行之。
首先比較相仿時間之升降軌影像成果,如圖 13 所示。由圖中可看出,基本上 LOS 與沿軌方向 之變形量均極為相似,且五冰河向西移動而中央兩 冰河上下交會之狀態均與 ESA CCI 成果相似,故 知成果應相當正確。
而為了解各冰河區域於不同季節之時間序列 變化,於區域內五個冰河之 LOS 方向最大沉降區 域設定興趣點,並以折線圖檢視,然因各冰河之變 動趨勢受到短週期之降雨雪量差異造成速度不穩 定而難以判斷較長趨勢,故再透過 6 次項多項式趨 勢線平滑各組變動量如圖 14 所示。
比較升軌與降軌組之 LOS 與方位方向變動量 趨勢線,可發現各冰舌之變動趨勢均極為相似,以 5 至 8 月區間有最大 LOS 方向沉陷量,然值得注 意 11 至 12 月亦有小幅度增速下降。反觀兩不同軌 道之方位方向變動量,則較難看出相同趨勢,受限 於軌道方向不同而難以直接判斷方位方向移動趨 勢。
HH HV
Intensity
dB
圖 11 不同偏極與資料型式之雷達影像 LOS direction
HH HV
Intensity
Processing time: 10.4075 (hr) Processing time: 10.3886 (hr)
dB
Processing time: 10.5558 (hr) Processing time: 10.4167 (hr) 圖 12 不同偏極與資料型式之雷達影像偏移偵測成果
(a) 11/29-12/11 變動量
(b) 11/13-12/7 變動量
圖 13 不同拍攝幾何之偏移偵測成果(黑線為各冰河之位移中心流線)
圖 14 不同拍攝幾何之時間序列偏移偵測成果
6. 結論與建議
根據上述各測試之經驗,包含比較總計四種光 學與雷達影像,並透過多光譜、主成分分析、罩窗 大小、偏極與資料型式及成像幾何差異後,可歸納 結論如下:
(1)偏移偵測法對於光學影像本身之正射品質有極 高要求,而目前高解析度之免費影像中又以 Landsat-8 有最好之品質。
(2)空間解析度較波段反射度差異有更大之影響,
故以 Landsat-8 之全色態波段有最佳成果。
(3)在空間解析度不足之狀況下,執行主成分分析 相關處理並無法有效改善成果細節與品質。
(4)搜尋罩窗大小必須大於主從影像時間間隔內之 地表位移,然超過此一門檻後再增大罩窗並無顯 著效果,並將耗費大量執行時間。
(5)合成孔徑雷達影像之偏移偵測成果,以經 Log 處理後之分貝與 HH 偏極影像有最完整而正確 之成果。
(6)時間相仿之升降軌雷達影像成果極為相似,故 不受到成像幾何影響。
由以上結論可之,若欲透過衛載影像執行偏移 偵測法以監測快速變動且地貌不穩定之冰河位移 情況,以光學影像而言應選用最高解析度之感測器 或波段,其次方考慮各波段之地貌對比差異;而雷 達影像則應選擇 HH 之分貝影像。處理方面,則應 測試後選擇超過變動量大小之罩窗大小,方可正確 進行監測。
致謝
承蒙中華民國行政院科技部專題研究計畫(計 畫編號:MOST 106-2420-H-004-015-MY3)與韓國 Ministry of Land, Infrastructure and Transport 研究 計畫 Greenland mapping project 經費支持,以及 JAXA(ALOS RA-6 dataship No. 3238)與 ASIAQ Greenland Survey 提供影像與地面測量資料,本研 究方得以順利完成,謹此申謝。
參考文獻
Alley, R.B., and Whillans, I.M., 1984. Response of the East Antarctica ice sheet to sea‐level rise, Journal of Geophysical Research: Oceans (1978–2012), 89(NC4): 6487-6493.
Ayoub, F., Leprince, S., and Avouac, J.-P., 2009.
Co-registration and correlation of aerial photographs for ground deformation measurements, ISPRS Journal of Photogrammetry and Remote Sensing, 64(6):
551-560.
Bamber, J., and Riva, R., 2010. The sea level fingerprint of recent ice mass fluxes, Cryosphere, 4(4): 621-627.
Bartholomew, I., Nienow, P., Mair, D., Hubbard, A., King, M.A., and Sole, A., 2010. Seasonal evolution of subglacial drainage and acceleration in a Greenland outlet glacier, Nature Geoscience, 3(6): 408-411.
Berardino, P., Fornaro, G., Lanari, R., and Sansosti, E., 2002. A new algorithm for surface deformation monitoring based on small baseline differential SAR interferograms, IEEE Transactions on Geoscience and Remote Sensing, 40(11): 2375-2383.
Bhattacharya, I., Jezek, K.C., Wang, L., and Liu, H.X., 2009. Surface melt area variability of the Greenland ice sheet: 1979–2008, Geophysical Research Letters, 36, No.L20502, doi:
10.1029/2009GL039798.
Bond, G., Broecker, W., Johnsen, S., McManus, J., Labeyrie, L., Jouzel, J., and Bonani, G., 1993.
Correlations between climate records from North Atlantic sediments and Greenland ice, Nature, 365(6442): 143-147.
Box, J.E., Bromwich, D.H., Veenhuis, B.A., Bai, L.S., Stroeve, J.C., Rogers, J.C., Steffen, K., Haran, T., and Wang, S.H., 2006. Greenland ice sheet
surface mass balance variability (1988-2004) from calibrated polar MM5 output, Journal of Climate, 19(12): 2783-2800.
Chan, A.K., and Peng, C., 2003. Wavelets for Sensing Technologies (Vol. 1), Artech House Publishers, Boston London.
Chen, C.W., and Zebker, H.A., 2001.
Two-dimensional phase unwrapping with use of statistical models for cost functions in nonlinear optimization, Journal of the Optical Society of America A-Optics Image Science and Vision, 18(2): 338-351.
Chica-Olmo, M., and Abarca-Hernández, F., 2004.
Remote Sensing Image Analysis: Including the Spatial Domain, Chapter 6 Variogram Derived Image Texture for Classifying Remotely Sensed Images, Published by Springer, Dordrecht, pp.
93-111.
Ettema, J., van den Broeke, M.R., van Meijgaard, E., van de Berg, W.J., Bamber, J.L., Box, J.E., and Bales, R.C., 2009. Higher surface mass balance of the Greenland ice sheet revealed by high‐
resolution climate modeling, Geophysical Research Letters, 36, No.L12501, doi:
10.1029/2009GL038110 .
Ferretti, A., Prati, C., and Rocca, F., 2001. Permanent scatterers in SAR interferometry, IEEE Transactions on Geoscience and Remote Sensing, 39(1): 8-20.
Fialko, Y., Simons, M., and Agnew, D., 2001. The complete (3-D) surface displacement field in the epicentral area of the 1999 MW7.1 Hector Mine Earthquake, California, from space geodetic observations, Geophysical Research Letters, 28(16): 3063-3066.
Fichefet, T., Poncin, C., Goosse, H., Huybrechts, P., Janssens, I., and Le Treut, H., 2003. Implications of changes in freshwater flux from the Greenland ice sheet for the climate of the 21st
century, Geophysical Research Letters, 30(17), doi: 10.1029/2003GL017826.
Fujiwara, S., Nishimura, T., Murakami, M., Nakagawa, H., Tobita, M., and Rosen, P.A., 2000. 2.5 ‐ D surface deformation of M6.1 earthquake near Mt Iwate detected by SAR interferometry, Geophysical Research Letters, 27(14): 2049-2052.
Grandin, R., Socquet, A., Binet, R., Klinger, Y., Jacques, E., de Chabalier, J.B., King, G.C.P., Lasserre, C., Tait, S.R., Tapponnier, P., Delorme, A., and Pinzuti, P., 2009. September 2005 Manda Hararo ‐ Dabbahu rifting event, Afar (Ethiopia): Constraints provided by geodetic data, Journal of Geophysical Research: Solid Earth, 114, No.B08404, doi:
10.1029/2008JB005843.
Hanssen, R.F., 2001. Radar Interferometry: Data Interpretation and Error Analysis (vol. 2), Published by Springer, Netherlands.
Heid, T., and Kääb, A., 2012. Evaluation of existing image matching methods for deriving glacier surface displacements globally from optical satellite imagery, Remote Sensing of Environment, 118: 339-355.
Holland, D.M., Thomas, R.H., De Young, B., Ribergaard, M.H., and Lyberth, B., 2008.
Acceleration of Jakobshavn Isbrae triggered by warm subsurface ocean waters, Nature Geoscience, 1(10): 659-664.
Howat, I.M., Ahn, Y., Joughin, I., van den Broeke, M.R., Lenaerts, J.T.M., and Smith, B., 2011.
Mass balance of Greenland's three largest outlet glaciers, 2000–2010, Geophysical Research Letters, 38, No.L12501, doi:
10.1029/2011GL047565.
Howat, I.M., Joughin, I., and Scambos, T.A., 2007.
Rapid changes in ice discharge from Greenland outlet glaciers, Science, 315(5818): 1559-1561.
Howat, I.M., Joughin, I., Tulaczyk, S., and Gogineni, S., 2005. Rapid retreat and acceleration of Helheim Glacier, east Greenland, Geophysical Research Letters, 32, No.L22502, doi:
10.1029/2005GL024737.
Joughin, I., Abdalati, W., and Fahnestock, M., 2004.
Large fluctuations in speed on Greenland's Jakobshavn Isbrae glacier, Nature, 432(7017):
608-610.
Joughin, I., Das, S.B., King, M.A., Smith, B.E., Howat, I.M., and Moon, T., 2008. Seasonal speedup along the western flank of the Greenland Ice Shee, Science, 320(5877):
781-783.
Joughin, I., Fahnestock, M., Kwok, R., Gogineni, P., and Allen, C., 1999. Ice flow of Humboldt, Petermann and Ryder Gletscher, northern Greenland, Journal of Glaciology, 45(150):
231-241.
Kääb, A., Huggel, C., Paul, F., Wessels, R., Raup, B., Kieffer, H., and Kargel, J., 2002. Glacier monitoring from ASTER imagery: Accuracy and applications, Proceedings of EARSeL-LISSIG-Workshop Observing our Cryosphere from Space, Bern, pp.43-53.
Khan, S.A., Kjær, K.H., Bevis, M., Bamber, J.L., Wahr, J., Kjeldsen, K.K., Bjørk, A.A., Korsgaard, N.J., Stearns, L.A., van den Broeke, M.R., Liu.
L., Larsen, N.K., and Muresan, L.S., 2014.
Sustained mass loss of the northeast Greenland ice sheet triggered by regional warming, Nature Climate Change, 4(4): 292-299.
Leprince, S., Barbot, S., Ayoub, F., and Avouac, J.-P., 2007. Automatic and precise orthorectification, coregistration, and subpixel correlation of satellite images, application to ground deformation measurements, IEEE Transactions on Geoscience and Remote Sensing, 45(6):
1529-1558.
Lillesand, T.M., and Kiefer, R.W., 1994. Remote Sensing and Photo Interpretation, John Wiley and Sons, New York.
Lucchitta, B.K., and Ferguson, H.M., 1986.
Antarctica: Measuring glacier velocity from satellite images, Science, 234(4780): 1105-1108.
Luckman, A., Murray, T., De Lange, R., and Hanna, E., 2006. Rapid and synchronous ice‐dynamic changes in East Greenland, Geophysical Research Letters, 33(3), No.L03503, doi:10.1029/2005GL025428.
Marsh, R., Desbruy, D., Bamber, J.L., de Cuevas, B.A., Coward, A.C., and Aksenov, Y., 2010.
Short-term impacts of enhanced Greenland freshwater fluxes in an eddy-permitting ocean model, Ocean Science, 6(3):749-760.
Massonnet, D., Rossi, M., Carmona, C., Adragna, F., Peltzer, G., Feigl, K., and Rabaute, T., 1993. The displacement field of the Landers earthquake mapped by radar interferometry, Nature, 364(6433): 138-142.
McGranahan, G., Balk, D., and Anderson, B., 2007.
The rising tide: Assessing the risks of climate change and human settlements in low elevation coastal zones, Environment and Urbanization, 19(1): 17-37.
Michel, R., Avouac, J.-P., and Taboury, J., 1999.
Measuring ground displacements from SAR amplitude images: Application to the Landers earthquake, Geophysical Research Letters, 26(7):
875-878.
Moon, T., Joughin, I., Smith, B., van den Broeke, M.R., van de Berg, W.J., Noël, B., and Usher, M., 2014. Distinct patterns of seasonal Greenland glacier velocity, Geophysical Research Letters, 41(20): 7209-7216.
Moon, T., Joughin, I., Smith, B., and Howat, I., 2012.
21st-century evolution of Greenland outlet glacier velocities, Science, 336(6081): 576-578.
Nagler, T., Rott, H., Hetzenecker, M., Wuite, J., and Potin, P., 2015. The Sentinel-1 mission: New opportunities for ice sheet observations, Remote Sensing, 7(7): 9371-9389.
Ou, D., Tan, K., and Yan, S., 2016. Using D-InSAR and offset tracking technique to monitor mining subsidence, Earth Observation and Remote Sensing Applications (EORSA), International Workshop on 2016 4th, Guangzhou, China Rignot, E., 2008. Changes in West Antarctic ice
stream dynamics observed with ALOS PALSAR data, Geophysical Research Letters, 35(12), No.L12505, doi: 10.1029/2008gl033365
Rignot, E., and Kanagaratnam, P., 2006. Changes in the velocity structure of the Greenland ice sheet, Science, 311(5763): 986-990.
Rocca, F., 2003. 3D motion recovery with multi-angle and/or left right interferometry, Proceedings of the third International Workshop on ERS SAR, Italy.
Scambos, T.A., Dutkiewicz, M.J., Wilson, J.C., and Bindschadler, R.A., 1992. Application of image cross-correlation to the measurement of glacier velocity using satellite image data, Remote Sensing of Environment, 42(3): 177-186.
Schellenberger, T., Dunse, T., Kääb, A., Kohler, J., and Reijmer, C.H., 2015. Surface speed and frontal ablation of Kronebreen and Kongsbreen, NW Svalbard, from SAR offset tracking, Cryosphere, 9(6): 2339-2355.
Schellenberger, T., Van Wychen, W., Copland, L., Kääb, A., and Gray, L., 2016. An inter-comparison of techniques for determining velocities of maritime Arctic glaciers, Svalbard, using Radarsat-2 Wide Fine mode data, Remote Sensing, 8(9), No.785, doi: 10.3390/rs8090785 . Shepherd, A., Ivins, E.R., Geruo, A., Barletta, V.R.,
Bentley, M.J., Bettadpur, S., Briggs, K.H., Bromwich, D.H., Forsberg, R., Galin, N.,
Horwath, M., Jacobs, S., Joughin, I., King, M.A., Lenaerts, J.T., Li, J., Ligtenberg, S.R., Luckman, A., Luthcke, S.B., McMillan, M., Meister, R., Milne, G., Mouginot, J., Muir, A., Nicolas, J.P., Paden, J., Payne, A.J., Pritchard, H., Rignot, E., Rott, H., Sørensen, L.S., Scambos, T.A., Scheuchl, B., Schrama, E.J., Smith, B., Sundal, A.V., van Angelen, J.H., van de Berg, W.J., van den Broeke, M.R., Vaughan, D.G., Velicogna, I., Wahr, J., Whitehouse, P.L., Wingham, D.J., Yi., D.H., Young, D., and Zwally, H.J., 2012. A reconciled estimate of ice-sheet mass balance, Science, 338(6111): 1183-1189.
Shepherd, A., and Wingham, D., 2007. Recent sea-level contributions of the Antarctic and Greenland ice sheets, Science, 315(5818):
1529-1532.
Straneo, F., Hamilton, G.S., Sutherland, D.A., Stearns, L.A., Davidson, F., Hammill, M.O., Stenson, G.B., and Rosing-Asvid, A., 2010. Rapid circulation of warm subtropical waters in a major glacial fjord in East Greenland, Nature Geoscience, 3(3): 182-186.
Strozzi, T., Kouraev, A., Wiesmann, A., Wegmüller, U., Sharov, A., and Werner, C., 2008. Estimation of Arctic glacier motion with satellite L-band SAR data, Remote Sensing of Environment, 112(3), 636-645.
Strozzi, T., Luckman, A., Murray, T., Wegmüller, U., and Werner, C.L., 2002. Glacier motion estimation using SAR offset-tracking procedures, IEEE Transactions on Geoscience and Remote Sensing, 40(11): 2384-2391.
van den Broeke, M., Bamber, J., Ettema, J., Rignot, E., Schrama, E., van de Berg, W.J., van
Meijgaard, E., Velicogna, I., and Wouters, B., 2009. Partitioning recent Greenland mass loss, Science, 326(5955): 984-986.
Velicogna, I., and Wahr, J., 2006. Acceleration of Greenland ice mass loss in spring 2004, Nature, 443(7109): 329-331.
Weidick, A., Williams, R.S., and Ferrigno, J.G., 1995.
Satellite Image Atlas of Glaciers of the World:
Greenland, US Government Printing Office.
Werner, C., Wegmüller, U., Strozzi, T., and Wiesmann, A., 2005. Precision estimation of local offsets between pairs of SAR SLCs and detected SAR images, 2005 IEEE international Geoscience and Remote Sensing Symposium, South Korea, pp.4803-4805
Wright, T.J., Parsons, B.E., and Lu, Z., 2004. Toward mapping surface deformation in three dimensions using InSAR, Geophysical Research Letters, 31(1), No.L01607, doi:
10.1029/2003GL018827.
Yun, H., Kim, J., Tsai, Y.L., Lin, S.Y., and Choi, Y., 2016. Investigation of Greenland Russell glacier with remote sensing observations and ice sheet/hydrodynamic simulations, EGU General Assembly Conference Abstracts, (18), EPSC2016- 5327, Vienna Austria.
Zebker, H.A., and Villasenor, J., 1992. Decorrelation in interferometric radar echoes, IEEE Transactions on Geoscience and Remote Sensing, 30(5): 950-959.
Zwally, H.J., Abdalati, W., Herring, T., Larson, K., Saba, J., and Steffen, K., 2002. Surface melt-induced acceleration of Greenland ice-sheet flow, Science, 297(5579): 218-222.
1 Master, Department of Land Economics, National Chengchi University Received Date: Apr. 02, 2018
2 Associate Professor,Department of Land Economics, National Chengchi University Revised Date: Apr. 30, 2018
3 Senior Research Fellow, Dept. of Geoinformatics, University of Seoul, Korea Accepted Date: May. 04, 2018
* Corresponding Author, E-mail: [email protected]
Tracking Greenland Russell Glacier Movements Using Pixel-offset Method
Ya-Lun Tsai
1*Shih-Yuan Lin
2Jung-Rack Kim
3Abstract
Global warming has been a worldwide issue and significantly increasing icecap melting rate over polar area.
Consequently the sea level rises continuously and poses a fundamental threat to whole human beings. Since the mass loss of Greenland ice sheet (GrIS) is highly correlated to the velocity of glacier movement, this study aims to monitor the impact of global warming by tracking glacier terminus displacement over GrIS using spaceborne remote sensing techniques which are widely applied in cryosphere monitoring for its continuous and efficient data collection ability. However, as many techniques are limited by the rapid changing and instable landscape dynamics of glacier surface, the present study utilizes the pixel-offset (PO) method with optical and synthetic aperture radar (SAR) images to track glacier deformation. In addition, by comparing the combinations of different quality images, processing parameters and pre-processing methods, we found the pan channel of Landsat-8 images and the log-processed HH polarization SAR images show the most promising results.