CONTROL CABINET
KR C2
edition2005User Manual
Fault Analysis / Diagnosis
Zugspitzstrasse 140 D--86165 Augsburg
This documentation or excerpts therefrom may not be reproduced or disclosed to third parties without the express permission of the publishers.
Other functions not described in this documentation may be operable in the controller. The user has no claim to these functions, however, in the case of a replacement or service work.
We have checked the content of this documentation for conformity with the hardware and software described. Nevertheless, discrepancies cannot be precluded, for which reason we are not able to guarantee total conformity. The information in this documentation is checked on a regular basis, however, and necessary corrections will be incorporated in subsequent editions.
Subject to technical alterations without an effect on the function.
Contents
1 Repair and procurement of spare parts . . . . 7
1.1 Customer repair . . . 7
1.2 Repair by KUKA service personnel . . . 7
1.3 Procurement of spare parts . . . 7
2 Fault analysis and elimination . . . . 8
2.1 Fault analysis . . . 8
2.2 Isolation of faults using checklists . . . 8
2.3 Isolation of faults by exchanging components . . . 8
3 Typical fault profiles . . . . 9
3.1 Fault profiles related to the PC. . . 9
3.1.1 Power supply. . . 9
3.1.2 Basic configuration . . . 9
3.1.3 Drives . . . 9
3.1.4 PC--related peripherals . . . 9
3.1.5 Fault profile checklist . . . 10
3.2 Fault profiles related to DSE and machine data . . . 15
3.2.1 Program crashes (with possible loss of mastering). . . 15
3.2.2 The robot does not move in jog mode. . . 15
3.2.3 The drives cannot be switched on . . . 16
3.3 DSE error messages when booting the system. . . 17
3.3.1 DSE x not found . . . 17
3.3.2 Memory test error DSE x. . . 17
3.3.3 DSE x does not run up. . . 17
3.3.4 DSE axis assignment Ax. . . 18
3.3.5 Power module axis Ax not / incorrectly connected . . . 18
3.3.6 Machine data loader canceled . . . 18
3.3.7 Incorrect machine data . . . 18
3.4 DSE error messages during operation . . . 19
3.4.1 Watchdog interpolation cycle Ax . . . 19
3.4.2 Synchronization error with DSE Ax . . . 19
3.4.3 Regulator limit exceeded Ax . . . 19
3.4.4 Stopped Ax . . . 19
3.4.5 Motor temperature Ax . . . 19
3.5 Fault profiles related to the MFC . . . 20
3.5.1 Controller hangs when loading software components . . . 20
3.5.2 KCP control panel does not work. . . 20
3.6.3 No entries can be made via KCP. . . 22
3.6.4 EMERGENCY STOP cannot be acknowledged . . . 23
3.6.5 Space Mouse does not work . . . 23
3.7 Fault profiles related to a field bus card . . . 24
3.7.1 Communication via diagnostic interface not possible . . . 24
3.7.2 Error message “xxxxx I/O driver configuration error” . . . 24
3.7.3 After inserting the field bus card: no display, controller does not boot (Stop 0) . . . 24
3.7.4 The controller “hangs” after initialization of the field bus card . . . 24
3.7.5 No external power supply for slave when controller switched off . . . 24
4 Servo drive module messages and error displays . . . . 25
4.1 Servo drive module LEDs (KSD1) . . . 25
4.2 KCP messages for drives diagnosis . . . 26
5 KPS--600 messages and error displays . . . . 27
5.1 KPS--600/10 and /20 LED indicators . . . 27
5.1.1 Meaning of LEDs 1 and 2 . . . 28
5.1.2 Meaning of LEDs 3 and 4 . . . 28
5.1.3 Meaning of LEDs 5 and 6 . . . 28
5.1.4 KPS--600 error messages on the KCP . . . 29
6 KPS--27 operating state indicators . . . . 31
7 DSE--IBS operating state indicators . . . . 32
8 RDC2 operating state indicators . . . . 33
9 ESC diagnostic tool . . . . 34
9.1 Softkey bar . . . 35
9.2 ESC diagnosis error messages . . . 37
10 DSE--RDW diagnostic tool . . . . 39
10.1 Main menu of the DSE--RDW diagnostic tool . . . 39
10.1.1 Language selection . . . 40
10.1.2 System info . . . 41
10.1.3 MFC2 register display . . . 42
10.1.4 DSE IBS information . . . 43
10.1.5 Display RDC table . . . 44
10.1.6 RDC offset and symmetry adjustment . . . 45
10.1.7 Check RDC--DSE communication . . . 46
10.1.8 Drive bus diagnostics. . . 47
10.1.9 Drive bus error list . . . 48
10.1.10 Drive bus diagnostics -- KPS--2 . . . 49
10.1.11 Drive bus KSD 1--16. . . 50
10.1.12 Error messages valid for the KPS--600. . . 51
10.1.13 Error messages valid for the KSDs . . . 52
11 Oscilloscope . . . . 53
11.1 Display . . . 53
11.1.1 File selection . . . 54
11.1.2 Oscilloscope screen . . . 54
11.1.3 The information window. . . 55
11.1.4 The softkey bar . . . 56
11.1.5 The color softkeys . . . 56
11.1.6 The scaling function . . . 57
11.1.7 The zoom function . . . 58
11.1.8 The Save function. . . 58
11.1.9 The r.m.s. value function. . . 58
11.1.10 Print . . . 60
11.1.11 The cursor functions. . . 60
11.1.12 The filter function . . . 63
11.1.13 Superposing traces . . . 64
11.1.14 Changing color assignments. . . 66
11.1.15 Switching curves on and off . . . 67
11.2 Configure . . . 68
11.2.1 General. . . 70
11.2.2 Trigger condition . . . 71
11.2.3 Trace status. . . 73
11.2.4 Trace data . . . 73
11.2.5 Examples of a trace . . . 77
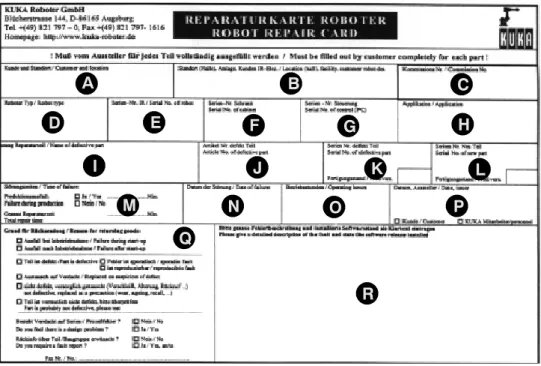
12 Robot repair card . . . . 81
1 Repair and procurement of spare parts
Repairs to the KR C may only be carried out by KUKA customer support personnel or by customers authorized to do so after participation in a relevant KUKA Robot Group service seminar.
1.1 Customer repair
As far as customer repairs to the KR C are concerned, only the exchange of modules is envisaged. A defective motherboard is exchanged together with the PC rack.
1.2 Repair by KUKA service personnel
Repairs within modules may only be carried out by specially trained KUKA Robot Group personnel.
A repair by KUKA Robot Group service personnel carries the following guarantees:
G carried out by specially trained, experienced personnel G compliance with the ESD directives
G use of the required special tools
G optimal conditions for locating faults and searching for the exact causes G technical revisions carried out
G overall test of the PC on completion of repair.
1.3 Procurement of spare parts
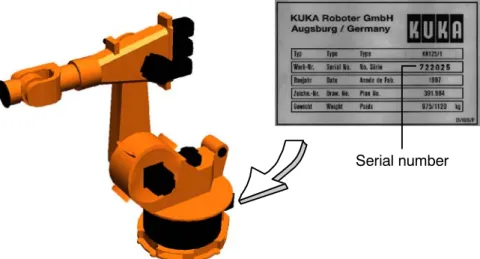
The article numbers for spare parts are listed in the electronic spare parts catalog (KUKA Parts) on a CD--ROM that accompanies every control cabinet.
The KUKA Robot Group supplies the following types of spare parts for KR C repairs:
G New parts
Once the new part has been installed, the part that has been removed can be disposed of.
G Exchange parts
Once the exchange part has been installed, the part that has been removed is returned to the KUKA Robot Group.
A “Robot Repair Card” is supplied with the exchange parts.
The Repair Card must be completed (see Chapter 12) and returned to the KUKA Robot Group.
2 Fault analysis and elimination
The following procedure is recommended for isolating the cause of the fault and enabling effective repair of the KRC:
2.1 Fault analysis
Is the fault reproducible?
-- Permanent fault -- Sporadic fault
Did the fault occur after installation or conversion?
-- Transportation damage -- Commissioning faults
Did the fault occur during operation?
-- Operator influence, incorrect operation -- Program modifications
-- Software configuration modifications Was the fault caused by external factors?
-- Electrical factors such as undervoltage/overvoltage, static electricity, interference fields -- Mechanical factors such as impact, vibration
-- Environmental factors such as heat, cold, humidity What is the fault profile?
-- Observe the status of operator control and display elements on the KR C (switch positions, lamps, LEDs)
-- Interpret error messages in the message window of the KCP
(for more detailed information see Section 3.2 and the following sections) -- Collate the statuses and error messages of higher--level controllers
(process control systems, automation components) -- Read logbook entries
2.2 Isolation of faults using checklists
The cause of the fault can be isolated by comparing the fault profile with a list of typical fault profiles (see Section 3.1.5).
2.3 Isolation of faults by exchanging components
In the case of a potentially defective overall system, functioning modules are introduced into the system one after the other and changes in the behavior of the system are observed.
In the case of a potentially defective component, this is introduced into a functioning system and changes in the behavior of the system are observed.
3 Typical fault profiles
3.1 Fault profiles related to the PC
3.1.1 Power supply
The motherboard and drives are supplied with power by an integrated switched--mode power supply.
Typical power supply fault profiles are:
-- Supply voltage that is characterized by dropouts or spikes -- Output voltage overload
-- Output voltage failure
-- Internal overheating due to fan failure
-- Defects in power switch and ATX power--on logic 3.1.2 Basic configuration
The processor, main memory, CMOS memory and other hardware are integrated onto the motherboard.
Typical faults in the motherboard basic configuration are:
-- Memory faults in the CMOS--RAM due to undervoltage in the lithium battery -- Incorrect BIOS entries
-- Memory faults in the main memory (RAM modules) -- Overheating due to failure of CPU fan
3.1.3 Drives
The hard drive, floppy disk drive and CD--ROM drive are integrated into the PC chassis.
Typical faults in the drives are:
-- Hard drive defect caused by impact or vibration
-- Data error caused by dust in the floppy disk drive and CD--ROM drive -- Cabling fault in the IDE bus and floppy disk bus
3.1.4 PC--related peripherals
PC--related peripherals include input and output devices and additional plug--in cards.
Typical faults in the PC--related peripherals are:
-- Keyboard does not respond -- Monitor display faults
-- Fault in the interplay between the VGA chip and the KVGA card
-- Bus errors and communication errors due to incorrectly configured plug--in cards (MFC, Ethernet, field bus cards)
3.1.5 Fault profile checklist
Main switch on PC to “ON”, system fails to boot, display stays dark, power supply fan and CPU fan do not work
Possible causes:
-- Power supply defective
-- Short circuit on the motherboard -- Short circuit on a connected device Elimination of fault:
-- Disconnect all devices from the power supply unit. Switch on PC and measure output voltages at the power supply unit. If an output voltage is too low, exchange the power supply unit.
-- Connect the power supply to the motherboard with the power supply unit switched off.
Switch on PC and measure supply voltages at the power supply unit. If an output voltage is too low, exchange the PC rack (motherboard fault).
-- Reconnect each device in turn to the power supply unit (drives, plug--in cards) with the power unit switched off. Switch on PC and measure output voltages at the power supply unit. If an output voltage is too low, exchange the device in question.
System does not boot, display stays dark Possible causes:
-- Ribbon cable not correctly connected (male connector without coding) -- Defective expansion card (Interbus, MFC, KVGA)
-- Memory modules (RAM modules) not correctly snapped into place (contact fault) -- Memory modules defective
-- Defective motherboard Elimination of fault:
-- Connect ribbon cable correctly (red marking on the ribbon cable corresponds to pin 1) -- Disconnect expansion cards (Interbus, Ethernet card) and test system again; replace
expansion cards if necessary
-- Snap memory modules correctly into place -- Exchange memory modules
-- Exchange PC rack
System boots sporadically, display stays dark Possible causes:
-- Incorrect BIOS version Elimination of fault:
-- Carry out BIOS update
System boots normally, display stays dark Possible causes:
-- KVGA defective
-- KCP2 connecting cable snapped
-- 24 V supply voltage for KCP2 not present in MFC3 Elimination of fault:
-- Exchange KVGA
-- Exchange KCP2 connecting cable (KVGA to X19)
-- Exchange connecting cable (X3) from the ESC--CI board to the MFC (X807) -- Exchange safety logic
System crash when booting, no keyboard entries possible Possible causes:
-- Defective motherboard Elimination of fault:
-- Exchange PC rack
The system repeatedly resets itself Possible causes:
-- Memory modules defective
-- Memory modules of different types installed
-- Defective or incorrectly installed graphics card (KVGA) Elimination of fault:
-- Exchange defective memory modules
-- Install memory modules that are all of the same type
-- Check KVGA card for correct fit in PCI slot, exchange if necessary
BIOS error message “CMOS Checksum Error”
Possible causes:
-- Undervoltage in lithium battery on the motherboard -- Incorrect or missing entries in CMOS setup
-- CMOS memory on motherboard defective Elimination of fault:
-- Replace lithium battery
-- Check entries in CMOS setup and correct if necessary -- Exchange PC rack
BIOS error message “MEMORY TEST FAILED”
Possible causes:
-- Defective memory module(s) Elimination of fault:
-- Exchange memory module(s)
Cannot boot from hard disk Possible causes:
-- BIOS fails to detect hard drive -- IDE cable incorrectly connected -- IDE drives incorrectly configured
-- Power supply connector incorrectly connected -- Hard drive defective
-- IDE interface on motherboard defective Elimination of fault:
-- Activate “Autodetect” in CMOS SETUP. Set boot sequence.
-- Compare hard drive parameters in CMOS setup with specifications on label of hard drive.
-- Check IDE cable (lateral offset, PIN1 marking)
-- Check drive configuration (master/slave, slave present, CHS/LBA) -- Ensure that power supply connector is correctly connected
-- Exchange hard drive
-- Exchange PC rack (motherboard fault)
Cannot access floppy disk drive (FDD) Possible causes:
-- CMOS setup: FDD type not correctly entered or FDD controller deactivated -- FDD data cable and power supply not connected correctly
-- FDD defective
-- FDD interface on motherboard defective Elimination of fault:
-- Check CMOS settings and correct if necessary -- Connect data cable and power supply correctly -- Exchange FDD
-- Exchange PC rack
CD--ROM drawer does not open Possible causes:
-- Power supply not correctly connected -- CD--ROM drive defective
Elimination of fault:
-- Connect power supply correctly -- Exchange CD--ROM drive
CD--ROM drawer opens, CD--ROM cannot be read Possible causes:
-- BIOS fails to detect CD--ROM drive -- IDE cable incorrectly connected -- IDE drives incorrectly configured
-- Power supply connector incorrectly connected -- CD--ROM drive faulty
-- CD--ROM defective or inserted incorrectly Elimination of fault:
-- Check CMOS entry for CD--ROM drive -- Connect IDE cable correctly
-- Configure IDE drives (master/slave, slave present, CHS/LBA) -- Exchange CD--ROM drive
-- Exchange CD--ROM or insert it correctly (label upwards!)
Operating system crashes with exceptional error (blue screen) Possible causes:
-- Defective memory module(s) Elimination of fault:
-- Exchange memory module(s)
Controller hangs when loading software components Possible causes:
-- MFC not correctly connected -- MFC defective
-- Additional expansion card (e.g. Interbus) interfering with functioning of MFC -- PCI bus on motherboard faulty
Elimination of fault:
-- Connect MFC correctly -- Exchange MFC
-- Remove expansion card and run controller up again -- Exchange PC rack
KUKA HMI does not boot and is aborted with a General Protection fault Possible causes:
-- Defective files in the software installation -- Settings in CMOS setup incorrect -- Defective memory module(s) Elimination of fault:
-- Reinstall control software -- Check settings in CMOS setup -- Exchange memory module(s)
3.2 Fault profiles related to DSE and machine data
3.2.1 Program crashes (with possible loss of mastering)
Faulty cable shields can seriously reduce the controller’s immunity against interference. In the event of error messages affecting DSE--IBS, yet for which no other cause is apparent, the connecting cable between the resolver interface and the control cabinet should be checked.
3.2.2 The robot does not move in jog mode
The robot does not move in jog mode; the brakes and servo enable remain closed. The axis-- specific actual values do change, however.
The following points must be checked:
-- Is the variable value Office=FALSE entered in the file hw_inf.ini?
(Path: C:\KRC\Roboter\init\hw_inf.ini) -- Are the correct servo files loaded?
-- Are the correct machine data configured?
If no machine data have been copied into the directory, the standard machine data in the system for the Office version are used, i.e. the axes are all in axis simulation mode.
To check the machine data, carry out the following steps:
-- By pressing the menu key “Configure” and selecting the menu item “Settings” →
“Robot name”, you can see which machine data are present and whether or not they are valid.
-- By pressing the menu key “Monitor” and selecting the menu item “Modify variable”, you can check whether or not the correct machine data have been loaded into the system. $TRAFONAME[ ] (transformation name) must contain the name of the robot and $AX_SIM_ON (axis simulation) must be zero. If $TRAFONAME[ ] is “OFFICE ROBOT KR125”, then the machine data are completely missing in the Mada directory.
-- If the machine data are incorrect, copy the correct machine data from the CD into the directory C:\KRC\Roboter\KRC\mada.
With KUKA HMI active, the machine data are overwritten again during the Power Off backup.
-- Exit the HMI beforehand, by means of EXIT, or
-- Carry out a controlled exit from the boot sequence and change the machine data
3.2.3 The drives cannot be switched on
-- Is the peripheral connector X11 plugged in?
If the connector is not connected or is incorrectly wired, the message “EMERGENCY STOP” or “Motion enable” or “Operator safety” is displayed.
-- Has the DSE booted?
If the DSE has booted, the LED on the DSE flashes.
-- Check the E--Stop circuits using the ESC diagnostic tool.
-- Is the VxWorks real--time operating system still running?
-- Is there an encoder error present at any axis?
If there is an encoder error, the controller cancels the RC Ready signal on the MFC and the brakes are applied.
-- Is there a KSD (KUKA Servo Drive) error message present? Certain errors (e.g. overcurrent, overvoltage) cause the servo drive module to deactivate the drives automatically.
3.3 DSE error messages when booting the system
3.3.1 DSE x not found
The MFC checks whether a DSE is connected. If no connected DSE is detected, the error message “DSE x not found” is generated. The loading of the machine data is canceled.
The following follow--up message is generated: “DSE axis assignment Ax, machine data loader canceled, erroneous %1 machine data”.
Possible causes:
-- DSE not connected -- DSE incorrectly configured -- DSE defective
-- MFC defective
3.3.2 Memory test error DSE x
If a connected DSE is detected, a memory test of the dual--port RAM is initiated. If this memory is faulty, the error message “Memory test error DSE x” is generated. The loading of the machine data is canceled.
The following follow--up message is generated: “DSE axis assignment Ax, machine data loader canceled, erroneous %1 machine data”.
Possible causes:
-- DSE dual--port RAM defective
-- Access via the PCI bus to the DSE memory disrupted by another plug--in card.
3.3.3 DSE x does not run up
The servo--control program for the DSE is loaded from the hard drive into the DSE memory and started when the PC is booted.
If the DSE does not boot when the program is loaded, the error message “DSE x does not run up” is generated. The loading of the machine data is canceled.
The following follow--up message is generated: “DSE axis assignment Ax, machine data loader canceled, erroneous %1 machine data”.
Possible causes:
-- DSE incorrectly configured (jumper) -- DSE defective
3.3.4 DSE axis assignment Ax
Either the error is merely a follow--up message or the axis assignment with $DSECHANNEL is incorrect.
Possible causes:
-- DSE, MFC defective (follow--up message) -- $DSECHANNEL incorrect axis assignment 3.3.5 Power module axis Ax not / incorrectly connected
The current calibration of the axes is compared with the value $CURR_CAL in the machine data list. The message is generated if the axis connector to the power module is incorrectly connected.
Further possible causes:
-- MFC/DSE, KPS or KSD function faulty
-- Ribbon cable between DSE and power module incorrectly connected or defective -- PCI bus on motherboard faulty
3.3.6 Machine data loader canceled Possible causes:
-- The error is a follow--up message relating to a previous error -- Other machine data in the machine data list are incorrect 3.3.7 Incorrect machine data
Possible causes:
-- The error is a follow--up message relating to a previous error -- Other machine data in the machine data list are incorrect
3.4 DSE error messages during operation
3.4.1 Watchdog interpolation cycle Ax
The interpolator sends one feed value per interpolation cycle to the DSE. If this transmission is interrupted for one or more cycles, the watchdog is triggered and this error message is generated.
3.4.2 Synchronization error with DSE Ax
The interpolator sends one feed value per interpolation cycle to the DSE. If the DSE does not read this feed value from the interface, the synchronization monitoring is triggered and this error message is generated.
3.4.3 Regulator limit exceeded Ax
The position controller output has gone into limitation, i.e. the axis does not follow the com- mand value. Possible causes:
G The motor is blocked because -- the brake does not release
-- the robot has caused a collision during a motion -- the axis has hit an end stop
G The acceleration is too high because
-- incorrect machine data have been loaded
-- an incorrect weight is entered in the variable $LOAD -- the weight on the tool is too high
G There is no servo--control of the motor because -- the enable signal is missing (KSD defective)
-- the motor cables have been interchanged or are defective -- the motor is not connected
G The controller amplification is incorrect 3.4.4 Stopped Ax
The axis has moved outside the standstill window, although the interpolator had not specified a movement. Possible causes:
G The brake is defective and the axis sags.
G The weight on the tool is greater than the holding torque of the axis.
G There is no servo--control of the motor because -- the enable signal is missing (KSD defective)
-- the motor cables have been interchanged or are defective -- the motor is not connected
3.4.5 Motor temperature Ax
The permissible motor temperature has been exceeded. Possible causes:
-- External temperature is too high -- Encoder cable is interrupted
-- The motion pauses in the motion program are too short
3.5 Fault profiles related to the MFC
3.5.1 Controller hangs when loading software components Possible causes:
-- MFC cannot be initialized -- MFC incorrectly connected
-- Additional expansion card (e.g. Interbus) interfering with functioning of MFC -- PCI bus on motherboard faulty
Elimination of fault:
-- Remove expansion card and run controller up again -- Check for correct fit of MFC
-- Exchange MFC
-- Exchange motherboard
3.5.2 KCP control panel does not work Possible causes:
-- CAN controller on the MFC faulty, connecting cable defective -- KCP, cable or connector faulty
Elimination of fault:
-- Exchange MFC -- Exchange KCP
3.5.3 No image on KCP Possible causes:
-- Power supply to connector X5 for KCP missing -- KCP, cable or connector faulty
-- KVGA card defective -- Defective motherboard Elimination of fault:
-- Restore power supply -- Exchange KCP -- Exchange KVGA card -- Exchange MFC
3.5.4 Operating mode switchover on KCP does not react Possible causes:
-- Mode detection on MFC defective
-- Mode selector switch on KCP, cable or connector faulty Elimination of fault:
-- Exchange MFC -- Exchange KCP -- Exchange ESC board
3.5.5 When PC is booted, the operating system VxWorks does not run up Possible causes:
-- MFC defective Elimination of fault:
-- Exchange MFC
3.6 Fault profiles related to the KCP
3.6.1 No display on the LCD Possible causes:
-- Connecting cable defective -- KVGA defective
-- KCP defective Elimination of fault:
-- Exchange connecting cable -- Exchange KVGA
-- Exchange KCP
3.6.2 Drives cannot be switched on Possible causes:
-- Connecting cable defective -- Enabling switch jammed -- KCP defective
-- ESC board defective Elimination of fault:
-- Exchange connecting cable -- Exchange KCP
-- Exchange MFC -- Exchange ESC board
3.6.3 No entries can be made via KCP Possible causes:
-- Connecting cable defective -- MFC defective (CAN bus) -- KCP defective
Elimination of fault:
-- Exchange connecting cable -- Exchange MFC
-- Exchange KCP
3.6.4 EMERGENCY STOP cannot be acknowledged Possible causes:
-- EMERGENCY STOP button defective -- Connecting cable defective
Elimination of fault:
-- Exchange KCP
-- Exchange connecting cable 3.6.5 Space Mouse does not work
Possible causes:
-- Connecting cable defective -- Space Mouse defective -- MFC defective (CAN bus) Elimination of fault:
-- Exchange connecting cable -- Exchange KCP
-- Exchange MFC
3.7 Fault profiles related to a field bus card
3.7.1 Communication via diagnostic interface not possible Possible causes:
-- Data cable, periphery faulty
-- Diagnostic interface on field bus card defective Elimination of fault:
-- Take appropriate measures on data cable, periphery -- Exchange field bus card
3.7.2 Error message “xxxxx I/O driver configuration error”
Possible causes:
-- Field bus card incorrectly configured -- Field bus card cannot be initialized
-- Incorrect configuration of the file IOSYS.INI Elimination of fault:
-- Check configuration -- Exchange field bus card -- Check entries in IOSYS.INI
3.7.3 After inserting the field bus card: no display, controller does not boot (Stop 0) Possible causes:
-- Field bus card defective
-- Field bus card interferes with MFC function Elimination of fault:
-- Exchange field bus card
3.7.4 The controller “hangs” after initialization of the field bus card Possible causes:
-- Field bus card defective Elimination of fault:
-- Exchange field bus card
3.7.5 No external power supply for slave when controller switched off Possible causes:
-- Interbus filter defective or not correctly connected -- External power supply input on IBS card defective Elimination of fault:
-- Exchange Interbus filter (if fiber--optic cable) -- Exchange Interbus card
4 Servo drive module messages and error displays
In the event of a drives error, messages are displayed in several ways.
4.1 Servo drive module LEDs (KSD1)
The operating state of the KSD is indicated by two LEDs on the front.
GN RD
Fig. 1 Servo drive module LED indicators
Red LED Green LED Meaning (message/fault)
Off Off No 24 V voltage
On Off Undefined drive servo state
Flashes quickly Flashing quickly (UIC > Ulimit) Fault present Flashes slowly Flashing slowly (UIC < Ulimit)
Flashing quickly (UIC > Ulimit)
Message is present (except in case of un- dervoltage UIC) [default value is 250 V]
Red LED Green LED Meaning (no message/fault)
Off Flashes slowly UIC < Ulimit
Off Flashes quickly UIC > Ulimit
Off On Servo enable, UIC > Ulimit
UIC: intermediate circuit voltage
Ulimit: intermediate circuit voltage = 250 V
4.2 KCP messages for drives diagnosis
The following KSD error messages are displayed in the message window of the KCP.
Display in
message window Meaning/
cause of error Troubleshooting/
possible fault elimination DRIVES ERROR
Ax No.: TRIP KSD is in a fault state; robot carries
out Emergency Stop. See detailed error message which is also displayed.
OVERCURRENT
Ax 1. Overloading of the axis
2. I2t overload 3. KSD defective
Reduce load on axis
(reduce OVR, $ACC_AXIS), exchange KSD.
SYNCHRONISA- TION ERROR DRIVE MODULE Ax
Max. permissible number of commu- nication errors with the servo bus exceeded.
Too many consecutive toggle bit er- rors; cause short--circuit braking.
Check Interbus cable between DSE, KPS and KSDs.
HEAT SINK
TEMPERATURE Ax Overtemperature, heat sink Check cabinet cooling circuit/fans;
reduce load on axis
(reduce OVR, $VEL_AXIS or
$ACC_AXIS).
Parameter error
Ax PR1 Checksum error in parameter set 1 Check KSD/restart/exchange MOTOR CABLE Ax Power unit overcurrent
(short--circuit or ground fault), hardware monitoring
Ground fault, software monitoring
Check motor cable/motor
FAILURE OF
MOTOR PHASE Ax Motor phase failure Check motor cable/motor Drives error Ax
no.: 105 Checksum error in the control unit
device set Check KSD/restart/exchange
Drives error Ax
no.: 71 Microcontroller crash Check KSD/restart/exchange
Drives error Ax
no.: 79 Communication error with the
EEPROM in the control unit Check KSD/restart/exchange Drives error Ax
no.: 80 Communication error with the
EEPROM in the power unit Check KSD/restart/exchange Drives error Ax
no.: 106 Checksum error in the power unit
device set Check KSD/restart/exchange
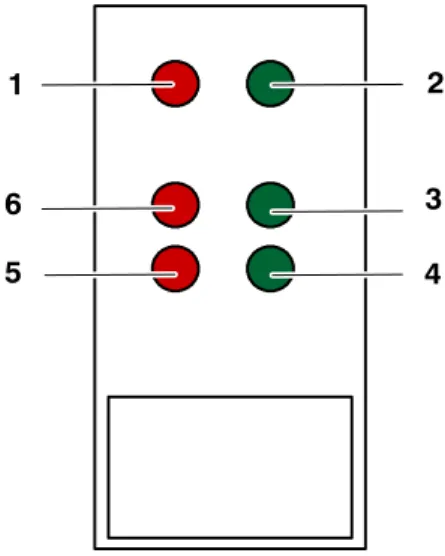
5 KPS--600 messages and error displays
5.1 KPS--600/10 and /20 LED indicators
There are six LEDs on the front of the KPS--600.
LED 1 (red) and LED 2 (green) indicate internal states of the KPS.
LED 3 (green) and LED 4 (green) are reserved for the safety logic and are not yet assigned.
LED 5 (red) and LED 6 (red) indicate the state of the brake control.
1
6 5
2
3 4
Fig. 2 KPS--600 LED indicator
5.1.1 Meaning of LEDs 1 and 2
LED 1 (red) LED 2 (green) Priority* Meaning
OFF OFF Processor without power supply
OFF Flashes at 1.5 Hz Intermediate circuit voltage < 60 V
OFF ON Intermediate circuit voltage > 60 V
Flashes at 6 Hz OFF 1 Communication error
Flashes at 3 Hz OFF 2 Brake error
ON OFF 3 Main contactor K1 stuck
Flashes 5 times at 1.5 Hz
any 4 Error in BEA signal
(signal for flow of current through the ballast resistor)
Flashes 4 times at 1.5 Hz any 5 Ballast error
Flashes 3 times at 1.5 Hz any 6 Overvoltage in intermediate circuit
Flashes twice at 1.5 Hz any 7 Overtemperature in interior /
heat sink
Flashes once at 1.5 Hz any 8 Fault in the low voltage supply
(27 V not present)
* If more than one fault occurs simultaneously, the fault with the highest priority is displayed.
(1 = highest priority, 8 = lowest priority)
5.1.2 Meaning of LEDs 3 and 4
LED 3 Meaning
Off Robot brakes not activated
On Robot brakes activated
LED 4 Meaning
Off External axis brakes not activated
On External axis brakes activated
5.1.3 Meaning of LEDs 5 and 6
Designation State of the red LED Meaning
V1 LED on General EMERGENCY STOP
activated
V2 LED on Local EMERGENCY STOP
activated
5.1.4 KPS--600 error messages on the KCP
Display in message window Meaning/cause of error Troubleshooting/
possible remedy Parameter error PMx
checksum Checksum error in
parameter set 1 Restart/exchange KPS
Parameter error PMx
Control Checksum error in the control
unit device set Restart/exchange KPS
Drives error PMx no.: 71 Microcontroller crash Restart/exchange KPS Ballast switch energized for
too long PMx during charging Ixt overload of the brake resis-
tor during charging Ballast resistor defective or not correctly connected
Ballast switch energized for
too long PMx Ixt overload of the brake resis-
tor during operation Ballast resistor defective or not correctly connected; decelera- tion phases in robot program too long; use energy recovery unit
Heat sink temperature
PMx Overtemperature, heat sink Cabinet ventilation is not work-
ing Cabinet temperature too high
PMx Overtemperature, interior Cabinet ventilation is not work-
ing Drives error PMx no.: 79 Communication error with the
EEPROM in the control unit Restart/exchange KPS Watchdog power module PMx Max. permissible number of
communication errors with the servo bus exceeded, causes short--circuit braking
Check field bus -- drives cable
Overvoltage PMx
during charging Overvoltage in intermediate
circuit while charging Mains voltage too high (trans- former may be necessary) Overvoltage PMx Overvoltage in intermediate
circuit during operation Mains voltage too high; ballast switch defective >> exchange KPS
Undervoltage PMx Low--voltage supply
undervoltage Check low--voltage supply
(rated voltage 27.1 V)
Display in message window Meaning/cause of error Troubleshooting/
possible remedy Buffer battery voltage low Battery undervoltage,
U<22 V
Charge battery
Check battery PMx Battery undervoltage,
U<19 V Charge battery
Exchange battery Undervoltage PMx
during charging Undervoltage in intermediate circuit while charging, 500 V threshold not reached
Mains voltage too low
Brake error
Ax/PMx channel x Brake error, main axes Brakes not connected or short--circuit on the brake cable
Brake error
Ax/PMx channel x Brake error, external axes Brakes not connected or short--circuit on the brake cable
Intermediate circuit charging
circuit defective PMx Optocoupler for ballast resistor current detection signals that no current is flowing
Restart/exchange KPS
K1 contactor welded PMx Main contactor K1 stuck Exchange KPS
The mastering can be saved manually via the KUKA HMI.
Before changing the battery: Setup > Master > Save current data
6 KPS--27 operating state indicators
On the front of the KPS--27 are two LEDs which indicate the operating states of the low--volt- age power supply unit:
LED indicator State Meaning
Green LED (OK) Lit Normal operation
Red LED (overload) Lit Overload operation
Red LED (overload) Flashes slowly Short--circuit operation
7 DSE--IBS operating state indicators
When the DSE--IBS is plugged in, the green diagnostic LED is on the upper side. The mean- ing of the LEDs is explained in the following table:
Green LED Meaning
Off Servo program not active
Lit Error
Flashing Servo program active – operating state OK *
* The LED display is only meaningful once the controller has booted.
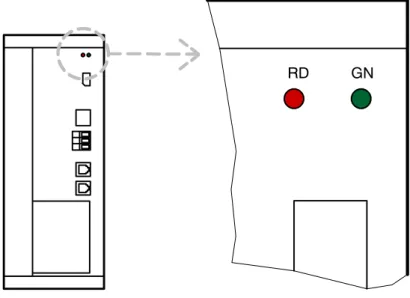
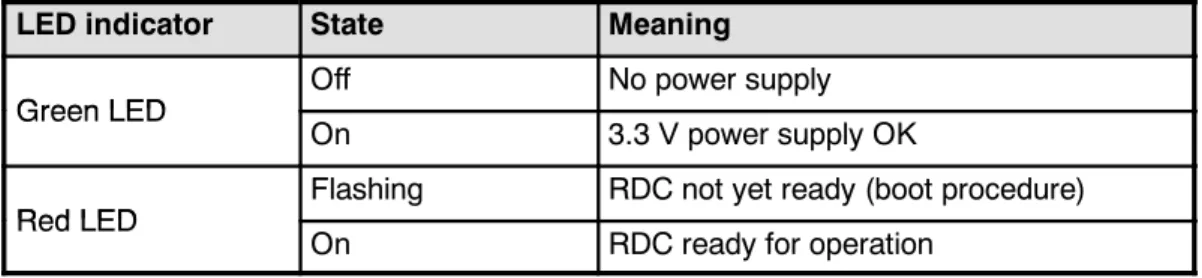
8 RDC2 operating state indicators
There are two diagnostic LEDs on the RDC2.
The meaning of the LEDs is explained in the following table:
LED indicator State Meaning
Green LED Off No power supply
Green LED
On 3.3 V power supply OK
Red LED Flashing RDC not yet ready (boot procedure)
Red LED
On RDC ready for operation
1 2
1 Green diagnostic LED 2 Red diagnostic LED
Fig. 3 LED indicators on the RDC2
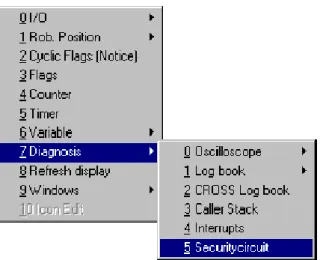
9 ESC diagnostic tool
The computer--aided safety system “ESC” (Electronic Safety Circuit) allows the permanent monitoring of all connected ESC circuit nodes. These include safety--related elements, such as Emergency Stop buttons or operator safety.
ESC diagnosis is supported from controller version “KR C2” onwards.
Only the safety circuit of the controller itself can be monitored.
Open the “Monitor” menu and select the command “Diagnosis” --> “Securitycircuit”.
The ESC diagnosis window is then displayed. The type and number of nodes available de- pend on the periphery used.
Fig. 4 Example: KR C2 standard configuration with KCP, KPS--600, MFC and CI board
The safety circuit units present are shown in the display. The passive MFC node is not dis- played. The CI board does not have a node.
The current node is highlighted by means of a selection frame (focus). Special node states are indicated in color.
ESC diagnosis can also be started without the robot controller running. To do so, open the Windows Start menu and select the option ”Run”. Enter the following command in the input line in the Run window:
“C:\KRC\Util\ESCView.exe”
9.1 Softkey bar
Pressing the softkey “Previous” places the “focus” on the next node down, thus selecting it as the current element.
If the current node has the number “1”, the node with the highest number is selected.
Pressing the softkey “Next” causes the next node up to be selected, thus making it the current element. If the current node has the highest possible number, the node with the number “1”
is selected.
The softkey “State” is used to open the status indicator of the safety circuit. Data relevant to the selected node are listed here.
Information about the selected node. Settings can be made using the softkey “Configure” or in the file “ESCDiag.ini”.
The states of an individual node and its values can be viewed here.
The values are updated cyclically.
Descriptions of the last state changed (in this example, the panic position has been pressed and released again).
If the node has a special state, i.e. it is highlighted in color, the reason can be viewed here (in this example, the drives must be activated and the enabling switch pressed).
This softkey opens the error display. Errors that are not assigned to any particular node are displayed here. These include communication errors in the safety circuit as well as hardware and software errors.
Information about the selected node.
Entries can be made using the softkey “Setup”.
List of all errors that have occurred.
Description of the selected error.
At Expert level, certain settings can be made for a specific node using the softkey “Setup”.
Global settings for the following entries:
Path of the icons used
Node color in event of error (default “red”) Node color in normal state (default “pale gray”)
Settings for the specific node:
Icon file
2 info lines displayed in the node display Comment
While ESC diagnosis is open, keep this window constantly in the foreground.
The settings of the “Setup” window are stored in the file “C:\KRC\Roboter\Init\ESC- Diag.ini”.
If errors occur while loading the .ini file, an error message is generated.
For entries that cannot be evaluated, the default values are used.
This softkey is used to close the “State”, “Error” and “Setup” windows or terminate ESC diag- nosis.
9.2 ESC diagnosis error messages
Safety circuit diagnosis display Corrective measure Byte timeout during receipt of log Check bus wiring Checksum error in log Check bus wiring
Invalid header byte Check bus wiring
Interface error Check bus wiring
Mode error Both operating modes active
Only one operating mode may be selected.
No log received Check bus wiring
Initialization error Two KCPs in the ESC circuit! Only one KCP (master) may be present in the circuit.
Configuration error Wrong configuration on ESC master (KCP).
Exchange KCP.
Hardware fault General message
PICA/PICB ESC chip from which the message comes
Communication error Check bus wiring
Software error Exchange module with software error
I/O monitoring error Check wiring to external contactor
RAM error Exchange module
Relay error Two modules are active or relays on the module are stuck
Output error General message
Output error, operating mode Relay error (operating mode) Output error, drives contactor
(auxiliary contact) Check wiring to external contactor (auxiliary contact)
Output error, local E--Stop Relay error (EMERGENCY STOP) Output error, AE coil Check wiring to external contactor Cross--connection error at:
Local E--Stop Short--circuit TA24(A) / TA24(B). Check wiring of the input for local E--Stop (NA)
Cross--connection error at:
External E--Stop Short--circuit TA24(A) / TA24(B). Check wiring of the input for external E--Stop (ENA)
Cross--connection error at:
Operator safety Short--circuit TA24(A) / TA24(B). Check wiring of the input for operator safety (BS)
Cross--connection error at: Qualify-
ing input Short--circuit TA24(A) / TA24(B). Check wiring of the input for qualifying input (QE)
Cross--connection error at:
Enabling switch 1 Short--circuit TA24(A) / TA24(B). Check wiring of the input for enabling switch 1 (ZS1)
Cross--connection error at: Mode
selector switch Short--circuit TA24(A) / TA24(B). Check wiring of the input for operating mode (Auto/Test)
Cross--connection error at:
E2 keyswitch Short--circuit TA24(A) / TA24(B). Check wiring of the input for keyswitch E2
Safety circuit diagnosis
display Corrective measure
Cross--connection error at:
Enabling switch 2 Short--circuit TA24(A) / TA24(B). Check wiring of the input for enabling switch 2 panic position (ZS2).
Cross--connection error at:
Activate drives or Drives enable Short--circuit TA24(A) / TA24(B). Check wiring of the input for Activate drives (AA) and Drives enable (AF).
10 DSE--RDW diagnostic tool
This service option offers you a range of options for displaying states and fault diagnosis as well as for configuring the DSE--RDW part of the robot system.
10.1 Main menu of the DSE--RDW diagnostic tool
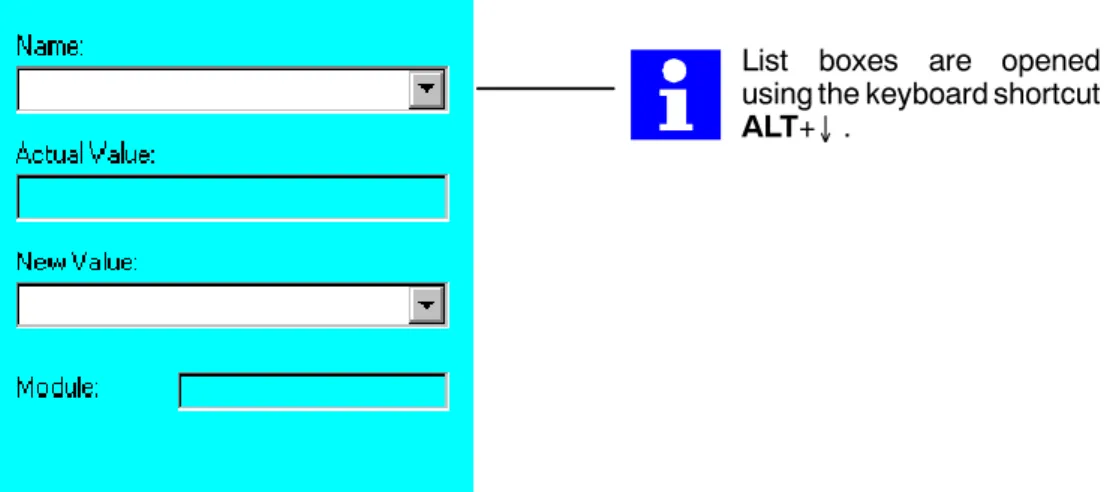
Navigate within the menus using the mouse, or use the keypad to enter the number preced- ing the menu text. The “ESC” key takes you up a level in the menu structure. Pressing the
“ESC” key at the top menu level exits the diagnostic tool.
Only alter the configuration settings if you have adequate knowledge of its function, and of the consequences of the alteration!
The contents of the EEPROM in the RDC unit can be overwritten.
These data cannot be restored simply by booting the system.
Setup > Service > DSE--RDW
Softkey assignment:
-- Recognize hardware
Initiates the update of the data in the display boxes.
10.1.1 Language selection
The language for the menus is selected via:
DSE--RDW > Language > [desired language]:
Display in the status line:
-- Version number of the DSE--RDW diagnostic tool -- Type of control cabinet
-- Current value of the DSE interrupt counter: incrementation of the counter indicates that the DSE control program is running correctly.
10.1.2 System info
Displays the operating state of the DSE.
Display box assignment:
-- Driver state: program is being executed
-- Control type: type of controller (KR C1, KR C2, KR C3) -- MFC: version of the MFC module used
-- 1. DSE: type of the first DSE module
-- State: operating state of the DSE module -- DPRAM test: result of the dual--port RAM test -- RDW: type of RDC module used
There is no second DSE present in this case; the four display boxes are identical to those for the first DSE.
Softkey assignment:
-- Recognize hardware
Initiates the update of the data in the display boxes.
10.1.3 MFC2 register display
Displays the contents of the MFC register.
Display box assignment:
-- MFC: version of the MFC module used -- Remaining display boxes: development data
Softkey assignment:
-- Start continuous display
Start / stop the continuous updating of the display -- Refresh
Triggers a one--off update of the display
10.1.4 DSE IBS information
Displays DSE hardware and software versions.
Display box assignment:
-- Control type: type of controller (KR C1, KR C2, KR C3) -- DSE hardware: hardware version of the DSE
-- DSE Clock Speed: clock frequency of the DSE used -- Remaining display boxes: internal version numbers
10.1.5 Display RDC table
Displays RDC measurement and configuration data.
Softkey assignment:
-- Start continuous display
Start / stop the continuous updating of the display -- Refresh
Triggers a one--off update of the display -- Export
Saves the current RDC table to the hard drive -- Page up / Page down
Navigation within the table
Data concerning the hardware configuration of the RDC are listed in the table from line 88 onwards.
10.1.6 RDC offset and symmetry adjustment Displays the adjustment data for all axes.
Adjustment of the following values is carried out automatically.
-- Sine offset -- Cosine offset -- Sine calibration -- Cosine calibration
In order to be able to determine the sine and cosine values correctly, every axis must have been moved through several revolutions of the motor.
Softkey assignment:
-- Set default values
The default values should be set if motors or the RDC module have been ex- changed, or if sporadic encoder errors have occurred.
10.1.7 Check RDC--DSE communication
The RDC sends data words to the DSE in a 125 µs cycle. This function can be used to check the communication between the DSE and the RDC.
Meaning of the values displayed in the message window:
-- Order: The last command the DSE has sent to the RDC.
-- Value: Motor temperatures of axes 1 to 8.
-- Error: Encoded display of the encoder error bits and EMT signals
Bit15 Bit14 Bit13 Bit12 Bit11 Bit10 Bit9 Bit8 Bit7 Bit6 Bit5 Bit4 Bit3 Bit2 Bit1 Bit0
Insignificant for diagnosis EMT Encoder error bits for the robot axes Insignificant for diagnosis
signals A8 A7 A6 A5 A4 A3 A2 A1 -- Checksum: Checksum for all transferred data.
-- Communication error state:
If more than three transmissions have failed, the value 0001 is displayed.
-- Communication error counter:
Sum of all incorrect transmissions since the last “Reset comm. errors”.
-- Axis nn: Displays the resolver positions of axis nn. The values vary during opera- tion. If a resolver position has the value zero, there is an encoder error.
Softkey assignment:
-- Start continuous display
Start / stop the continuous updating of the display -- Refresh
Triggers a one--off update of the display
10.1.8 Drive bus diagnostics
The values displayed in the message window have the following meaning:
-- Number of cycles: number of data transmissions between DSE and RDC since system switched on / reset
-- Data errors: number of data errors in the data transmissions between DSE and RDC (sporadic errors)
-- Data errors in series: number of consecutive data errors following the first three -- Ident errors: number of errors during transmission
Softkey assignment:
-- Start continuous display
Start / stop the continuous updating of the display -- Refresh
Triggers a one--off update of the display
10.1.9 Drive bus error list
Displays the error statistics with the drive bus running.
Softkey assignment:
-- Start continuous display
Start / stop the continuous updating of the display -- Refresh
Triggers a one--off update of the display -- Reset cycle counter
-- Reset errors -- Reset error list
10.1.10 Drive bus diagnostics -- KPS--2
Softkey assignment:
-- Start continuous display
Start / stop the continuous updating of the display -- Refresh
Triggers a one--off update of the display -- Export code table
Saves the current code table to the hard drive
(example: C:\KRC\Roboter\Log\Drivebus1--4_KSD1--8.log)
Meaning of the values displayed in the message window:
-- Lecom error
Lenze communication error number -- Hardware version of control and power unit
-- Various voltages, currents and temperatures of the KPS
-- Operating time counter: intermediate circuit has been active for xx hours -- Power--on time counter: KPS--2 has been active for xx hours
-- 1st and 2nd code position:
Polling of the current error memory and the last three history entries:
Code position 161: current error 162: current error --1 163: current error --2 164: current error --3
10.1.11 Drive bus KSD 1--16
Softkey assignment:
-- Start continuous display
Start / stop the continuous updating of the display -- Refresh
Triggers a one--off update of the display -- Export code table
Saves the current code table to the hard drive
(example: C:\KRC\Roboter\Log\Drivebus1--4_KSD1--8.log)
Meaning of the values displayed in the message window:
-- Lecom error
Lenze communication error number -- Hardware version of control and power unit
-- Various voltages, currents and temperatures of the KSD
-- Operating time counter: intermediate circuit has been active for xx hours -- Power--on time counter: KSD 1--16 has been active for xx hours
-- 1st and 2nd code position:
Polling of the current error memory and the last three history entries:
Code position 161: current error 162: current error --1 163: current error --2 164: current error --3
10.1.12 Error messages valid for the KPS--600
IBS trip number Lecom error
number Message text Meaning
0 0 “ok” Device state OK
1 72 “Pr1--Trip” Checksum error in parameter set 1
3 105 “HO5--Trip” Checksum error in the control unit device set
5 71 “CCr--Trip” Microcontroller crash
6 11 “OC1--Trip” Ixt overload of the brake resistor while charging
8 15 “OC5--Trip” Ixt overload of the brake resistor during operation
10 50 “OH--Trip” Overtemperature, heat sink
39 52 “OH2--Trip” Overtemperature, interior
24 79 “Pr5--Trip” Communication error with the EEPROM in the
control unit
28 65 “CE4--Trip” Max. permissible number of communication errors
with the drive bus exceeded, causes short--circuit braking
35 131 “OV1--Trip” Overvoltage in intermediate circuit while charging
36 132 “OV2--Trip” Overvoltage in intermediate circuit during opera-
tion
19 32 “LP1--Trip” Mains phase failure
31 121 “LV1--Trip” Low voltage supply undervoltage
32 122 “LV2--Trip” Battery undervoltage, U<22 V
33 123 “LV3--Trip” Battery undervoltage, U<19 V
34 124 “LV4--Trip” Undervoltage in intermediate circuit while charg-
ing, 500 V threshold not reached
41 141 “BR1--Trip” Brake error, main axes
30 142 “BR2--Trip” Brake error, external axes
37 112 “BEA--Trip” Optocoupler for ballast resistor current detection
signals that no current is flowing
40 111 “K1--Trip” Main contactor K1 stuck
10.1.13 Error messages valid for the KSDs (valid from Firmware V0.3 onwards)
IBS trip number Lecom error
number Message text Meaning
0 0 “ok” Device state OK
1 72 “Pr1--Trip” Checksum error in parameter set 1
3 105 “HO5--Trip” Checksum error in the control unit device set
5 71 “CCr--Trip” Microcontroller crash
6 11 “OC1--Trip” Power unit overcurrent (short--circuit or ground
fault), hardware monitoring
7 12 “OC2--Trip” Short--circuit, software monitoring
8 15 “OC5--Trip” I*t overload
10 50 “OH--Trip” Overtemperature, heat sink
11 91 “EEr--Trip” External error, short--circuit braking requested by
the controller
19 32 “LP1--Trip” Motor phase failure
24 79 “Pr5--Trip” Communication error with the EEPROM in the
control unit
28 65 “CE4--Trip” Max. permissible number of communication errors
with the drive bus exceeded, or too many toggle bit errors in succession, causes short--circuit braking.
43 80 “PR6--Trip” Communication error with the EEPROM in the
power unit
44 106 HO6 trip Checksum error in the power unit device set
11 Oscilloscope
The submenu “Oscilloscope” contains the two additional menu items “Display” and
“Configure”.
Using the menu key “Monitor”, open first the submenu “Diagnosis” and then the menu
“Oscilloscope”. The following submenu is displayed:
The commands in the menu bar are deactivated and cannot be selected while the oscillo- scope is being displayed or configured.
11.1 Display
This function allows you to display and analyze saved traces.
A window is opened on the display. All files which are archived in the directory C:\KRC\Roboter\TRACE and have the extension TRC are displayed here.
11.1.1 File selection
The desired file can be selected using the arrow keys. The name of the selected file is indicated by a color highlight. Move the cursor to a file having the end digit “1”. It contains data from the digital servoelectronics DSE (“3” = I/O data, “4” = interpolator data, “%” = test data).
After selecting this file, please press the softkey “Ok”.
The oscilloscope display is opened.
The softkey “2nd file” is described in more detail in the section [Superposing traces].
11.1.2 Oscilloscope screen
The contents of your screen should now look similar to those below. However, you have probably recorded other data with a different configuration. For this reason, the individual curves also have different forms and different colors on your screen.
WhiteBlue Magenta Yellow
Green BrownRed Cyan
Active color: Blue
More detailed information about the curves can be found in the upper part of the display. The color, the name, the unit of measurement and the scale of the display are listed in sequence for each curve.
The left bar (vertical) shows values which, when multiplied by the scale of the display, represent the value of a curve at a point in time that is shown below on the time axis (horizontal).
If signals from the controller’s inputs and outputs are displayed, the left bar (vertical) contains numbers as placeholders for the number of the selected inputs or outputs.
Inputs or outputs are only displayed while they have the value “TRUE”.
While an input or output has the value “FALSE”, only a broken gray line is displayed.
2nd file
White
Active color: White
Red
The “active” color is permanently displayed at the bottom left of the screen.
You can “move” through the entire trace by using the arrow keys.
You can exit the display function again at any time by pressing the softkey “Cancel”.
11.1.3 The information window
Now press the softkey “Info”. A window is opened displaying further information about the individual curves. The information window appears as follows for the example given above:
The color and the number of each curve are displayed in the first column.
The second column specifies the file from which the data for the curve have been read.
You can see the channel to which the curve has been assigned and the variable that it represents in the columns “Channel” and “Name”.
The name of the color of the curve is displayed in the column “Color”.
The last column indicates whether the curve is visible or hidden.
Press the softkey “Info” again. The window is closed. You can switch between the two functions by using this softkey.
11.1.4 The softkey bar
The softkey bar has four levels in the function “Display”.
You can switch between these four levels by using the softkey “===>”.
11.1.5 The color softkeys
To make it as easy as possible to read the display, a maximum of eight different colors (blue, green, white, red, magenta, brown, yellow and cyan) are shown.
Curves can be displayed or removed on the basis of their colors with the aid of the color softkeys. This is done quite simply by pressing the appropriate color softkey.
Hide the blue curve, for example, by pressing the softkey “Blue”. Then open the information window. Reminder: To do so, press the softkey “Info”.
Your action has been registered in the last column (far right). “Visible” now has the value “No”
for the blue curve.
Close the information window again and then make the blue curve visible once more. To do so, press the color softkey “Blue” again.
If you press color softkeys while the information window is open, color assignments will be canceled. The procedure for recovering canceled color assignments is described in the section [Changing color assignments, Section 11.1.14].
Certain graphs can be removed by selecting the desired graph in the information window and pressing the “Enter” key. More detailed information on this can be found in the section [Switching curves on and off, Section 11.1.15].
11.1.6 The scaling function
In the display, you are able to increase or reduce the amplitude of individual curves.
To do so, press the softkey “Channel” until the color of the desired curve is active. The active color is permanently displayed at the bottom left of the window.
Active color: Blue
Now observe what changes occur when you press the keys “M” or “N” in the ASCII alphabetic keypad.
Pressing the key “N” in the ASCII alphabetic keypad gradually increases the amplitude.
Pressing the key “M” in the ASCII alphabetic keypad gradually decreases the amplitude.
By using this function, it is also possible to clearly display curves which only have a small deflection or which are hidden by other curves.
The current scale is given in the top area of the display.
WhiteBlue Magenta Yellow
Green BrownRed Cyan WhiteBlue
Magenta Yellow
Green BrownRed Cyan
N M
11.1.7 The zoom function
Press the softkey “===>” repeatedly until the following softkey bar appears.
When the softkey “Zoom” is pressed, a white cross about five millimeters high appears in the middle of the window. This can be moved about the entire window using the arrow keys. Move it to the position of your choice and then press the Enter key. The point that is currently selected represents a corner point of the zoom window, which must now be expanded using the arrow keys. Include everything that you want enlarged in this zoom window and then press the Enter key again. The contents of the zoom window will then be enlarged on the display.
To undo zooming, please press the softkey “Unzoom”.
11.1.8 The Save function
Press the softkey “===>” repeatedly until the following softkey bar appears.
This softkey saves the current oscilloscope display as a bitmap on the hard disk. It is saved as a BMP file in the directory “C:\KRC\Roboter\Trace\”. The file name corresponds to the name of the trace or the loaded file. This file can then be viewed in a graphics program (MS Paint, Picture and Fax Viewer).
11.1.9 The r.m.s. value function
In order to determine the value that a curve represents during a certain period of time as easily as possible, the r.m.s. value function has been integrated.
To determine the r.m.s. value, you must press the softkey “Channel” to select the color used by the curve that is to be evaluated. The active color is permanently displayed at the bottom left of the window.
Active color: Blue
Then press the softkey “RMS”. A vertical white line with the label “Evaluation of RMS” is displayed in the window
WhiteBlue Magenta Yellow
Green BrownRed Cyan
Active color: Magenta Evaluation of RMS
Now move this line to the start point of your r.m.s. value evaluation using the “←” and “→”
arrow keys and then press the Enter key.
You can now use the “←” and “→” arrow keys to define a sort of “measuring range”, which is displayed as a white box.
WhiteBlue Magenta Yellow
Green BrownRed Cyan
Active color: Magenta
Evaluation ofRMS
After pressing the Enter key, the result of the evaluation is displayed in the window.
Should the text that is displayed be concealed by other curves and thus cannot be read, simply hide the other curves for the time being. Reminder: To do so, use the color softkeys.
To end the “RMS” function, press the softkey “RMS” again.
11.1.10 Print
If you would like to print out the contents of the screen, please press the softkey “Print”.
The screen is printed on the current default printer of the operating system; the printer should be set to “Landscape”.
11.1.11 The cursor functions
Press the softkey “===>” repeatedly until the cursor functions appear in the softkey bar.
Using these functions, you can place two vertical and two horizontal lines (cursors) inside the window. This enables you to determine the value that a curve represented at a certain time quite easily.
The color of the active curve is permanently displayed at the bottom left of the window. To change it, press the softkey “===>” repeatedly until the following functions appear in the softkey bar.
Press the softkey “Channel” until the color of the desired curve is active.
Active color: Blue
Change the softkey bar again and then press the softkey “VCursor1”. A vertical white line is displayed in the window.
Active color: Magenta
The value that the selected curve had at the time where the cursor is currently positioned is displayed at the top left of the window (two values are displayed in this illustration as the softkey “Filter off” has been selected). When inputs or outputs are displayed, the bit pattern of the selected input or output group is displayed.
Active color: Blue
Now move the cursor using the arrow keys and observe how the top left of the display changes.
Press the softkey “VCursor2”. A second vertical white line (cursor) is displayed in the window.