Green-Emitting Phosphor of LaAlGe
2O
7:Tb
3+under Near-UV
Irradiation
Yu-Chun Li,aYen-Hwei Chang,a,zYu-Feng Lin,a Yee-Shin Chang,band Yi-Jing Lina
a
Department of Materials Science and Engineering, National Cheng Kung University, Tainan 70101, Taiwan
b
Institute of Electro-Optical and Materials Science, National Formosa University Huwei, Yunlin 632, Taiwan
As the Tb3+-doped LaAlGe
2O7phosphors were synthesized by solid-state method, their characterization and luminescent proper-ties were also investigated. The extraordinary excitation spectra showed only intense f-f transition of Tb3+ions around near-UV region, while the 4f-5d transition could be neglected. Under excitation, the as-obtained powders emitted bright green light at 544 nm 共5D
4→7F5兲. By analyzing the decay curves, the energy migration between Tb3+ ions is conspicuous in5D3→7F5 transition due to the cross-relaxation in LaAlGe2O7. One of the interesting results of this work is that the excitation spectrum of the phosphor and the emission spectrum of the near-UV light-emitting diode共LED兲 have closely overlapped, which provides the potential as a near-UV LED converted phosphor in solid state lighting technology.
© 2006 The Electrochemical Society. 关DOI: 10.1149/1.2209429兴 All rights reserved.
Manuscript submitted January 16, 2006; revised manuscript received May 2, 2006. Available electronically June 9, 2006.
White light-emitting diodes共LEDs兲 are of much interest in new solid-state lighting devices. Blue LED chip coated with Y3Al5O12:Ce共YAG:Ce兲 phosphor were used to produce a white light.1,2However, this white light does not have high color rendering index共CRI兲 properties. Generally, human eyes sense higher bright-ness from the three band white light. The three band white light has high CRI values resulting in clear appearance to colored objects. Currently, tricolor phosphor of BaMgAl10O17:Eu2+, LaPO4:Ce3+,
Tb3+, and Y
2O3:Eu3+共in a 10:60:30 mixture兲 are used in fluorescent
lamps worldwide.3Nevertheless, these conventional phosphors are not ideal for white LED lighting devices because they have poor absorption in the near-UV to blue light region. Hence, another way to improve color rendering of the white LED, is to combine the red, green, and blue phosphors which can be excited by UV-LED with a wavelength of 350-400 nm. Recently, the red Y2O2S:Eu3+, green
ZnS:Cu+, Al3+, and blue ZnS:Ag+sulfide-based phosphors are being
used for white lighting, which are based on nearUV/AlGaN -LED.4 However, there are certain disadvantages in using sulfide-based materials, which are chemically unstable and the lifetime of the materials is inadequate under extended UV irradiation. The rare-earth ions are characterized by partially filled 4f shell that is well shielded by 5s2and 5p6orbitals. Therefore, the emission transitions
yield sharp lines in the optical spectra.5 The use of rare earth element-based phosphor, based on “line-type” f-f transitions, can be narrowed to the visible, resulting in both a high-efficiency and a high lumen equivalent. Accordingly, it is urgent to find a stable, inorganic rare-earth-based phosphor with high absorption in the near-UV region.
The stoichiometric formula of germanates MRGe2O7 共where M = Al3+, Ga3+or Fe3+and R = rare earth ion兲 have been reported
in the early 1980s which belongs to the monoclinic AlNdGe2O7 structure type6-8with space group of P21/c共no. 14兲. These kinds of
compounds show great interests in laser crystal physics; for in-stance, the incorporation of R3+activators into single-centered hosts
up to full substitution of all cations gives the possibility to obtain the so-called self-activated crystals. Hence, the luminescence study of a series of such compounds provides much valuable information in the optical applications. In our investigation, we prepared the rare-earth ion-doped phosphors with good stability and solid solubility because the increase of the activator concentration makes the lumi-nescence materials emit more brightly. Rare-earth ions can be sepa-rated by AlO5 and Ge2O7 polyhedra in LaAlGe2O7 and the rare earth ions have satisfactorily substituted for La3+ions. In this paper,
the LaAlGe2O7phosphors activated by Tb3+ions have been
pre-pared by solid-state reaction, and the characterization and lumines-cent properties were also investigated.
Experimental
Samples of compounds of Tb3+-doped LaAlGe
2O7were
synthe-sized by vibrating milled solid-state reaction. The starting materials are La2O3, GeO2, Al2O3, and Tb4O7共purity ⱖ 99.99%兲. After be-ing mechanically activated by grindbe-ing in a high energy vibro-mill for 15 min with zirconia balls in a polyethylene jar, the mixtures were calcined at 1250°C in air for 12 h. The heat-treatment powders were then fired under a reducing atmosphere共3% H2/97% Ar兲 at 700°C to covert Tb4+to Tb3+to obtain higher emission intensity. Certainly, this reduction process improved the emission intensity by about 30–40%. The powders present a white color, which indicates that all terbium ions are in the trivalent state.
The X-ray diffraction 共XRD兲 profiles were measured with a Rigaku D/max X-ray diffractometer, using Cu K␣ 共 = 1.5406 Å兲. The data of all the samples are single phase without any impurity, which indicates that the Tb3+ions have satisfactorily substituted for
La3+ions in the lattice. The ambient temperature photoluminescence
共PL兲 spectra were obtained by Hitachi F-4500 fluorescence spectro-photometer equipped with a Xe lamp. Optical absorption spectra were measured at room temperature using a Hitachi U-3010 UV-visible spectrophotometer.
Results and Discussion
Trivalent terbium with 4f8configuration has complicated energy levels and various possible transitions between f levels. The transi-tions between these f levels are highly selective and of sharp line spectra. For convenience, the photoluminescence excitation spec-trum of LaAlGe2O7:Tb and the optical absorption spectrum of
LaAlGe2O7 host lattice are shown in Fig. 1. The series of sharp excitation peaks between 250 and 500 nm correspond to the Tb3+
intra-4f 共4f8-4f8兲 transitions. A different phenomenon is noted by comparing with the conventional Tb-doped phosphors,9-11 the par-ticularly noteworthy one is that the remarkably weak 4f-5d transi-tion band of Tb3+ion around 235 nm could be detected in the
exci-tation spectra. This phenomenon is uncommon because the typical Tb-activated phosphors always show strongly 4f-5d transition band absorption around 200–300 nm. The major absorption edge of pure LaAlGe2O7 is situated ⬃240 nm. It might be acceptable that the 4f-5d transition band overlap the absorption band of the host lattice, so that the 4f-5d transition has less contribution to the excitation. In fact, the existence of 4f-5d transition band in the spectrum is almost ignored. The uneven components mix a small amount of opposite-z
E-mail address: [email protected]
Electrochemical and Solid-State Letters, 9共8兲 H74-H77 共2006兲
1099-0062/2006/9共8兲/H74/4/$20.00 © The Electrochemical Society
H74
parity wave functions共like 5d兲 into the 4f wave functions. In this way the intraconfigurational 4fntransitions obtain some intensity. The forbidden 4f-4f transition steals some intensity from the al-lowed 4f-5d transition.5This may be the reason that LaAlGe2O7:Tb shows intense f-f absorption. Additionally, it is recognized that only direct excitation of Tb3+ ions could be observed and no efficient
energy transfer occurs between activator and host. The optimum emission performance is provided by excited at⬃370 nm corre-sponding to the 7F6→5L10transition of Tb3+in the near-UV
re-gion.
The effects of the concentration of Tb3+ions emission behavior of La1−xTbxAlGe2O7as a function of x under excitation at 370 nm
are illustrated in Fig. 2. The characteristic blue and green emission peaks are corresponding to Tb3+intra-4f transitions from the excited
levels to lower levels: 5D3→7FJ共J = 2, 3, 4, 5, 6兲 and 5D4
→7F
J共J = 3, 4, 5, 6兲 transitions, respectively. It is obvious that
the emission spectra show a completely different ratio between the
blue 5D3 and the green 5D4 emissions at lower and higher Tb3+
concentration. As can be seen, the intensity of the emission from
5
D3 decreases with the increasing Tb3+ concentration due to the cross-relaxation. This is the process whereby excitation energy from an ion decaying from a highly excited state promotes a nearby ion from the ground state to the metastable level. In trivalent terbium, the energy gap between the 5D3 and 5D4 levels is close to that between the7F6and7F0levels. As a result, if the Tb3+concentration
is sufficiently high, the higher energy level emission can be easily quenched in favor of the lower energy level emission.12The follow-ing cross-relaxation may occur
Tb3+共5D3兲 + Tb3+共7F6兲 → Tb3+共5D4兲 + Tb3+共7F0兲 关1兴 This process depends on the interaction between two nearby Tb3+ions so that the cross-relaxation occurs only above the critical
Tb3+concentration.
Figure 3 presents the luminescent intensity and decay time of
5D
3→ 7F5 transition in terms of Tb3+ concentration in
La1−xTbxAlGe2O7powders. The results reveal that the intensity of
5D
3→
7F
5 transition gradually increases with Tb3+ content and
reaches to a maximum of x = 0.01 and then diminishes. While the lifetime declines slightly by increasing Tb3+concentration up to x
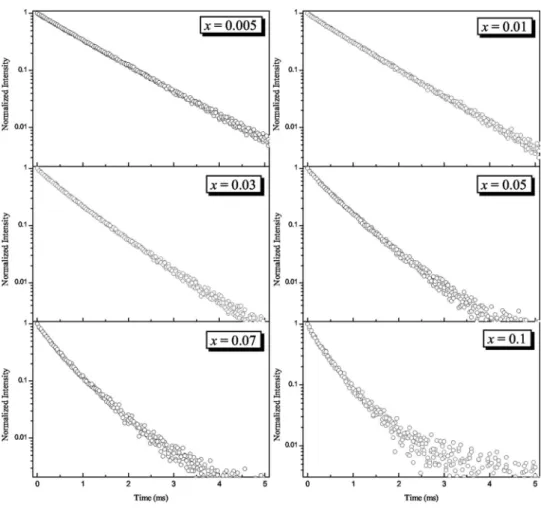
= 0.01, and then begins to decrease rapidly. Such behaviors indicate that the concentration quenching13is active as the x⬎ 0.01. On the other hand, the decay curve of5D3→7F5transition is also greatly affected by the Tb3+ concentration. Figure 4 depicts the decay
curves of5D3→7F5transition of Tb3+under excitation at 370 nm. A single exponential decay is observed for the diluted sample. For higher concentration 共x ⬎ 0.01兲, however, the observed decay curves become nonexponential, and the nonexponential change is getting more prominent as x increases, which indicates that more than one relaxation process exists. When the luminescent centers have different local environments, the associated ions will relax at different rates. If the rates are dramatically different, the diverse decay curves would also be easily observed. Nevertheless, the low-doped samples have single exponential decay curve with the longer lifetime that may rule out this possibility. Additionally, it is unlikely that only one site with the shorter lifetime is populated for higher concentration. As previously mentioned, it is clear that a study of the cross-relaxation over ion-ion interaction between two neighboring Tb3+ions would be beneficial to clarify this issue. The energy
trans-fer process between the activator ions provides an extra decay chan-nel to change the decay curves. With the increase of Tb3+ concen-tration, the distance between Tb3+ions decreases; subsequently, the Figure 1. Excitation and absorption spectra of LaAlGe2O7: Tb and blank
LaAlGe2O7, respectively.
Figure 2. Emission spectra of共La1−xTbx兲AlGe2O7phosphor under excitation at 370 nm.
Figure 3. The relationship of Tb3+emission intensity and decay time of the 5D
3→7F5transition with Tb3+concentrations in共La1−xTbx兲AlGe2O7under excitation at 370 nm. The signals were detected at 414 nm.
H75
Electrochemical and Solid-State Letters, 9共8兲 H74-H77 共2006兲 H75
energy transfer共5D3-5D4 cross-relaxation兲 between Tb3+ ions
be-comes more frequent. Thus the decay rate will be different, resulting in a nonexponential decay curve.14,15
The energy transfer occurs from one activator to another until an energy sink in the lattice was reached; it is possible to obtain the critical distance共Rc兲 from the concentration quenching data. Rc is the critical separation between donor 共activator兲 and acceptor 共quenching site兲, for which the nonradiative transfer rate equals the internal decay rate. Blasse16assumed that for the critical concentra-tion the average shortest distance between nearest activator ions is equal to the critical distance. The LaAlGe2O7 contains a unique
crystallographic site available for the activator共Tb3+instead La3+兲,
so that only one type of centre is present. Hence, it is suitable to obtain the critical distance from the concentration quenching data using
Rc= 2
冉
3V 4xcN冊
1/3
关2兴 where xcis the critical concentration, N is the number of La3+ions
in the LaAlGe2O7unit cell共Tb3+ions are assumed to be introduced
solely into La3+ sites兲, and V is the volume of the unit cell
共545.45 ⫻ 10−30m3 in this case兲. For 5D
3→
7F
5 transition, the
critical concentration is estimated to be about 1 mol %, where the measured emission intensity and decay time begin to decrease quickly. Using the above equation, the Rc was determined to be
about 29.6 Å for the5D3-5D4cross-relaxation.
The emission and decay time behaviors of the5D4→ 7F5 tran-sition dependent on the Tb3+content under excitation at 370 nm are
illustrated in Fig. 5. The dependence of decay time with Tb3+
con-centration of 5D4→ 7F5 transition is analogous to that of 5D3
→7
F5transition. The decay time also begins to decrease more rap-idly at x = 0.6 as the concentration quenching occurs. The emission intensity, however, is not obviously reduced in contrast with the
5D
3→
7F
5emission. From the Eq. 2, the Rc of5D4→ 7F
5
transi-tion was calculated to be about 7.6 Å, which was much shorter than
5D
3→ 7F5transition.
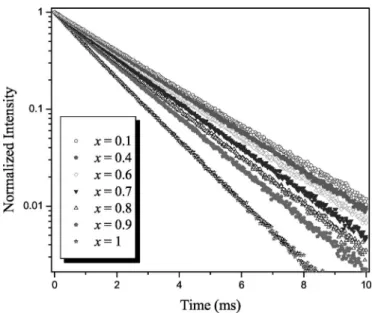
The decay curves of5D4→ 7F5transition of Tb3+under
excita-tion at 370 nm are represented in Fig. 6. Before concentraexcita-tion quenching共x ⬍ 0.6兲 occurs, the decay curves show a nearly single exponential decay and does not vary obviously with Tb3+
concen-tration. A monoexponential fit yields a decay time between 2 and 3 ms, which is a typical value compared to the5D4emission of Tb3+
in oxides.17,18 In contrast with 5D3→ 7F5 transition, the decay
Figure 4. Normalized decay curves of
5D
3→7F5emission for various Tb3+ con-centrations in 共La1−xTbx兲AlGe2O7 under excitation at 370 nm.
Figure 5. The dependence of Tb3+emission intensity and decay time of the 5D
4→7F5transition with Tb3+concentrations in共La1−xTbx兲AlGe2O7under excitation at 370 nm. The signals were detected at 544 nm.
H76 Electrochemical and Solid-State Letters, 9共8兲 H74-H77 共2006兲
H76
curves are apparently different. Time-resolved5D4→ 7F5emission shows a single exponential decay even when all sites are occupied by Tb3+ions. The decay curves can be represented by19
I = I0f exp共− t/兲 关3兴
where I and I0are the luminescence intensities at time t and 0, is
the radiative decay time. This result reveals that the presence of Tb3+environment is unique in according with the crystal structure
and the decay mechanism of5D4→7F5transition is a single decay component in the rapid transfer case between Tb3+ions only.20By analyzing the decay curves, it shows that5D3→7F5transition is highly concentration dependent and is easier quenched than 5D4
→7F
5transition in LaAlGe2O7.
Recently, the sulfide-based phosphors were reported to be good excitation efficiency for blue to near-UV LED.21,22Therefore, the commercial green sulfide phosphor ZnS:Cu+, Cl− is available used as the standard for the luminescence properties measurement. The luminescence properties of La1−xTbxAlGe2O7and ZnS:Cu+, Cl−are
listed in Table I. The maximum emission intensity is about 25% higher than the commercial green phosphor. Furthermore, the emis-sion band of La1−xTbxAlGe2O7is very sharp with the full-width at half maximum共fwhm兲 about 5 nm. This property is suitable for the application in tri-color mixture lighting, leading to high color ren-dering index.
Conclusions
A highly efficient green emitting phosphor, Tb3+-activated LaAlG2O7, was synthesized and its luminescence properties have
been investigated. In the photoluminescence excitation spectra, only the intense f-f transitions could be found. This phenomenon is un-usual for conventional Tb-activated phosphors. From decay curves analyses, the energy migration between Tb3+ ions was more
pro-nounced in5D3→7F5transition than in5D4→ 7F5transition. The critical distance of the 5D3-5D4 cross-relaxation and 5D4→7F5 transition are about 29.6 and 7.6 Å, respectively. The investigation reveals that the efficient emission performance was provided by
ex-cited at near-UV region. This result shows that this material is an attractive candidate as a potential UV-LED converted phosphor in white-lighting technology.
Acknowledgment
The authors thank the National Science Council of the Republic of China for financially supporting this research through contract no. NSC94-2216-E-006-017.
National Cheng Kung University assisted in meeting the publication costs of this article.
References
1. Y. Shimizu, K. Sakano, Y. Noguchi, and T. Moriguchi, U.S. Pat. 5,998,925共1999兲. 2. P. Schlotter, R. Schmidt, and J. Schneider, Appl. Phys. A: Mater. Sci. Process., 64,
417共1997兲.
3. C. Feldmann, T. Justel, C. R. Ronda, and P. J. Schmidt, Adv. Funct. Mater., 13, 511 共2003兲.
4. T. Nishida, T. Ban, and N. Kobayashi, Appl. Phys. Lett., 82, 3817共2003兲. 5. G. Blasse and B. C. Grabmaier, Luminescent Materials, p. 25, Springer-Verlag,
New York共1994兲.
6. O. Jarchow, K.-H. Klaska, and H. Schenk, Naturwiss., 68, 475共1981兲. 7. O. Jarchow, K.-H. Klaska, and H. Schenk-Strauss, Z. Kristallogr., 172, 159共1985兲. 8. A. A. Kaminskii, B. V. Mill, A. V. Butashin, E. L. Belokoneva, and K. Kurbanov,
Phys. Status Solidi A, 103, 575共1987兲.
9. A. Mayolet, W. Zhang, E. Simoni, J. C. Krupa, and P. Martin, Appl. Phys. B, 4, 757共1995兲.
10. Y. C. Kang, I. W. Lenggoro, K. Okuyamaa, and S. B. Park, J. Electrochem. Soc.,
146, 1227共1999兲.
11. K. S. Sohn, J. M. Lee, I. W. Jeon, and H. D. Park, J. Electrochem. Soc., 150, H182 共2003兲.
12. S. Shionoya, W. M. Yen, Phosphor Handbook, p. 185, CRC Press, Boca Raton, FL 共1999兲.
13. A. H. Kitai, Solid State Luminescence, p. 39, Chapman and Hall, London共1993兲. 14. K. S. Sohn, Y. G. Choi, Y. Y. Choi, and H. D. Park, J. Electrochem. Soc., 147,
3552共2000兲.
15. J. K. Park, C. H. Kim, C. H. Han, H. D. Park, and S. Y. Choi, Electrochem.
Solid-State Lett., 6, H13共2003兲.
16. G. Blasse, Philips Res. Rep., 24, 131共1969兲.
17. Y. Y. Choi, K. S. Sohn, H. D. Park, and S. Y. Choi, J. Mater. Res., 16, 881共2001兲. 18. X. M. Han, J. Lin, H. L. Zhou, M. Yu, Y. H. Zhou, and M. L. Pang, J. Phys.:
Condens. Matter, 16, 2745共2004兲.
19. D. R. Vij, Luminescence of Solids, p. 68, Plenum Press, New York共1998兲. 20. G. Blasse and B. C. Grabmaier, Luminescent Materials, p. 96, Springer-Verlag,
New York共1994兲.
21. Y. Sato, N. Takahashi, and S. Sato, Jpn. J. Appl. Phys., Part 1, 35, L838共1996兲. 22. Y. D. Huk, J. H. Shim, Y. Kim, and Y. R. Do, J. Electrochem. Soc., 150, H57
共2003兲.
Figure 6. Normalized decay curves of5D4→7F5emission for various Tb3+ concentrations in共La1−xTbx兲AlGe2O7under excitation at 370 nm.
Table I. Comparison of emission peak intensity and fwhm be-tween ZnS:Cu+, Cl−, and La
1−xTbxAlGe2O7phosphors under ex-citation at near-UV wavelength
Phosphors Emission intensitya fwhm
ZnS:Cu+, Cl− 100 77 La0.9Tb0.1AlGe2O7 48 5 La0.8Tb0.2AlGe2O7 86 5 La0.7Tb0.3AlGe2O7 100 5 La0.6Tb0.4AlGe2O7 112 5 La0.5Tb0.5AlGe2O7 116 5 La0.4Tb0.6AlGe2O7 125 5 La0.3Tb0.7AlGe2O7 120 5 La0.2Tb0.8AlGe2O7 122 5 La0.1Tb0.9AlGe2O7 114 5 TbAlGe2O7 84 5
aThe ZnS:Cu+, Cl− was excitation under optimal wavelength at 383 nm in the near-UV region, while the La1−xTbxAlGe2O7was ex-citation under 370 nm.
H77
Electrochemical and Solid-State Letters, 9共8兲 H74-H77 共2006兲 H77