行政院國家科學委員會專題研究計畫 成果報告
利用瞬時相位移及數位影像相關法於表面形貌量測之研究
研究成果報告(精簡版)
計 畫 類 別 : 個別型
計 畫 編 號 : NSC 98-2221-E-006-042-
執 行 期 間 : 98 年 08 月 01 日至 99 年 10 月 31 日
執 行 單 位 : 國立成功大學機械工程學系(所)
計 畫 主 持 人 : 陳元方
計畫參與人員: 碩士班研究生-兼任助理人員:陳逸群
碩士班研究生-兼任助理人員:陳建祥
報 告 附 件 : 出席國際會議研究心得報告及發表論文
處 理 方 式 : 本計畫可公開查詢
中 華 民 國 100 年 01 月 31 日
行政院國家科學委員會補助專題研究計畫
■ 成 果 報 告
□期中進度報告
利用瞬時相位移及數位影像相關法於表面形貌量測之研究
計畫類別:■個別型計畫 □整合型計畫
計畫編號:NSC 98 2221-E -006- 042
-
執行期間:98 年 8 月 1 日至 99 年 10 月 31 日
執行機構及系所:國立成功大學機械工程學系
計畫主持人:陳元方
共同主持人:
計畫參與人員:陳逸群、陳建祥、陳志賢
成果報告類型(依經費核定清單規定繳交):■精簡報告 □完整報告
本計畫除繳交成果報告外,另須繳交以下出國心得報告:
□赴國外出差或研習心得報告
□赴大陸地區出差或研習心得報告
■出席國際學術會議心得報告
□國際合作研究計畫國外研究報告
處理方式:
除列管計畫及下列情形者外,得立即公開查詢
□涉及專利或其他智慧財產權,□一年□二年後可公開查詢
中 華 民 國 99 年 12 月 30 日
一、 前言、研究目的
表面形貌量測在半導體及光學元件製造上是一項重要的技術。隨著微奈米科技的發展,對產品的性
能及品質的要求越來越高;因此,如何在生產線上做到快速且精確的檢測產品的
3D 形貌,確保產品製
程的良窳,即成為高科技產業成功發展的一個重要關鍵。在相關的檢測技術中,光學非接觸量測越來越
受歡迎,其原因為量測速度很快,可以直接得到全場的表面貌,精度可達到微米,甚至奈米等級,對一
些現代工業而言已經可以符合需求。在光學干涉量測的方法中,相位移(Phase-Shifting)技術是最廣為使
用的方法之一,通常是利用步進馬達(Stepping Motor)或是壓電致動器(Piezoelectric Actuator)來推動試件或
是參考鏡,或是利用轉動偏光板以得到不同相位值的干涉條紋影像;由於不論是利用步進馬達、壓電致
動器或是轉動偏光板,不同相位移之干涉條紋影像是在不同時間擷取所得,花費的時間較長,容易受到
環境振動或空氣擾動等影響,造成量測較大之誤差及不穩定;同時,其量測精度亦會受到步進馬達或壓
電致動器的位移精度影響,因而不適用於線上量測的狀況。因此,發展瞬時
(Instantaneous)或同步
(simultaneous)相位取像技術及分析系統,以同時擷取到不同相位移之干涉條紋圖,減少外在環境振動與
量測時間過長所造成的影響,測得待測物的表面形貌,即成為提升產業發展的重要關鍵之一。
本研究發展出一套可以瞬時(或同步)擷取不同相位移干涉條紋圖像之量測系統,利用 Jones Matrices
推導設計一新的偏光相位移干涉系統,建構一四影像鏡組,運用單一
CCD 同步瞬時擷取不同相移之干
涉條紋,經過灰階校正及數位影像相關法自動對正各影像之位置,利用相位移法以及相位展開法,求得
相位值並轉換得到待測物的表面形貌。研發之系統並經平面鏡及晶圓進行實測,以驗證及探討此量測系
統之準確性、誤差及穩定性。
二、
文獻探討
Kwon[1]於 1984 年首先提出利用具有針孔之光柵基板之點繞射(Point Diffraction)元件可建立多通道
之相位移干涉儀,加快量測速度,並降低干涉儀之元件數及複雜度以及減少成本。1998 年,Helen[2]等
人提出利用消色差旋轉的偏光板(Polaizer)可造成相位變化,可用以建立相位移干涉儀,並說明應用時相
位移與光源波長並無關係。2000 年,Hettwer [3]等人利用繞射光柵(Diffraction Grating)、二分之一波板、
極化分光鏡、四分之一波板及單一
CCD,建立三步相位移干涉儀用於動態及較差環境之量測,探討其主
要誤差有來自各不同相位移干涉條紋影像間像素與像素不對正之問題,以及其各干涉條紋影像間光強不
同的問題。對於繞射光柵而言,需較精確的製造技術,才能使擷取之干涉條紋具有正確的相位移。2001
年,Ngoi[4]等人設計利用極化分光鏡、四分之一波板、極化分光鏡、分光鏡組及四個 CCD 建立瞬時相
位移干涉系統,其試件面與參考面之分光是利用透明玻璃板鍍上一層雙折射材料來進行;其各不同相位
移之干涉條紋位置之校正,則是以手動的方式來進行,耗時較長,且其各干涉條紋影像像素之位置可能
會有較大的誤差。Mitsutani[5]等人則在其專利中,利用分光鏡、直角稜鏡組合成攝像裝置(Image Pickup
Device),將干涉條紋分為三道具不同相位移之光,應用於表面形貌量測。2003 年,Sivakumar [6]等人進
一步利用極化分光鏡、偏極板、四分之一波板、改良式之麥克森干涉儀、四個
CCD 及 He-Ne 雷射光源,
建立瞬時相位移干涉量測系統,用以量測大面積之反射面。採用手動的方式校正其各不同相位移干涉條
紋影像之位置,因此其條紋影像像素之對正也可能會有較大的誤差,利用四個
CCD 同步取像,系統較
覆雜且不經濟。2003 年,Wyant[7]等人在其專利中,利用分光元件(Beamsplitter element)結合 Fiezau 干
涉儀建立瞬時相位移干涉系統。其分光元件包括了反射,折射或繞射元件等。國內之相關研究,則有將
偏光相移技術應用於平坦度[8]之量測,因其需轉動偏光元件產生相移,依序取像,並非同步產生,因此
無法避免外在環境及振動的影響,尚不適用於線上的量測。
三、
研究方法
1. 瞬間相位移干涉原理
為達到瞬時擷取四張相移影像之目的,設計製作之單一 CCD 系統架構如圖 1 所示;其中以分光鏡
與直角透鏡組成之鏡組(BS & RAP Set)如圖 2(a)所示,此鏡組可將進入之影像一分為四。經圖 2(b)所示之
偏光板組擺置獲得不同相位。另外
L2 與 L3 為聚焦透鏡,用以調整通過分光鏡和直角透鏡組之光束大小,
以符合
CCD 上影像感測晶片的大小。圖中 QWP45°代表極化方向為 45°的四分之一波板,PBS 代表極化
分光鏡。
L1 為聚焦透鏡。P0°、P45°、P90°與 P(-45°)分別代表極化軸方向 0°、45°、90°與-45°的偏光板。
以 P45°的光路來看,雷射光源射入分光鏡 PBS 後,各經過 QWP45°投射到試件面與參考面,反射
後再次經過
QWP45°、PBS,之後共同通過 QWP45°、 BS & RAP Set ,最後通過 P45°之後,在 CCD
擷取到的干涉光強大小如(1)式:
(a) (b)
圖
2 (a)分光鏡與直角稜鏡組:(b)偏光板組
(1)
其中
a 為試件面反射光強,b 為參考面反射光強,α 為光路徑差所造成之相位差值,與試件面與參考面之
高度差有關。同理,在
P90° 、 P(-45°) 、 P0°上所擷取到的干涉光強大小可表示為(2)~(4)式:
(2)
(3)
(4)
2 四步相位移法及相位展開
將四張相位移影像相應各像素點之灰階值代入(5)式之計算公式,即可得到條紋影像上各
像素點的相位值
α。
(5)
因(5)式是以反正切(tan-1)函數為運算基礎,故計算出來之相位值會介於-π/2 與π/2 之間。但相位值理應
介於
0~2π間,故可利用相位象限判別將相位值恢復到 0~2π區間。然而經判斷後得到的相位值,相位
會截斷在
0 到 2π之區間內,因此利用 Macy[9]相位展開法,將被截斷的相位恢復為原來連續的相位;此
過程乃是將相位中相鄰兩相位差超過某一定限度者,加上或減去差值來消除截斷,恢復連續相位。由於
相位值與光程差之關係為
2π=λ,由圖 1 可知,干涉光程差為試件面與參考面高度差
值之兩倍,故相位值
a 與試件面和參考面之高度差值 h 如(6)式:
(6)
2 2 21
π
I = (a + b + 2ab cos[α - ])
2
2
2 2 31
I = (a + b + 2ab cos[α - π])
2
2 2 41
3π
I = (a + b + 2ab cos[α -
])
2
2
2 4 -1 1 3I - I
α(x, y) = tan (
)
I - I
11
(
2 22
cos[ ])
2
I
a
b
ab
( , )
( , )
4
h x y
x y
3. 數位影像相關法(Digital Image Correlation)[10]
利用相位移法計算相位值時,需確保具不同相位移之干涉條紋影像上各相素(Pixel)對齊。傳統之做
法為調整各CCD之位置,使其擷取之影像位置相同,但此一做法相當耗時。因此在本文中利用數位影像
相關法計算各CCD所擷取之影像位置差異,並利用此一計算出之位置差異調整各不同相位移之干涉條紋
影像,使其各相素皆對齊。
影像(Image)為一個二維的光強函數 f(x,y),其中 x 和 y 表示空間座標,而任意點(x,y)的光強函數 f(x,y)
值正比於該點影像的亮度(或灰階)。為了使計算機能易於處理,必須將光強函數 f(x,y)進行量化,將影像
轉為二維矩陣。其行和列的值即為影像中該點的座標,而相對應的矩陣元素為該點的灰階值。此數位矩
陣的元素稱為像素(Pixel)。灰階值的範圍從 0 到 L,代表由黑到白連續變化的灰度濃淡程度。
假設物體在移動前後各點灰階不變,並且為一對一之狀態。我們利用
CCD 照相機擷取試件在移動前
後之影像,在取像過程中
CCD 照相機保持不動且垂直於圖面。此取像區域上任一點在移動後的位置
(x , y ) 可以表示成
x
=x+u (7)
y
=y+v
(8)
因此當(u,v)二個參數被決定時,則未移動試件表面上的這一個區域會對應到移動後的區域。
決定移動前與移動後的影像是否有符合,完全是依據移動前後同一點的影像灰階值不變的規則來進
行的。若令移動前座標點(x,y)之灰階值為 G
0(S),移動後座標點
( , )x y 之灰階值為
G
d(
s),G
0(S)與 G
d(
s)
之間的關係為
G
0(S)=G
d(
s)。在此我們使用最小平方關係法(Least-Square Correlation),將其標準化,可得
一相關值函數
C(p)如式(9)
(9)
4.系統架構及實驗
單一 CCD 之系統,讓其四張具不同相位之干涉條紋影像於同一 CCD 擷取,減少其影像擷取時間,
能同步擷取不同相位移之干涉條紋,其實驗系統架構圖如圖
3 所示: 其元件規格如下:
(1)CCD 相機 :Polariod 公司 DMC 2 ,解析度 1600
1200 Pixel。
(2)影像擷取卡:TekrAm 公司 DC-395U PCI SCSI 卡
(3)雷射光源:He-Ne Laser 波長 632.8nm。
實驗流程如圖
4 所示:
2 0 d 2 0 [G (s) - G (s )] s S,s S C(p) = G (s) s S
圖
3 單一 CCD 系統實驗架設圖 圖 4 實驗流程圖
四、
結果與討論(含結論與建議)
1 平面鏡量測
對於一傾斜之平面鏡,單一 CCD 實驗系統其所擷取之干涉條紋影像如圖 5 所示。同理經相位移與相
位展開之後,可得其相位圖及相位展開圖如圖
6(a)、(b)所示。利用計算出之相位值轉成高度值,可得平
面鏡的表面高度值及其表面形貌圖,其結果如圖
7 所示。重覆做 10 次實驗之後,將相同的位置之量測高
度值與
α-Step 形貌量測儀所量測出之高度值做一比較,其結果如表 1 所示。其平均誤差為 0.089μm,誤
差標準差為
0.048μm,最大誤差為 0.166μm,再現性為 0.013μm。其平均誤差最大與平均誤差最小之兩組
量測結果與
α-Step 形貌量測儀所量測出之數據比較之結果如圖 8(a)與(b)所示。由圖 8 可看出其兩組形貌
相似,也顯示了外在環境對於本實驗系統影響不大。
(a) (b) (c) (d)圖
5 單一 CCD 實驗系統所擷取傾斜平面鏡不同相位干涉條紋影像:(a)0;(b)π/2;(c) π;(d) 3π/2
(a) (b)圖
6 單一 CCD 實驗系統量測傾斜平面鏡:(a) 相位圖;(b)相位展開圖
圖
7 單一 CCD 實驗系統量測傾斜平面鏡表面形貌圖
(a) (b)圖
8 單一 CCD 實驗系統量測平面鏡數據與 α-Step 量測數據之比較:(a)誤差最小時;(b)誤差最大時
表
1 單一 CCD 實驗系統傾斜平面鏡形貌重覆量測 10 次結果之誤差統計
2. 晶圓量測
利用單一
CCD 實驗系統量測晶圓,所擷取之具不同干涉條紋影像如圖 9 所示。應用相位移計算與
相位展開之後,可得其相位圖與相位展開圖,分別如圖
10(a)、(b)所示,再經相位值與高度之轉換,可
得其表面形貌,如圖
11 所示。重覆做 10 次實驗之後,將相同的位置之量測高度值與 α-Step 形貌量測儀
所量測出之高度值做一比較,其結果如表
2 所示。其平均誤差為 0.095μm,平均誤差標準差為 0.049μm,
最大誤差為
0.172μm,再現性為 0.013μm。另取出平均誤差最大與平均誤差最小之兩組數據,量測之高
度與
α-Step 形貌量測儀所量測出之數據比較之結果如圖 12(a)、(b)所示。同樣的,圖 12 之兩組形貌相似,
單一
CCD 實驗系統也較不受外在環境因素之影響。
(a) (b) (c) (d)
圖
9 單一 CCD 系統所擷取晶圓不同相位干涉條紋影像:(a)0;(b)π/2;(c) π;(d) 3π/2
(a) (b)
圖
10 單一 CCD 系統量測晶圓:(a)相位圖; 圖 11 單一 CCD 系統量測晶圓之表面形貌圖
(b)相位展開圖
表
2 單一 CCD 實驗系統晶圓形貌重覆量測十次結果之誤差統計
(a) (b)
圖
12 單一 CCD 系統晶圓量測數據與 α-Step 量測之數據比較:(a)誤差最大時;(b)誤差最小時
本研究建立了一套瞬時偏光干涉表面形貌量測系統,運用單一 CCD 瞬時同步取像量測,減除外在環
境振動與量測時間過長所造成的影響,將具有應用於線上量測的能力,極具實際運用的價值。其具有下
列之優點:
1.可同時擷取不同相位移之干涉條紋影像。
2.較不易受環境影響。
3.量測時間較其他種干涉儀短。
參考文獻
1. O. Kwon, “Multichannel Phase-Shifted Interferometer”, Optics Letters, Vol. 9. NO. 2, 59-61, 1984
2. S. Suja Helen, M.P. Kothiyal, R.S. Sirohi, “Achromatic Phase-Shifting by A Rotating Polarizer”,Optics
Communications, Vol. 154, P249-254, 1998
3. A. Hettwer, J. Kranz, J. Schwider, “Three Channel Phase-Shifting Interferometer Using Polarization-Optics
and A Diffraction Grating”, Opt. Eng. 39, 960-966, 2000
4. B.K.A. Ngoi, K. Venkatakrishnan, N.R. Sivakumar, T. Bo, “Instantaneous Phase Shifting Arrangement for
Microsurface Profiling of Flat Surfaces”, Optics Communications 190, 109-116, 2001
5. N. Mitsutani, H. Handa, K. Kawasaki, H. Haino, “Shape Masuring Apparatus”, U.S Patent 6,496,269, 2001
6. N.R. Sivakumar, W.K. Hui, K. Venkatakrishnan, B.K.A. Ngo, “Large Surface Profile Measurement With
Instantaneous Phase-Shifting Interferometry”, Opt. Eng. 42, 367-372, 2003
7. J.E. Millerd, J.C. Wyant, “Simultaneous Phase-Shifting Fizeau Interferometer”, U.S Patent 7,057,738, 2003
8. 曾垂拱,具平坦度量測的相位移干涉裝置,中華民國專利證書號 I271544,2005
9. W.W. Macy, “Two-Dimensional Fringe-Pattern Analysis,” Applied Optics Vol. 22, No. 23, 3898-3901, 1983.
10. M.A. Sutton, M. Cheng, W.H. Peters, Y.J. Chao, and S.R. McNeil,“Application of an Optimized Digital
Image Correlation Method to Planar Deformation Analysis ”, Image and Computer Vision, Vol.4, pp.143-150,
1986.
國科會補助專題研究計畫成果報告自評表
請就研究內容與原計畫相符程度、達成預期目標情況、研究成果之學術或應用價
值(簡要敘述成果所代表之意義、價值、影響或進一步發展之可能性)
、是否適
合在學術期刊發表或申請專利、主要發現或其他有關價值等,作一綜合評估。
1. 請就研究內容與原計畫相符程度、達成預期目標情況作一綜合評估
■達成目標
說明: 本研究已完成四步偏光相移干涉光路設計、理論推導、影像合併鏡組
之製作、建立數位影像相關法影像對正程式,及瞬時偏光干涉影像擷取系統;完
成試件測試、比較及驗證、探討量測之準確性及適用性,與原計畫內容相符程度
達到 98%。
2. 研究成果在學術期刊發表或申請專利等情形:
論文:■已發表 □未發表之文稿 □撰寫中 □無
專利:□已獲得 □申請中 □無
技轉:□已技轉 ■洽談中 □無
其他:(以 100 字為限)
附件二
3. 請依學術成就、技術創新、社會影響等方面,評估研究成果之學術或應用價
值(簡要敘述成果所代表之意義、價值、影響或進一步發展之可能性)(以
500 字為限)
本研究建立一套瞬時偏光干涉表面形貌量測系統,運用單一 CCD 瞬時同步取
像量測,減除外在環境振動與量測時間過長所造成的影響,將具有應用於線上量
測的能力,亟具實際運用的價值。新的偏光相位移干涉系統,配合數位影像相關
法對正影像位置,可申請專利,並擴展應用於其他的相位移干涉系統,對相關科
技產業製造發展作出貢獻。
行政院國家科學委員會補助研究計畫參與國際學術會議報告
九十九年 九 月九日
報告人姓名
陳元方
服務機構
國立成功大學
機械系
職稱
教授
中文:2010 年國際精密工程與測量儀器會議
會議正式名
稱
英文: 2010 International Symposium on Precision Engineering and
Measurement Instrumentation
會 議 時 間
自 2010 年 8 月 8 日至
2010 年 8 月 11 日
地點(國、州、城市)
中國
杭州
一、
參加會議經過
2010 年國際精密工程與測量儀器(ISPEMI 2010)會議由國際測量與儀器委員會
( ICMI )、中國國家自然科學基金委員會 ( NSFC )、中國計量測試學會 ( CSM )、中
國儀器儀表學會 ( CIS )主辦,SPIE 作為會議協辦單位(Cooperating organization)共同
組織進行,於
2010 年 8 月 8 日至 8 月 11 日在杭州召開。會議共發表近 220 篇論文
及壁報論文,近
200 人參加,參與之成員大半來自地主中國,其他尚有美國、歐州、
日本、韓國等;我國有台大范光照教授、清華林世傑教授,交大彭教授、北科大陳
嘉亮教授、中原大學章明教授及學生、及本人等八位學者專家參與。
這次學術會議的主題集中在精密量測及超精密加工、新儀器及量測系統、光電
系統及測量及光學儀器設計、微機電系統及奈量測,及雷射量測技術及儀器等。研
討會分成下列
23 個次題:
1. Instrumentation Theory and Methodology
2. Accuracy Theory and Uncertainty Analysis
3. Instrument and Measurement System Calibration
4. Sensors, Converters, and Control System
5. Signal Processing and Image Processing
6. Novel Instrument and Measurement System
7. Optoelectronic System and Optical Instruments Design
8. Modern Optics and Instruments for Precision Measurement
9. Measurement for Advanced Optic Machining
10. Measurement for Precision and Ultra-Precision Machining
11. Measurement for Extremely Large Scale Integrated Circuit Manufacturing
12. Measurement for Flat Display and Solar Cell Manufacturingg
13. Measurement during Precision Assembly
14. Multi-axial Precision Position and Movement Technology
15. In-Process, Online, and On-Machine Measurement
16. Precison Manufacturing - Measurement Integration Technology and System
17. Stress and Thermal Measurement and Compensation
18. Vibration Measurement and Isolation Technology
19. Length, Angle and Geometrical Parameter Measurement
20. Multi-axial Coordinate Measurement Technology
21. Laser Measurement Techniques and Instruments
22. MEMS and Nanometer Measurement
23. Quality Engineering Theory and Technology
會議於
8 月 9 日上午開幕後,即進行全天八場的專題演講如下:
1. Measurement in Precision Engineering,Dr. Harald Bosse (PTB, Germany)(德
國,聯邦物理研究院)
2. Surface measurements for large mirrors,Prof. James Burge (University of
Arizona, USA)(美國,亞利桑那大學)
3. Sensors and Measuring Systems for Ultra-Precision Manufacturing,Prof. Wei
Gao (Tohoku University. Japan)(日本,東北大學)
4. Multi-dimensional optical data storage: from the concept to devices,Prof. Min
Gu (Swinburne University of Technology. Australia)(澳大利亞,斯溫伯爾尼
理工大學)
5. Fabrication and Application of Diffractive Optical Elements,Prof. Alexander
Poleshchuk(Institute of Automation and Electrometry SB RAS, Russia)(俄羅
斯,俄羅斯科學院西伯利亞分院)
6. Photonic Meta Materials, Nano-scale plasmonics and Super Lens,Prof. Xiang
Zhang (University of California at Berkeley, USA)(美國,伯克利加州分校)
7. Optical & Confocal Techniques for Dental Hard & Soft Tissue Imaging, Prof.
Tim Watson (King's College London, U.K.)(英國 倫敦國王學院)
8. Technology of Controllable Compliant Tools (CCT) Manufacturing and in situ
measurement for large aperture aspherical mirror,李聖怡 教授 (National
University of Defense Technology, China)(中國,國防科技大學)
會議第二天分成四個場次,同時進行口頭報告及討論,其間並有數十篇的論文
壁報發表;因此游走在各個場次及壁報發表處,聽取論文發表,中間休息的空檔時
間,則和與會的學者專家進行交流。本人的論文"Thin Film Thickness and Refractive
Index Measurement by Multiple Beam Interferometry and Fast Spectral Correlation
Method"亦於今天下午發表,引起幾位與會者的興趣,會後亦與大陸與日本的學者
作一些討論交流,整個會議於下午圓滿結束。晚上參加了大會的晚宴,席間和各國
與會者輕鬆交談建立情誼。第三天參加大會安排的上海周庄行程,在參觀中又增進
了各國與會者彼此間之瞭解。
二、 心得
研討會中,藉由許多報告討論,更新我等在研究上的知識,增加了許多研究的
新想法。專題演講中,Prof. James Burge presented
the Giant Magellan Telescope
achieves 25 meter aperture and modest length using an f/0.7 primary mirror made from
8.4 meter diameter segments. The systems that used for measuring the aspheric optical
surfaces of these mirrorsare in the final phase of development. The development of the
principal test system - a system that uses mirrors and holograms to provide a null
interferometric test of the surface. This system provides a full aperture interferometric
measurement of the off-axis segments by compensating the 14.5 mm aspheric departure
with a tilted 3.8-m diameter powered mirror, a 77 cm tilted mirror, and a computer
generated hologram. 其中的量測方法頗具巧思,可以作為我等在發展大物件量測及
軟板科技時之參考。
The three main dental diseases of caries, tooth wear and periodontal disease are all
capable of meaningful diagnosis and measurement using biophotonics based solutions.
Prof. Tim Watson presented the advantage of these techniques which avoid many aspects
of specimen preparation that lead to significant artifact such as dehydration or thin
section preparation for electron microscopy. The confocal microscopy for imaging the
oral structures using a variety of systems offers high resolution / contrast imaging;
Confocal fluorescence techniques can be applied to measure the autofluorescence of
decayed dental tissues or the interfacial penetration of adhesives; The application of
Raman, multi-photon and FLIM imaging has further refined these techniques. For
clinical imaging, endoscopic delivery is required and this has been applied to confocal
reflection and fluorescence techniques intra-orally.這些方法及應用和我目前研究團隊
進行的牙齒材料及醫療技術有些相似之處,值得作為研發之參考。
在發表的論文之中有下列兩篇值得參考:
A. Polarization Phase-shifting Interference Microscopy for Ultra-precision Surface
Topography, by W. Cheng, X.Chen, L. Zhou*, X. Liu, China
In this paper, polarization phase-shifting interference microscopy is proposed for
ultra-precision surface topography measurement. A system based on the principle is
constructed, and series of experimental testing are conducted on the system. The
results show that the measurement accuracy is better than 1.5nm, and is verified. 此
等發展提高了
Polarization Phase-shifting Interference 的應用性。
B. Independent Distortion Correction Algorithm for Machine Vision Systems, by Tang
Wei, Ye Dong, China.
In this paper, an independent distortion correction algorithm based on equidistance
is proposed. Two different procedures of distortion correction and parameter
calibration are isolated. Distortion correction is realized to provide the basis for linear
calibration to improve calibration accuracy. The imaging center point (principal point)
is the position with the smallest distortion amount in the reference table. The
experimental results demonstrate that the independent algorithm could effectively
correct lens distortion and it has benefit for improving the calibration accuracy of
machine vision systems.其中的一些方法可以作為發展 vision-based 量測之參考。
三、 其他
感謝國科會計畫
NSC98-2221-E-006-042 提供與會經費,始能順利成行。
四、 建議事項
光學量測系統在微奈米、生醫等高科技中之運用日益增重,建議可整合建立相
關光測系統研發中心,因應科技發展之趨勢,發展先進及實用性高的量測系統,以
建立領先的地位,促進國內高科技工業發展。
五、 攜回資料名稱及內容
詳細議程資料
(ID 22-785)
Thin Film Thickness and Refractive Index Measurement by Multiple Beam
Interferometry and Fast Spectral Correlation Method
Terry Yuan-Fang Chen*, Chien-Chih Chen
Department of Mechanical Engineering, National Cheng-Kung University
Tainan, Taiwan 701
ABSTRACT
The establishment and use of precision measurement technology and system become an important part to understand and to effectively control the materials, structures or installations in nano-scale. In this paper, a system based on the multiple beam interferometry, multi-matrix method and fast spectral correlation method is developed to measure the thickness and refractive index of thin film. Primary study to analyze the FECO images obtained from symmetrical three-layer (mica-air-mica) with film thickness over 200nm and non-symmetrical interference (mica- air- LDPE-mica) was made. The results show that the fast spectral correlation formula can be applied to both symmetric and non-symmetric three-layer interference, and the film thickness measurement is applicable to over 200nm.
Keywords: Fast spectral correlation method, Multiple beam interferometry, Fringe of equal chromatic order, Thin film, refractive
index, Multilayer matrix method.
INTRODUCTION
Nano-technology is the greatest driving force in technology and industrial development at 21st century. In nano-scale, physical and mechanical properties of materials will show a significantly different characteristics and phenomena. The establishment and use of precision measurement technology and system become an important part to understand and to effectively control the materials, structures or installations in nano-scale.
In the present, there are several optical techniques can be used to measure film thickness and refractive index, such as ellipsometer, optical interferometry and so on. Among them, multi-beam interferometry not only can be used to measure micro-nano-optical film thickness and refractive index [1], but also has further become a central body of the surface force apparatus (S.F.A.) [2]. For example, the S.F.A. can be applied to measure film thickness and shape at point contact in lubrication study [3]. A measurement system [4] to determine the thickness and refractive index of thin film was developed based on the multiple beam interferometry, using the symmetric three-layer formula from Israelachvili [5]. However, the thickness determined by the designed software is limited to about 200nm and is not suitable to non-symmetric case. In this paper, a software program based on fast spectral correlation method is developed to analyze the fringe of equal chromatic order (FECO) images from multiple beam interferometry. Primary study to analyze the FECO images obtained from both symmetrical three-layer (mica-air-mica) and non-symmetrical
interference (mica- air- LDPE-mica) with film thickness measurement over 200nm was made. Theoretical background is introduced and test results are shown and discussed.
METHOD AND THEORY
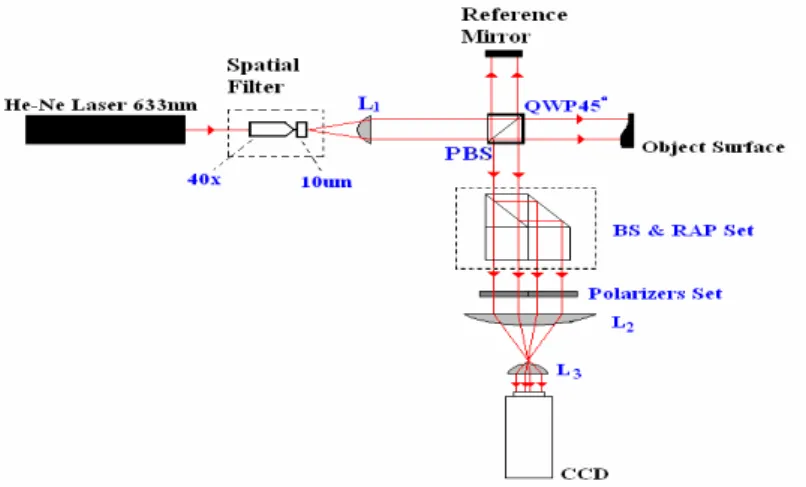
Multiple beam interferometry
A schematic setup of multiple beam interferometry system is shown in Fig. 1. The white light source inject into the two cylindrical mica sheets perpendicularly. Two thin cylindrical axis of the mica are orthogonal, and each piece of mica should be coated with a layer of silver film. When the light has interference in the two highly reflective silver films by multi-reflection, the wavelength of transmitted light is related to the thickness and the refractive index of the material. After the light passes through two mica sheets, it injects into the slit by a right-angle mirror and sampled by a
) 2 cos( ) 2 sin( ) 2 sin( ) 2 cos( j j j j j j j j j j j T n T n in T n n i T n M
j jM
M
Figure. 1 Multiple beam interferometry Figure. 2 Typical FECO image
spectrometer. In the spectrograph, one can see the bright fringes which are called the fringe of equal chromatic order (FECO) as shown in Fig. 2. The vertical pixel in FECO image corresponds to the actual location of the lateral position of the mica sheets. As the mercury light passing through spectrometry, its spectral lines have a fixed wavelength and can be used to correct the horizontal direction out of FECO images of the relationship between pixel location and wavelength. The film thickness and the refractive index can be obtained by analyzing the FECO images.
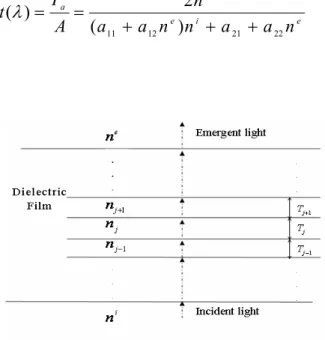
Multi-layer matrix method
The light intensity of FECO image shown in Fig. 2 is related to the wavelength of light pass through [6]. Consider a white light passing through the dielectric material as shown in Fig. 3, the light has a vertical incidence to the dielectric multilayer stack of thin film materials from the medium with a index of ni and the final beam injects out to the medium with the index
n
e Tjand nj are the film thickness and refractive index respectively for the first j layers of dielectric materials (or optical coefficient), where j = 1, 2, 3 . A particular solution about waves passing through the dielectric film materials of electric and magnetic fields can be solved by Maxwell equation as:(1)
Where Mj is the characteristic matrix of the jth layer, and λ is the optical wavelength. When the multi-layer dielectric films stack, its characteristic matrix can be expressed as:
(2)
Suppose A is the amplitude of light before infecting into multi-layer dielectric films, Ta is the amplitude of light after penetrating. Let 22 21 12 11 a a a a M
e i e i a
n
a
a
n
n
a
a
n
A
T
t
22 21 12 11)
(
2
)
(
2 2 4 4 E cn E c S 2 2 2 0 ) ( ) ( ) ( ) ( t n n A T n n I I i e a i e )
(
)
(
)
(
I
0
I
matrix
(3)Figure 3 Light passing through the multi-layer dielectric thin film material
For non-magnetic material, the permeability μ are nearly equal to 1. The plane wave intensity of S is expressed as:
(4)
where c is the speed of light, ε is the dielectric constant, n is the material refractive index, and E is the electric field amplitude. By equation (3) and (4), a transmittance function change with wavelength is obtained as
(5)
where I0() and I(
) correspond to the incident wavelength λ before and after the light intensity through multi-layer, respectively. Knowing the thickness and refractive index of each layer, and the optical wavelength λ, the relationship between transmission rate and the intensity can be calculated by equation (3), (4) and (5). The light intensity transmittance multiplied by the incident light intensity represents the light intensity after penetration. Although the incident light intensity changes with the wavelength λ, it is only equivalent to a scale factor, and will not change the brightest spot position. Therefore, the transmitted light intensity Imatrix() calculated by multi-layer matrix method could be expressed as follow:
M j matrix j I n T 1 ) ( ) , (
Assuming that there is only one unknown layer in a multi-layer film and the other layers are known, the thickness T and the refractive index n can be determined from the wavelength corresponding to FECO images using multi-layer matrix method.
Fast spectral correlation method
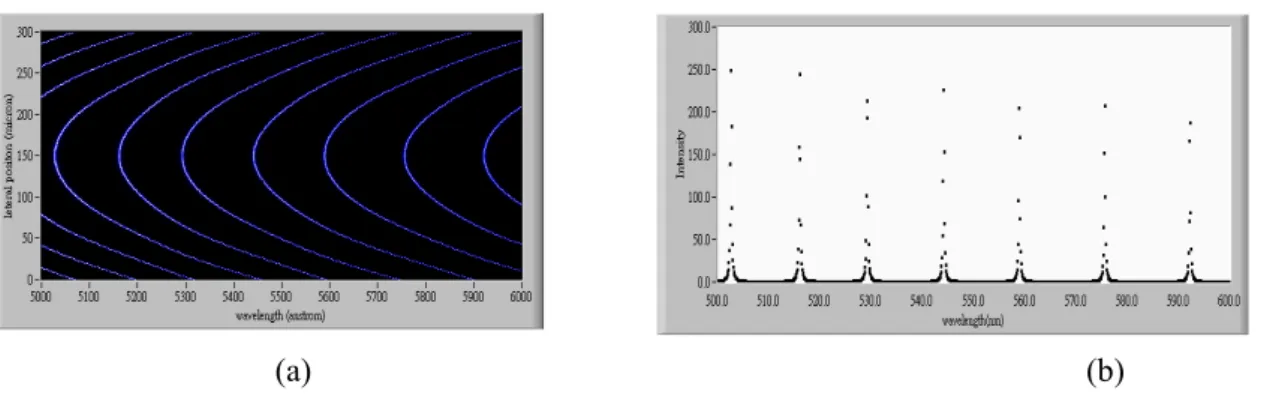
As described in previous section, multi-layer matrix method can be used to simulate the light intensity value corresponding to each wavelength of light in the FECO image. Therefore, use of mercury spectra to obtain the horizontal resolution of the FECO images (nm/pixel) to obtain the relationship between intensity and wavelength is needed to determine the thickness and refractive index of the multi-layer. However, use of the whole light intensity and wavelength of the image data would make calculation process too complex and time-consuming. Hence, a fast spectral correlation method [7] that uses fewer data points is adopted to determine the thickness and refractive index of one level in a multi-layer film. Figure 4(a) shows a simulated FECO image in analog band of 500nm ~ 600nm. The intensity distribution along a horizontal line across the image in Fig. 4(a) can be given as shown in Fig. 4(b). It can be observed that the intensity is very high at and very close to the position of maximum intensity, and is very weak at other positions.
If the thickness and refractive index of one layer only are unknown in a multi-layer film, the penetrating light intensity, Φ, can be calculate by multi-layer matrix method as a function of wavelength λ and the thickness T. defined as:
(7)
where M is the number of detected fringes, j is the first j wavelength detected. Since the best set of (T, n) yields the highest intensity of Φ. Therefore, by assuming the possible range of T and n, respectively, the unknown film thickness and refractive index
n that corresponds to a maximum value can be determined through a search process. In experiment, FECO image has 640-pixel
points in the horizontal direction but only a few fringes are in the visible band. Thus, this method greatly reduces the computational complexity.
(a) (b)
Figure 4. FECO image light intensity and wavelength diagram: (a) analog band at 500nm ~ 600nm of FECO image; (b) intensity distribution along a horizontal line across the center of (a).
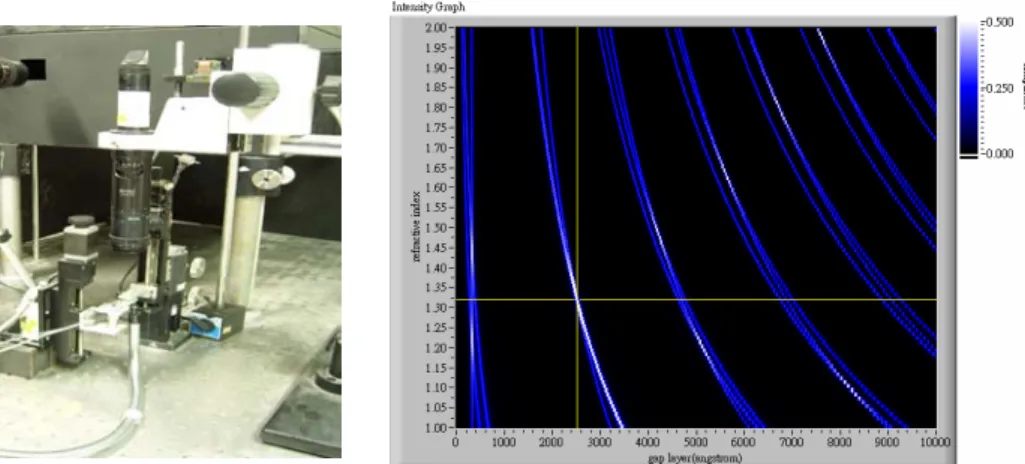
SYSTEM CONFIGURATION AND EXPERIMENTS
The multi-beam interference experimental system constructed is shown in Fig. 5. The system contains a white light source, a multi-beam interference system based on two mica sheets, a spectrometer to generate spectrograph and a PC-based image processing systems. The multi-beam interference system consists of the structure ontology, motorized translation stage and piezoelectric translators for coarse and fine movement of mica sheet, two silica Lens with mica sheet adhered on the surface. For extended range of measurement, two mica sheets was placed in two lens holder and form a symmetric three-layer interference (mica-air layer under test-mica). the FECO images obtained from symmetrical three-layer (mica-air-mica) with film thickness over 200nm and For non-symmetrical interference (mica-air-LDPE-mica) measurement, a layer of mica sheet was coated with a low-density polyethylene (LDPE) film having a refractive index of about 1.51.
The white light passing through an optical access and is launched into the multi-beam interference system. The light emerging from the multi-beam interference system is guided into a spectrometer and the produced FECO fringes were grabbed by the image processing system to determine the unknown film thickness and refractive index. Firstly, the FECO was calibrated to obtain the relation of horizontal pixel location and the wavelength of light by mercury light. Then the peak location of bright fringes was determined with the corresponding wavelength. Finally, the correlation function was calculated for all possible values of thickness and refractive index. Fig. 6 shows a typical correlation function map. The refractive index and thickness corresponds to the largest value shown in Fig. 6 was chosen as the correct values..
Figure 5 Experimental setup. Figure 6 Fast spectral correlation map
EXPERIMENTAL RESULTS AND DISCUSSION
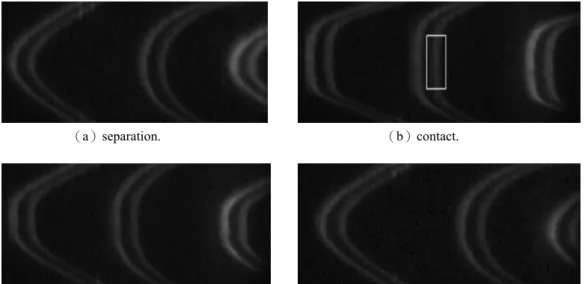
Figure 7 shows the FECO images obtained from the symmetric three-layer interference experiment with the two mica sheets separated and at contact, respectively. It can be found in Fig. 7(b) that when two mica contact (ie, air film thickness is 0), the FECO image has a noticeable distortion as a result of the deformation of two mica sheets. The phenomenon of the deformation is indicated by the striped box. Since there’s no way to know the deformation of the two micas at contact, it is necessary to observe the apparent movement of FECO fringe during the separation of the two mica sheet to insure they are really separated. Fig. 7(c) shows the FECO fringes after being separated by 2 m. Several extended separation measurements are listed in Table 1. It can be seen that the increase of the thickness agrees with the movement of the pizeo-translator. The measured air film thickness was extended to
636.4nm. Comparing the measured air film thickness and the movement of pizeo-translator, a difference of less than 10% was found.
(a)separation. (b)contact.
(c) FECO image of (b) after 2um sepration (d)air film thickness of 636.4nm
Figure 7 Symmetric three-layer experimental FECO images
Table 1 Symmetric interference measurement. Table 2 Non-symmetric interference measurement
Figure 8 shows the FECO image of the non-symmetric multi-layer interference. Since there is no obvious distortion in image at initial contact, judgment of contact or separation of two mica sheets must depend on the change of fringe’s wavelength position as described in the symmetric three-layer interference case. The non-symmetric interference measurements are listed in Table 2. Fig. 8(a) shows the image with piezo's position at 13.4 m and the air film thickness measured is 150.9 nm, and Fig. 8(b) with piezo' s position at 13m and the measured air film thickness is 625.9 nm. The difference between the measured air film thickness and the movement of pizeo-translator is about 10~20%.
(a)Measured air film thickness of 150.9nm (b)Measured air film thickness of 625.9nm Fig. 8 FECO images of two different separation distances between mica and LDPE.
CONCLUSION
A program based on fast spectral correlation method to analyze the fringe of equal chromatic order (FECO) in multi-beam interferometry is studied. Using the FECO images from self-made symmetrical three-layer (mica-air-mica) and non-symmetrical interference (mica- air- LDPE-mica), the measurement results reveal that fast spectral correlation method can be applied to both symmetric and non-symmetric multi-layer interference, and the film thickness measurement capability can be extended to over 200 nm. Fairly good measurement on the refractive index and film thickness is achieved. Since this experiment was carried out under the general environment, the error might be caused by dust in the air, environmental vibration and various unpredictable factors.
ACKNOWLEDGEMENTS
This work is supported by National Science Council, Taiwan, Republic of China under the contract no. NSC95-2221-E-006-037-MY2.
REFERENCES
[1] Tolanlnsky, S., Multiple-Beam Interferometry of Surfaces and Films, Oxford Univ. Press, London, (1949).
[2] Israelachvili, J. N. and Adams, G. E., “Measurement of forces between two mica surfaces in aqueous potassium nitrate solutions”, J. Chem. Soc. Faraday Trans I, 74, 975 (1978).
[3] Becker, T. and Mugele, F., “Molecular Thin Lubricant Layers under Confinement”, Molecular Simulation, v 31, n6-7, p 489-494, May 15 (2005).
[4] Chen, T.Y., Lin, Y.J., Hu, S.G., Yang, S.L. and Chung, J.C., ” Thin Film Thickness and Refractive Index Measurement by Multiple Beam Interferometry,” Proc. International Conference on Experimental Mechanics, Singapore (2009).
[5] Israelachvili, J. N., “Thin Film Studies Using Multiple- Beam Interferometry”, Colloid Interface Sci., 44, pp.259-271 (1973).
[6] Born, M. and Wolf, E., Principles of Optics:Electromagnetic Theory of Propagation, Interference and Diffraction of Light, 6th ed., Pergamon, Oxford, (1980).
[7] Heuberger, M., “The extended surface forces apparatus. Part I. Fast Spectral Correlation Interferometry”, Rev. Sic. Instruments, Vol.72, No.3, pp.1700-1707 (2000).