國立臺灣大學理學院大氣科學系 碩士論文
Department of Atmospheric Sciences College of Science
National Taiwan University Master Thesis
以系統追蹤分析探討雲凝結核對於臺灣複雜地形夏季 日夜降雨之影響
Tracking the Influence of Cloud Condensation Nuclei on Summer Diurnal Precipitating Systems over Complex
Topography in Taiwan
張宇泓 Yu-Hung Chang
指導教授:陳維婷 博士 Advisor: Wei-Ting Chen, Ph.D.
中華民國 109 年 7 月
謝辭
俗語話講:「西北雨,落袂過田岸」,就是按呢來去無影蹤ê 特色,欲研究台
灣ê 西北雨特別硬篤。囡仔歌「西北雨,直直落」佇半世紀以前予人創作出來,
佇這段時間,人為活動予島嶼ê 空氣變無仝款--ah。西北雨敢會因為空氣變垃圾,
就按呢嘛變無仝款?
讀碩士這兩冬,愛感謝ê 人有夠濟。我上蓋感激 ê 是陳維婷老師,伊佇討論
過程中間對我ê 耐心、鼓勵 kah 包容,是我佇面對難關 ê 時陣,上有力 ê 正能量。
雖然行入去辦公室ê 時陣定定有足濟疑問,毋過若聽著老師講「你是頭一个用這
款方式看這个問題 ê 人」,我對研究就閣再有信心。感謝吳健銘老師、陳正平老
師、蘇世顥老師、Christopher Moseley 博士擔任我 ê 口試委員,而且提供寶貴 ê
意見kah 建議,予這篇論文閣較完整。
足感謝皮皮學長對我ê 照顧,佇這兩冬來不時 kā 我鼓勵、hām 我開講,予定
定煩惱東煩惱西ê 我,會當安定。感謝俊彥學長、柏言學長、旻耕學長,提供我
資料分析kah 模式設定 ê 想法,減少研究過程中 ê 困難。感謝 B03 同學 kā 我相
伨,kah 鏡惟、佳棟做伙食飯、練痟話,金德佇程式方面 ê 支援,猶有 kah 鎔與、
亭羽分享研究kah 生活。感謝睦庭、小白、承晏,雖然這馬逐家 leh 做 ê 代誌攏
無仝,恁抑是會佇我面對挑戰ê 時陣予我鼓勵。感謝大氣系壘球隊 ê 隊友,三寶、
吉哥、祐軒、銘豪、俊杰、軒齊,陪我度過拜六早仔佇紅塗kah 草地頂懸 ê 快樂
時光。
多謝厝內ê 支持,予我會當選擇家己佮意 ê 科系;猶有恁一直對我 ê 關心,
是維持我心靈ê 力量。我欲 kā 這篇論文獻予我 ê 阿公阿媽,若是無恁佇天頂 kā
我看顧,這篇論文就無法度完成。
最後,感謝台灣這座美麗島,因為你迷人ê 地理景觀,才有這个獨一無二 ê
研究題目。
摘要
由於與日俱增的人為活動,氣膠作為雲凝結核對於雲及降水的影響成為近年 來受重視的研究議題。前人研究指出,氣膠、雲、降水交互作用的結果取決於環 境型態。在本研究中,我們將環境型態聚焦於綜觀天氣影響較弱時、臺灣複雜地 形之上的日夜降水系統。為了解析細微尺度的大氣物理過程,我們利用具有高解 析度臺灣地形的渦度向量方程雲解析模式(TaiwanVVM)進行半真實大渦流模擬。
我們從弱西南風或弱綜觀的天氣型態當中選取 13 個個案,並以其簡化之觀測探
空資料作為模擬的初始條件。在控制組(乾淨環境)中,氣膠數量混合比為每公斤
3×10⁸;而在實驗組(一般環境)中,氣膠數量混合比增加至每公斤 3×10¹⁰。13 個
個案的合成降水模擬結果顯示,阿里山山脈區域是臺灣島上最顯著的降水熱點,
此現象與前人的觀測分析相符。我們以阿里山山脈的區域平均降水率時序變化,
分辨出兩種不同的降水型態:強降水型及弱降水型;並利用「雲物件連結」及「降 水系統追蹤」方法,從對流發展生命期的觀點,檢驗雲、雨特性。對於強降水型 而言,雲凝結核濃度上升的影響更為顯著:有能力製造強降水的系統出現頻率提 高,且其對總降雨量的貢獻增加;降水系統開始與結束的時間延後;降水系統成 熟期的降雨率、降雨面積、雲厚、雲體積皆增加,並伴隨更集中且更強的雲內上 升區。因此,雲凝結核濃度增加會讓複雜地形之上的夏季日夜降水系統出現「強 者愈強」的反應。進一步討論兩種降水型態的差異與局部環流的關係,發現強降 水型在降雨發生前有較弱的近岸底層風場。本研究呈現,半真實大渦流模擬及系 統追蹤分析,對於瞭解雲凝結核濃度如何影響複雜地形之上的日夜降水,足以提 供實用而嶄新的分析觀點。
關鍵字:
氣膠數量濃度、複雜地形、日夜降水系統、局部環流、半真實大渦流模擬、系統 追蹤分析
Abstract
The influence of aerosols, serving as cloud condensation nuclei (CCN), on clouds and precipitation becomes a highlighted research topic in recent years due to increasing human activities. Previous studies have suggested that the results of aerosol-cloud- precipitation interaction are regime-dependent. In this study, the regime of interest is focused on the diurnal precipitation over complex topography in Taiwan with weak synoptic-scale weather forcing. Semi-realistic large-eddy simulations (LESs) were carried out using the vector vorticity equation model with high-resolution Taiwan topography (TaiwanVVM) to resolve fine-scale atmospheric processes. The simulations of 13 cases were driven by the simplified observational soundings, selected under weak southwesterly flow or weak synoptic weather events. In the control groups (clean scenarios), the aerosol concentration was fixed at 3×10⁸ kg-1 in the entire domain, while in the experimental groups (normal scenarios), the value was 100 times higher.
The composite of the simulated results reveals a precipitation hotspot around Alishan Mountain Range (AMR), which is consistent with the observed climatology. Two
different types of precipitation patterns by the AMR regional-averaged rain rate
evolution are identified: the STRONG type and the WEAK type. By performing cloud object connecting and rain cell tracking analyses, the properties of cloud and precipitation are examined from the perspective of the life cycle of convection. Several
responses due to increasing CCN are highlighted especially for the STRONG type. First, the diurnal precipitating systems with a greater ability to produce heavy rain rates occur more frequently and contribute more to the total precipitation. Also, the initiation and
the ending time of the diurnal precipitating systems are delayed. Moreover, the
maximum rain rate, rain area, cloud depth, and cloud size become stronger with a more concentrated and vigorous updraft in the clouds during the mature stage of the diurnal
precipitating systems. An overall “strong get stronger” response to the diurnal precipitating systems over complex topography is identified with increasing CCN. The relationship between the intensity of local circulation and the precipitation patterns in the AMR region is discussed, with the STRONG type having weaker near-coast low- level southwesterly before the initiation of precipitation. This research shows that semi- realistic LES and tracking of precipitating systems provide novel and useful insights to the understanding of the responses to diurnal precipitation resulting from increasing CCN under relatively weak synoptic weather regime over complex topography.
Key Words:
aerosol number concentration, complex topography, diurnal precipitating systems, local circulation, semi-realistic large-eddy simulation, object-based tracking analyses
目錄 Contents
謝辭... i
摘要... ii
Abstract ... iii
目錄 Contents ... v
Figure Captions ... vi
Table Captions ... xi
1. Introduction ... 1
2. Model Description and Semi-Realistic Experiment Setup ... 6
2.1. Model Description and General Setup ... 6
2.2. Experiment Design of Semi-Realistic Simulations ... 7
3. Simulation Results ... 10
3.1. Overall Results ... 11
3.2. Object-based Tracking Analyses ... 12
4. Summary and Discussion ... 19
References ... 24
Figures... 29
Tables ... 47
Appendices ... 49
Appendix A. Predicted Particle Property Microphysics Scheme ... 49
Appendix B. Case Selection for Semi-Realistic Simulations ... 50
Appendix C. Six-Connected Segmentation Method ... 52
Appendix D. Iterative Rain Cell Tracking ... 54
Appendix E. Co-Locate Rain Cells with Cloud Objects ... 55
Figure Captions
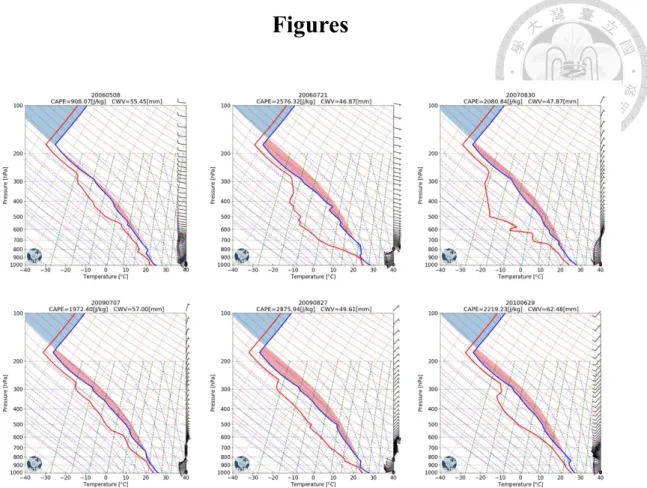
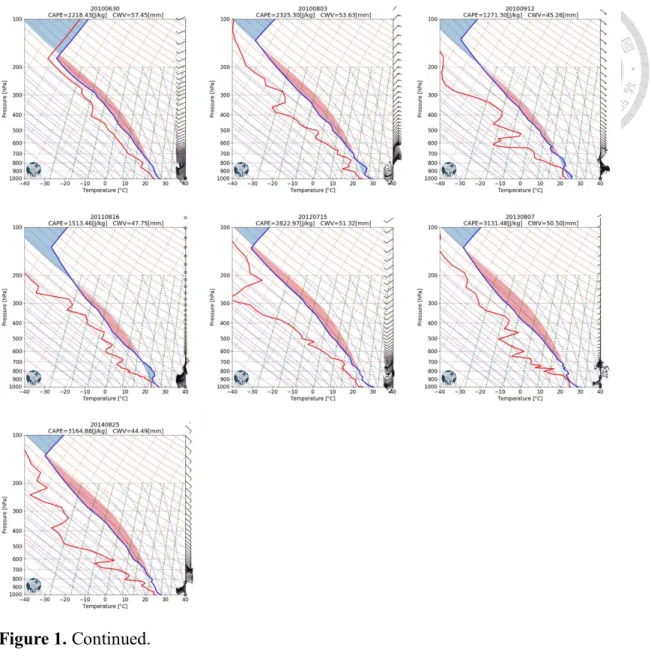
Figure 1. Vertical profiles of the initial environmental conditions presented by Skew-T log-P diagrams. These profiles are adapted from the observational soundings of Central Weather Bureau Banqiao Station (World Meteorological Organization station number 46692) at 08:00 Taiwan Standard Time. The blue and the red lines represent temperature and dew point temperature, respectively. The red and blue translucent shading areas represent the positive areas and the negative areas, respectively. High convective available potential energy (greater than 900 J·kg-1), high column water vapor (greater than 44 mm), and low-level southwesterly are common features shown in these profiles.
Figure 2. The domain of TaiwanVVM and its terrain height. The center of the domain is set around Mount Jade, the highest mountain on Taiwan Island.
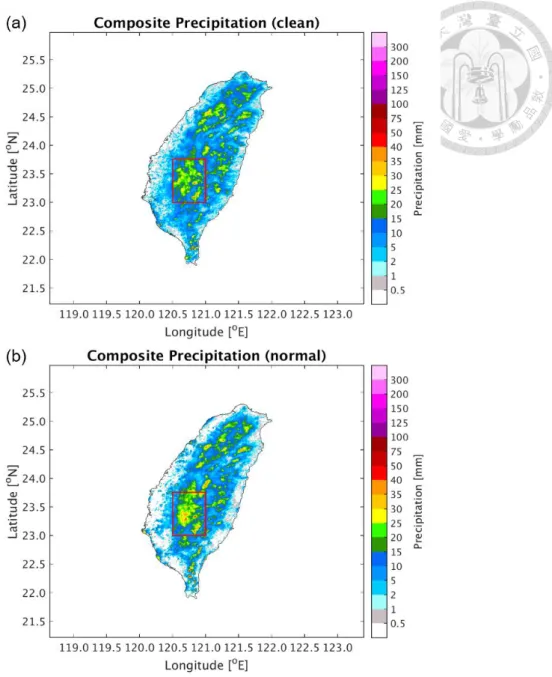
Figure 3. The composite precipitation of all 13 cases under (a) the clean scenario and (b) the normal scenario on Taiwan Island. The red box represents the Alishan Mountain Range region, which is the most significant precipitation hotspot and the region where this research is focusing.
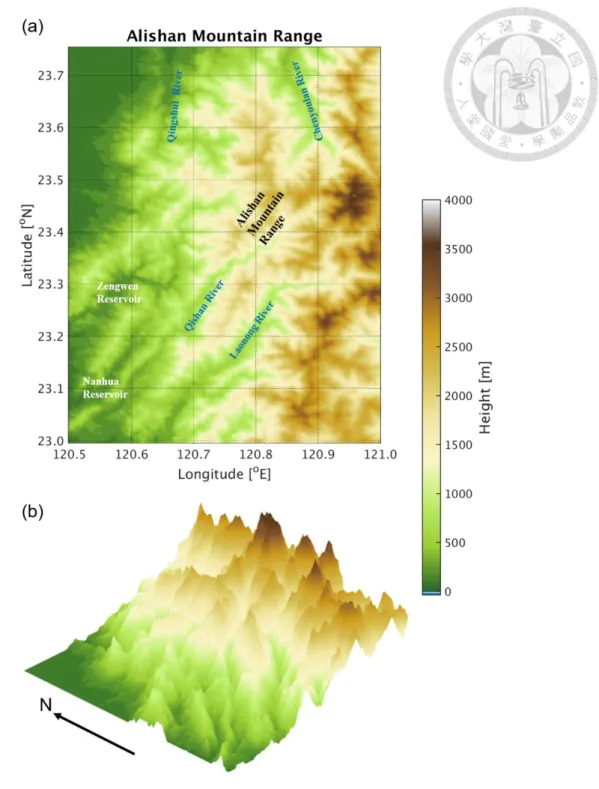
Figure 4. (a) The topographic map and (b) the three-dimensional terrain of the Alishan Mountain Range region. Several major drainage systems in Taiwan are located in this region, including the Chenyoulan River, the Qingshui River, the Qishan River, and the Laonong River. The Zengwen Reservoir and the Nanhua Reservoir, the main reservoirs that support the water consumption of southern Taiwan, are situated in this region as well.
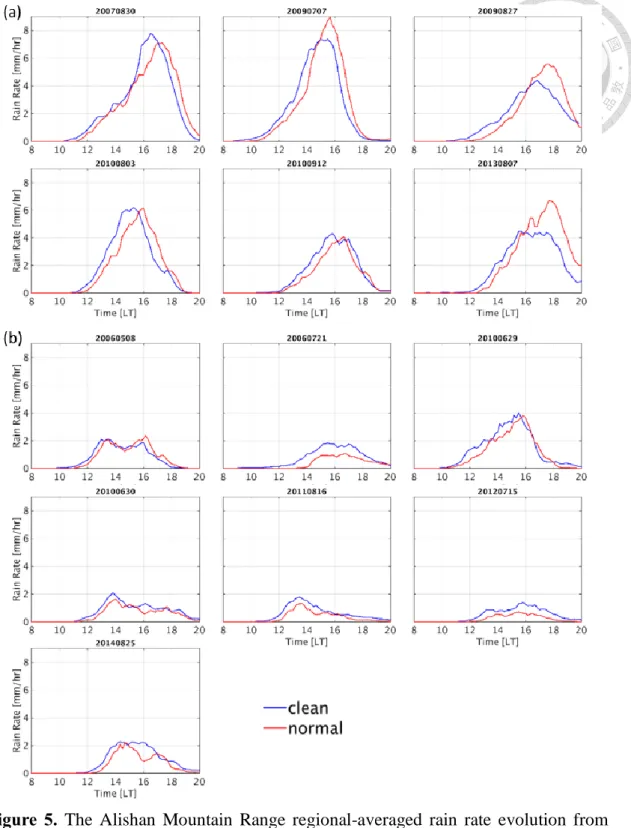
Figure 5. The Alishan Mountain Range regional-averaged rain rate evolution from 08:00 to 20:00 for (a) the STRONG type (6 cases) and (b) the WEAK type (7 cases).
The blue and the red lines represent the clean and the normal scenarios, respectively.
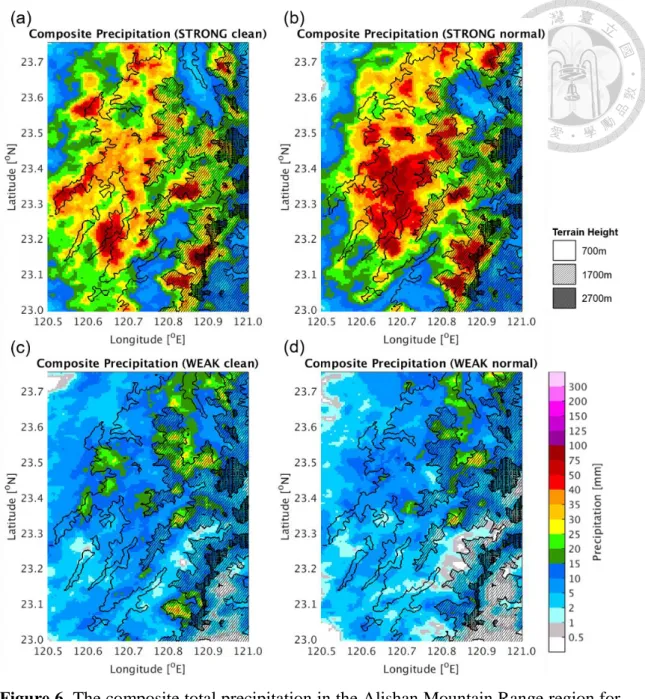
Figure 6. The composite total precipitation in the Alishan Mountain Range region for (a) STRONG/clean, (b) STRONG/normal, (c) WEAK/clean, and (d) WEAK/normal situations. The terrain height is presented by the hatching.
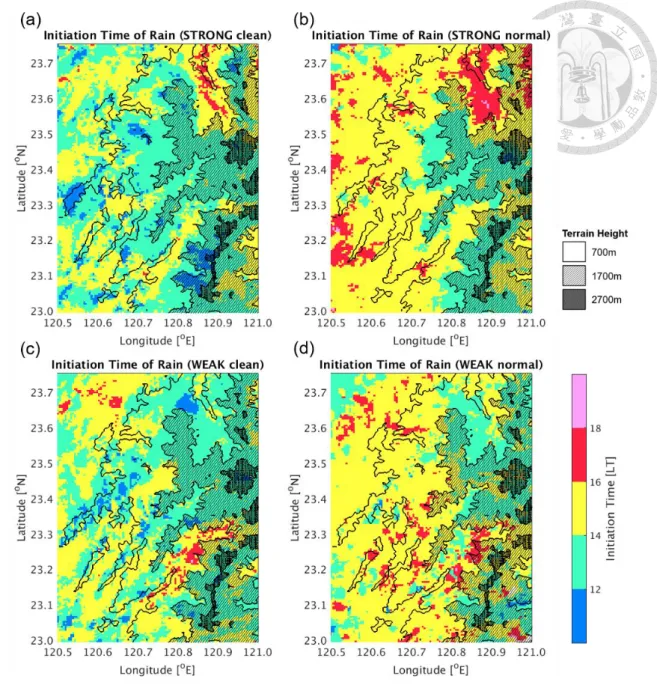
Figure 7. The composite initiation time of precipitation in the Alishan Mountain Range region for (a) STRONG/clean, (b) STRONG/normal, (c) WEAK/clean, and (d) WEAK/normal situations. The terrain height is presented by the hatching.
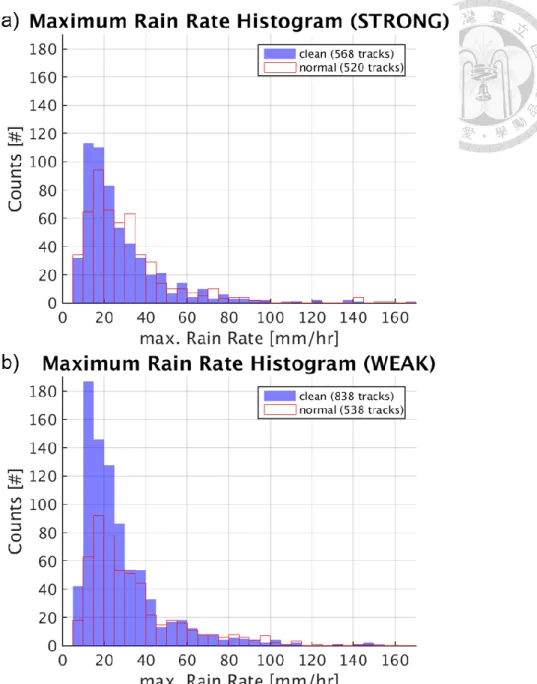
Figure 8. The number of the rain tracks by different maximum rain rate during their lifetime for (a) the STRONG type and (b) the WEAK type. The blue translucent bars and the red-edge hollow bars represent the clean and the normal scenarios, respectively.
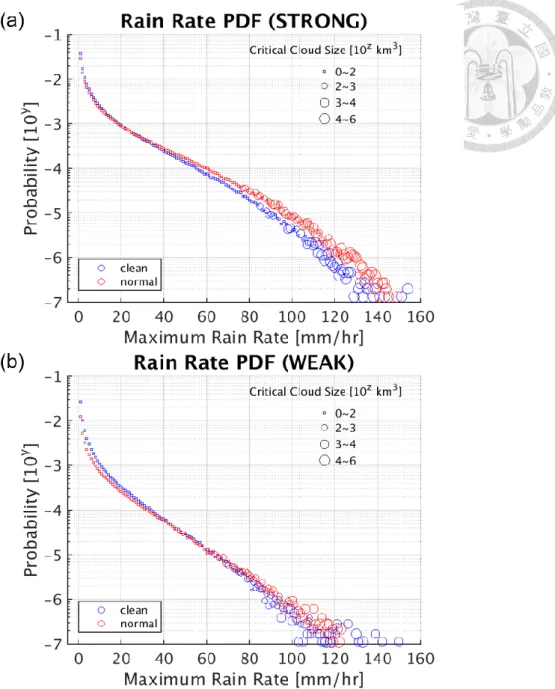
Figure 9. The probability density functions of the clouds with various maximum rain rates for (a) the STRONG type and (b) the WEAK type, along with the critical cloud size. The critical cloud size is defined as the minimum cloud size that can produce the corresponding rain rate, presented by the size of the hollow dots. The blue and the red dots represent the clean and the normal scenarios, respectively.
Figure 10. The rainfall contribution of the clouds with different maximum rain rates for (a) the STRONG type and (b) the WEAK type, presented by the cumulative density functions. The blue and the red lines represent the clean and the normal scenarios,
Figure 11. The box-whisker plots of (a) the initiation time, (b) the ending time, and (c) the duration of the rain tracks. The red and the blue boxes represent the clean and the normal scenarios, respectively. The upper edge, the middle line, and the lower edge of a box represent the 3rd quartile, the median, and the 1st quartile, respectively. The dot represents the mean. The upper and the lower tip of a whisker represents the maximum and the minimum value. The significance of the difference of the means is shown by the asterisks: ** indicates a p-value smaller than 0.01, while * indicates a p-value smaller than 0.05.
Figure 12. The box-whisker plots of (a) the maximum rain rate and (b) the maximum rain area (shown by effective radius r = √𝐴 𝜋⁄ ) during the lifetime of the rain tracks.
The blue and the red boxes represent the clean and the normal scenarios, respectively.
The upper edge, the middle line, and the lower edge of a box represent the 3rd quartile, the median, and the 1st quartile, respectively. The dot represents the mean. The upper and the lower tip of a whisker represent the 99th percentile and the 1st percentile, respectively. The significance of the difference of the means is shown by the asterisks:
** indicates a p-value smaller than 0.01, while * indicates a p-value smaller than 0.05.
Figure 13. The box-whisker plots of (a) the maximum cloud depth and (b) the maximum cloud size (shown by effective radius r = √3𝑉 4𝜋3 ⁄ ) during the lifetime of the rain tracks. The details are the same as Figure 12.
Figure 14. The box-whisker plots of (a) the maximum in-cloud vertical velocity and (b) the maximum core ratio during the lifetime of the rain tracks. The core ratio is defined as the proportion of the clouds with a vertical velocity greater than 0.5 m·s-1,
Figure 15. The schematic diagram of the influence of cloud condensation nuclei on the diurnal precipitating systems over complex topography. The life cycle is shown by the left-to-right sub-figures, representing the growing stage, the mature stage, and the dissipation of the diurnal precipitating systems. For the STRONG type, the diurnal precipitating systems initiate over the mountain ridges and then occupy the whole mountain area during their development. However, for the WEAK type, the initiation of the diurnal precipitating systems has less relationship with the terrain. The middle sub-figures further illustrate the features of the diurnal precipitating systems. The number of the slant dashed lines per each cloud represents the rain rate, while the total number of the slant dashed lines shows the rain area. The figures also visually present the size and depth of the clouds. The length of the black arrows in the clouds indicates the strength of the in-cloud vertical velocity, while the number of them displays the size of the updraft region. The length of the purple translucent arrows in the left sub-figure shows the strength of near-coast low-level southwesterly one hour before the initiation of precipitation in the mountains.
Figure 16. (a) The topographic map of southern Taiwan. The red box represents the Alishan Mountain Range region, and the blue box represents the southwest-northeast area along the Qishan River Valley and the Laonong River Valley.
The local circulation one hour before the initiation of precipitation in the mountain part of the blue box in Figure 16a under the clean scenario (b) on July 7th, 2009 (a case belonged to the STRONG type) and (c) on July 21st, 2006 (a case belonged to the WEAK type). The arrows are composited by the vertical velocity and the southwesterly.
Figure 17. The local circulation 10 minutes before the initiation of precipitation in the mountain part of the blue box in Figure 16a on July 7th, 2009 (a case belonged to the STRONG type) under (a) the clean scenario and (b) the normal scenario. The arrows are composited by the vertical velocity and the southwesterly.
Table Captions
Table 1. The configuration of TaiwanVVM for the semi-realistic simulations.
Table 2. The initiation time of precipitation in the mountain part of the blue box in Figure 16a, the average southwesterly below 1500 m in the coastal part of the blue box one hour before the initiation of precipitation in the mountain part of the blue box, and the average southwesterly of the initial sounding below 1500 m under the clean scenario.
On September 12th, 2010, the average flow of the initial sounding below 1500 m was northeasterly, but southwesterly existed in the lowest levels.
1. Introduction
For the past few decades, researchers have focused on how aerosols influence clouds and precipitation, namely the aerosol-cloud-precipitation interaction (ACPI).
Excessive aerosols, released to the atmosphere by continuing human activities, could modify the characteristics of clouds and precipitation after being activated as cloud condensation nuclei (CCN). Clouds developed under the environment with more CCN could have more cloud droplets but smaller sizes, leading to a narrower drop size distribution (DSD). Small droplet sizes and a narrow DSD could result in less collision- coalescence efficiency and thus suppress the warm rain processes. However, in deep convection, mixed-phase microphysics processes come into play, and more complicated mechanisms that could affect precipitation are included (Tao et al., 2012).
How aerosols influence deep convection, which has a higher ability to produce heavy precipitation and a greater probability of causing hazards, is particularly the main target of research.
As listed in Tao et al. (2012), numerous studies using cloud-resolving model (CRM) simulations were conducted for the sake of testing the convective precipitation sensitivity to increasing aerosols. Cases of squall lines, mesoscale convective systems, cold fronts, sea breeze-induced cumulus, and the other forms of convection were included. Due to the high variety of meteorological conditions and weather systems,
the results showed no consistent agreement among these simulations (Fan et al., 2016).
Since both meteorology and aerosols could influence the development of clouds and precipitation, Stevens and Feingold (2009) stated that the aerosol effects on clouds and precipitation are almost certainly dependent on the regimes. Thus, it is necessary to focus on a specific regime while investigating ACPI, especially for deep convection. It should be remarked that the regime includes not only meteorological factors, but also orography, land use types, and the other aspects of the environment.
Afternoon thunderstorms are locally and diurnally developed deep convection.
Even if significant synoptic-scale weather forcing is absent, the development of afternoon thunderstorms can still be fueled by the surface heat flux (including sensible heat and latent heat), and be affected by the flow pattern of local circulation. Since solar heating and corresponding surface heat flux are stronger on the mountain ridges, topography could influence the development of the afternoon thunderstorms. Several studies have highlighted the importance of topography in the afternoon thunderstorms in Taiwan. Kuo and Wu (2019) used idealized CRM simulations to show that the confluent flow of sea breezes coming in from the Keelung River Valley and the Tamsui River Valley could determine the location of initiation and the development of afternoon thunderstorms inside Taipei Basin. Chen et al. (2010) discovered that the formation and maintenance mechanism of an afternoon thunderstorm system over
Snow Mountain Range (SMR) on June 20th, 2000 was related to the lifting of high equivalent potential temperature airflow over the southwestern slope of SMR. Miao and Yang (2020) simulated an afternoon thunderstorm case on June 14th, 2015. They revealed that the channel effect along the Tamsui River Valley intensified the sea breeze and increased moisture transport, providing favorable dynamic and thermodynamic conditions for stronger convection to develop inside Taipei Basin. Thus, with the tight relationship between afternoon thunderstorms and the local environment, especially topography, we postulate that the influence of microphysics perturbation on convection through increasing CCN can be revealed more clearly in these “topographically-locked”
afternoon thunderstorms given similar large-scale weather conditions.
Rosenfeld et al. (2008) proposed that deep convection can be invigorated under the environment with more aerosols. Since the warm rain processes are suppressed, more freezing of cloud droplets are allowed and latent heat release is enhanced above the freezing level. Thus, the deep convection would become stronger and cause more rainfall under a more polluted environment. Grabowski and Morrison (2016) showed that the precipitation can be strengthened by 10% with high CCN concentration based on the simulation of a diurnally developed deep convection case during the Large-Scale Biosphere-Atmosphere (LBA; Avissar and Nobre, 2002) field campaign over the great plain of Amazon (Grabowski et al., 2006). Different from the aerosol invigoration effect,
they suggested that the increase in precipitation was mainly due to a smaller supersaturation below the freezing level. However, the development of diurnally developed deep convection in Taiwan is highly affected by its complex topography, which is not considered in the mechanisms mentioned above. Thus, the aerosol effect on the diurnally developed deep convection over complex topography might not be simply explained by these mechanisms.
Several studies have introduced the aerosol effects on convective precipitation under different orographic regimes. Seo et al. (2020) showed that the upslope geometry could control the precipitation of shallow convective clouds over a bell-shaped mountain by conducting two-dimensional idealized simulations. Yang et al. (2016) discovered that the weakening of mountain-valley circulation due to increasing absorbing aerosols through aerosol-radiation interaction could lead to a reduction in convection and precipitation in Mount Hua, Shaanxi, China. Observations from Dominica Experiment (DOMEX; Smith et al., 2012) field campaign also revealed that aerosols could have impacts on thermally driven orographic clouds and precipitation (Nugent et al., 2016), but the effect of wind and cloud-layer moisture could be more dominant. However, the aerosol effects on diurnally developed deep convection over terrain remain insufficiently discerned. None of the studies mentioned above has explained how aerosols influence the properties of diurnally developed deep convection
with the role of complex topography.
In this study, we focus on how aerosols affect the properties of diurnally developed deep convection under weak synoptic weather regime over complex topography with
the view of the features of precipitating systems. Due to the complicated interactions between convective clouds and their environment, it is challenging to separate the impacts of aerosols from the effects of meteorology on convection simply using observational data (Grabowski, 2018). Thus, semi-realistic large-eddy simulations (LESs) with fine temporal and spatial resolutions are conducted, highlighting the role of topography on the evolution of diurnally developed deep convection. The analyses
based on cloud object connecting and rain cell tracking provide novel and useful insights to the understanding of the responses resulting from increasing aerosols.
Section 2 presents the model description and the experiment setup. The influence of aerosols, serving as CCN, on diurnally developed deep convection over complex
topography are analyzed in Section 3, mainly with the perspective from precipitating systems. Summary and discussion are shown in Section 4, including possible roles of local circulation.
2. Model Description and Semi-Realistic Experiment Setup 2.1. Model Description and General Setup
To understand the interactions between CCN and diurnally developed deep convection over complex topography, the vector vorticity equation cloud-resolving model (VVM) is used in this study. VVM was initially developed by Jung and Arakawa (2008), based on the three-dimensional anelastic vorticity equations. In VVM, the horizontal vorticity is predicted, and the vertical velocity is diagnosed using a three- dimensional elliptic equation. Under this framework, the pressure gradient force is eliminated in the primitive equations, and the buoyancy that drives the vorticity field responds to the surface fluxes directly. Thus, comparing with the models using the traditional terrain-following coordinate approach, local circulation induced by heating differences can be better captured in VVM. The steeper the topography is, the more significant this advantage becomes (Wu et al., 2019).
To investigate the atmospheric processes specifically over Taiwan Island, Wu et al.
(2019) developed a framework of VVM with high-resolution Taiwan topography, named TaiwanVVM. In TaiwanVVM, the implementation of topography is done by the immersed boundary method (Wu and Arakawa, 2011; Chien and Wu, 2016). With this representation approach, mountain waves, orographic precipitation, upslope wind, and the other atmospheric phenomenon related to topography can be reasonably simulated
without having computational problems. The following list shows the physical parameterizations used in TaiwanVVM: Rapid Radiative Transfer Model for GCMs (RRTMG; Iacono et al., 2008) serves as radiation parameterization; surface fluxes are estimated by the flux-profile relationship of Deardorff (1972); eddy viscosity and diffusivity coefficients depending on deformation and stability (Shutts and Gray, 1994) are used in the first-order turbulence closure; Noah land surface model (Noah LSM;
Chen et al., 1996; Chen and Dudhia, 2001) version 3.4.1 is coupled in the model to accord with the feature of Taiwan topography; Predicted Particle Properties (P3;
Morrison and Milbrandt, 2015) is the microphysics scheme utilized in this study, and its details are provided in Appendix A. TaiwanVVM has been applied to evaluate the influence of land-atmosphere interactions on the afternoon thunderstorms in Taiwan (Wu et al., 2019), and the effect of local circulation associated with fog formation at Xitou Valley, Nantou, Taiwan (Hsieh, 2019).
2.2. Experiment Design of Semi-Realistic Simulations
To investigate the influence of CCN on diurnally developed deep convection over complex topography, we carry out semi-realistic LESs with 13 selected cases from the summers (May to September) between 2006 and 2014. The procedure of case selection was carefully designed to find favorable environments of diurnally developed deep
convection, and the details are presented in Appendix B. These simulations were driven by the simplified Banqiao Station soundings at 08:00 Taiwan Standard Time. The initial soundings share several common features that are considered favorable for the afternoon thunderstorms to develop, such as high convective available potential energy (CAPE; larger than 900 J·kg-1), high column water vapor (CWV; greater than 44 mm), and low-level southwesterly flow (Figure 1). These properties represent the high instability of the atmosphere.
For these 13 cases, both the clean and the normal scenarios were simulated. The aerosol number mixing ratio under the clean scenario was 3×10⁸ kg-1, which was within
the range of the clean conditions in the marine environment (Andreae, 2010; Whitby,
1978). On the other hand, the aerosol number mixing ratio increased to 3×10¹⁰ kg-1 under the normal scenario, which lay in the range of the urban environment of Taipei
City (Lin, 2012). The range of aerosol concentration between these two scenarios is sensitive for the aerosol to affect CCN (Tao et al., 2012; Ramanathan et al., 2001). In the simulations, the chemical properties of aerosols are set as ammonium sulfate, and
the size distribution of aerosols follows a lognormal size distribution, with a mean size of 0.05 μm (Morrison and Milbrandt, 2015).
For the experiments, the horizontal resolution was 500 m. The total vertical layers were 70 with the vertical resolution being 100 m from the sea level up to 3900 m, and
a stretched grid above 3900 m up to about 19260 m (Krueger, 1988). The domain was 512 km × 512 km in size and its lateral boundary was double periodic. To avoid the domain boundary being cut at the edge of complex topography on Taiwan Island, which could potentially induce problems from the inflow outside the domain, the entire Taiwan Island with its surrounding seas were covered in the domain. The topography of adjacent islands around Taiwan was not implemented in the model. The center of the domain was set around Mount Jade, the highest mountain in Taiwan (Figure 2). The sea surface temperature was prescribed as the temperature of the lowest level of the initial sounding. To drive Noah LSM, land properties were necessary for model inputs. The daily averaged soil moisture over Taiwan Island from the Global Land Data Assimilation System (GLDAS; Rodell et al., 2004) version 2.0 was assigned to the topsoil layers for all land grids in the model. The initial settings of terrain elevation, slope type, land use, green vegetation fraction, and soil texture were the same as in Wu et al. (2019). Other detailed settings are provided in Table 1.
3. Simulation Results
In this section, we would first introduce the region where this research is focusing.
Besides the overall analyses which provide first-order identification of the precipitation properties, cloud object connecting and rain system tracking analyses serve as advanced evaluating tools for examining the convection properties throughout the life cycle of the diurnal precipitating systems.
Figure 3 shows the composite precipitation of all 13 cases under different CCN
concentration scenarios on Taiwan Island. When CCN concentration rises, the area of precipitation shrinks by 20%, while the area of precipitation greater than 40 mm increases by 2.8 times. These precipitation hotspots are located in the mountain areas
on Taiwan Island. The most significant precipitation hotspot situates around Alishan Mountain Range (AMR, the red box in Figure 3), along with other hotspots including the northern tip of Central Mountain Range (CMR) and the western slope of SMR. This precipitation pattern corresponds with the observational climatology shown in Lin et al.
(2011). Thus, we focus on the AMR region for the following analyses to emphasize the influence of CCN on diurnally developed deep convection over complex topography.
Figure 4 illustrates the topographic map and the three-dimensional terrain of the AMR region. The Chenyoulan River and the Qingshui River, the tributaries of the Zhoushui River, are located in the north of the AMR region. The Qishan River and the Laonong
River, the tributaries of the Gaoping River, flow through the south of the AMR region.
These rivers are the potential debris flow torrents when heavy precipitation occurs. Both the longest river and the largest river by drainage area in Taiwan appear in the AMR region, and the highest mountain in Taiwan, Mount Jade, also situates here, showing the orographic complexity in this region.
3.1. Overall Results
We identify two different types of precipitation patterns by the AMR regional-
averaged rain rate evolution of every case (Figure 5). The STRONG type (6 cases) has the maximum regional-averaged rain rate greater than 4 mm·hr-1, while the other 7 cases that fail to pass this threshold are categorized as the WEAK type. Increasing CCN could lead to either ascent or descent in the regional-averaged rain rate for both the STRONG and the WEAK type. Thus, it is challenging to identify the influence of CCN solely from the regional-averaged rain rate.
Figure 6 shows the composite precipitation in the AMR region under different CCN
concentration scenarios and for different types of precipitation patterns. The precipitation hotspots tend to locate in the mountain ridges, while the composite precipitation in the river valleys is relatively low. Especially for the STRONG type, the precipitation in the Chenyoulan River Valley and the Laonong River Valley is less than
adjacent mountain ridges. For the STRONG type, the area of precipitation being greater than 40 mm expands and gathers under the normal scenario. On the other hand, for the WEAK type, increasing CCN has little effect on the composite precipitation pattern, still being less than 40 mm even when CCN concentration rises. The area in which the composite precipitation being greater than 15 mm even shrinks under the normal scenario.
Figure 7 illustrates the composite initiation time of precipitation in the AMR region.
In general, the initiation time of precipitation delays when CCN concentration increases.
The area with initiation time of precipitation earlier than noon shrinks, and that later than 18:00 expands. The initiation time of precipitation is also related to the terrain, which starts earlier on the mountain ridges and later in the river valleys. This phenomenon is more significant around Chenyoulan River Valley for the STRONG type, and around Laonong River Valley for the WEAK type. The result indicates that even under the same topography and similar atmospheric environment, the relationship between the terrain and the diurnal precipitation could be different considering the strength of precipitation.
3.2. Object-based Tracking Analyses
To examine the impact of CCN on diurnally developed deep convection based on
the properties of each convective system, object-based tracking analyses are conducted,
combining cloud object connecting and rain cell tracking algorithms. The six-connected segmentation method, proposed by Tsai and Wu (2017), connects horizontally and vertically adjacent cloudy grid boxes as the same cloud object, and its details are given in Appendix C. In this study, only the convective clouds are analyzed, whose cloud base height is lower than 0.5 km, cloud depth is thicker than 1.0 km, and center of cloud mass is higher than 0.5 km. The iterative rain cell tracking (IRT; Moseley et al., 2019) links rain cells at each time step and forms the rain tracks of precipitating systems. IRT provides a Lagrangian framework focusing on the life cycle of precipitating systems, and its details are provided in Appendix D. By co-locating the rain cells with the cloud objects overhead, the evolution of the diurnal precipitating systems would be completed (Appendix E).
Figure 8 provides the numbers of rain tracks identified under different CCN
concentration scenarios and for different types of precipitation patterns. Under the clean scenario, the total number of rain tracks for the WEAK type is almost 1.5 times of that for the STRONG type. However, the total number of rain tracks for the two types are about the same amount under the normal scenario. Increasing CCN leads to a decline in the rain tracks for both types. For the WEAK type, the reduction is nearly 35%, which is much higher than that for the STRONG type (about 10%). The rain tracks that can
only produce light rain rates are the majorities of the reduction. Especially for the WEAK type, the rain tracks that can only produce rain rates lighter than 20 mm·hr-1 decreases for about 50% when CCN concentration increases. Since the influence of CCN is mainly on the rain tracks with light rain rates, it might explain why CCN concentration has less effect on the composite precipitation for the WEAK type (Figure 6c and Figure 6d).
Figure 9 illustrates the probability density function of the clouds with various maximum rain rates. For the STRONG type, the probability of heavy rain rates is notably higher under the normal scenario. On the other hand, the increase in the probability of heavy rain rates due to rising CCN is less noticeable for the WEAK type.
Furthermore, the decrease in the probability of light rain rates (less than 20 mm·hr-1) resulting from increasing CCN is more symbolic for the WEAK type. The size of the circles in Figure 9 represents the critical cloud size (CCS), defined as the minimum
cloud size that can produce the corresponding rain rate (Tsai and Wu, 2017). For the STRONG type, increasing CCN generally leads to larger CCS for heavy rain rates, representing that the clouds have to grow larger to produce the same rain rate under the normal scenario.
Figure 10 shows the rain contribution of the rain tracks with different maximum
rain rates. For the STRONG type, more than half of total precipitation is furnished by
the rain tracks with maximum rain rate heavier than 100 mm·hr-1. Furthermore, the rain
tracks with the ability to precipitate heavier than 130 mm·hr-1 provide about 15% of total precipitation under the clean scenario and increases to more than 40% when CCN concentration rises. On the other hand, the rain contribution from the rain tracks with
maximum rain rate heavier than 130 mm·hr-1 is lower than 10% for the WEAK type, regardless of CCN concentration. This result reveals that the rain contribution from the
extreme rain rates increases with CCN concentration for the STRONG type, while it is
less affected by CCN concentration for the WEAK type.
We have learned that the initiation time of precipitation can be influenced by CCN from the previous composite results (Figure 7), and thus we further examine the timing of the rain tracks, displayed in Figure 11. The initiation time is about the same under the clean scenario for the two types and it generally lies between 13:00 and 17:00.
Increasing CCN leads to a significant delay in both the initiation time and the ending time. The delay for the STRONG type is about an hour, which is longer than that for the WEAK type (about 20 minutes). The duration of the rain tracks usually keeps within an hour and is less affected by CCN. Although only less than 5% of the rain tracks could survive for more than 3 hours, the extreme rain tracks could last for almost 12 hours.
Thus, the mean of the duration is about the same as the 3rd quartile.
Figure 12 demonstrates the statistics of the maximum rain rate and the maximum
rain area during the lifetime of the rain tracks, representing the strength of precipitation in the mature stage of the diurnal precipitating systems. Increasing CCN leads to a significantly larger mean maximum rain rate for the WEAK type. On the other hand, for the STRONG type, although increasing CCN leads to a less significant increment in the mean maximum rain rate, the enhancement in the 99th percentile (P99) of the maximum rain rate is about 22.1 mm·hr-1, which is 2.5 times higher than that for the WEAK type (8.8 mm·hr-1). The means of the maximum rain area are around 25 km2
under different CCN concentration scenarios and for different types of precipitation
patterns. Nevertheless, the P99 of the maximum rain area for the STRONG type expands from 876 km2 to 1073 km2 when CCN concentration increases, while that for the WEAK type remains around 275 km2. The extreme values of the maximum rain rate and the maximum rain area increase with increasing CCN for the STRONG type. This result reveals that the rise of CCN concentration strengthens the extreme precipitation for the diurnal precipitating systems which are already more intense than the others.
By co-locating the rain cells with the cloud objects overhead (Appendix E), the statistics of the maximum cloud depth and the maximum cloud size during the lifetime of the rain tracks are presented in Figure 13, representing the strength of cloud development in the mature stage of the diurnal precipitating systems. Increasing CCN leads to a significantly larger mean maximum cloud depth and cloud size for both the
STRONG and the WEAK type. However, it is more evident for the STRONG type that the majority of the clouds become thicker and larger when CCN concentration rises.
The interquartile range (IQR) of the maximum cloud depth decreases by 7.0 km, and the 1st quartile (Q1) of the maximum cloud depth surges from 6.9 km to 14.9 km under the normal scenario. Also, the IQR of the maximum cloud size reduces by 5.5×10³ km3,
and the Q1 of the maximum cloud size rises from 6.7×10³ km3 to 11.8×10³ km3 under the normal scenario. On the other hand, for the WEAK type, CCN concentration has less effect on the IQR and the Q1 of the maximum cloud depth and the maximum cloud size. The result indicates that the rise of CCN also enhances the growth of clouds being more well-developed than the others, viewed from the macro-scale cloud properties of the diurnal precipitating systems.
Figure 14 gives the statistics of the maximum in-cloud vertical velocity and the maximum core ratio during the lifetime of the rain tracks, representing the cloud dynamical features in the mature stage of the precipitating systems. The core ratio is defined as the proportion of the clouds with a vertical velocity larger than 0.5 m·s-1, representing the updraft region. Increasing CCN leads to a narrower distribution of vertical velocity, a stronger upward motion, and a relatively smaller core ratio. This phenomenon is more compelling for the STRONG type: the IQR of the maximum vertical velocity declines from 18.3 m·s-1 to 14.0 m·s-1, the mean maximum vertical
velocity rises significantly from 21.1 m·s-1 to 24.6 m·s-1, and the mean maximum core ratio decreases from 44% to 37%. As for the WEAK type, the IQR of the maximum vertical velocity declines from 10.6 m·s-1 to 9.0 m·s-1, the mean maximum vertical velocity rises slightly from 15.3 m·s-1 to 16.7 m·s-1, and the mean maximum core ratio decreases marginally from 46% to 43%. The result reveals that the updraft regions of the more severe diurnal precipitating systems are more concentrated and more vigorous under the normal scenario.
In conclusion, when CCN concentration is higher, the diurnal precipitating systems with greater ability to produce heavy rain rates have a higher probability to occur, tend to develop into larger sizes, and are more responsible for total precipitation. Also, from
the rain properties, cloud macro-scale characteristics, and cloud dynamical features of the diurnal precipitating systems, a “strong get stronger” response is identified with
increasing CCN concentration.
4. Summary and Discussion
In this study, the impact of CCN on the diurnally developed deep convection over complex topography in Taiwan is investigated, specifying the meteorological regime
of weak synoptic-scale weather forcing. TaiwanVVM, a framework of VVM with high- resolution Taiwan terrain, was applied to resolve fine-scale atmospheric processes over complex topography. We selected 13 cases to perform semi-realistic LESs, in which both the clean and the normal scenarios were simulated. Object-based tracking analyses
are conducted, providing novel and useful insights to the understanding of the responses resulting from increasing CCN to the diurnally developed deep convection.
The regime-dependence essence of ACPI depicted in Stevens and Feingold (2009) was mainly focused on clouds and their environments. Here, we propose that the orographic regime is also crucial. We focus on the most significant hotspot of the composite precipitation on Taiwan Island, the AMR region, for our analyses, which further emphasizes the role of complex topography. In the AMR region, we identify two different types of precipitation patterns by the regional-averaged rain rate evolution:
the STRONG type and the WEAK type. The composite precipitation in the AMR region mainly occurs over the mountain ridges. For the STRONG type, increasing CCN leads to an expansion in the area of heavy precipitation. The composite initiation time of precipitation shows an earlier start of precipitation over the mountain ridges and later
in the river valleys. These overall results demonstrate the first-order relationship between the precipitation and the topography, and highlight that increasing CCN could have different responses on diurnally developed deep convection over complex topography, depending on the strength of convective precipitation.
The cloud object analyses provide further information on the differences between the two types of precipitation patterns. For the STRONG type, increasing CCN leads to
a notably higher probability of occurrence of the clouds that can produce heavy rain rates, while the probability of those clouds is less affected by CCN concentration for
the WEAK type. Rain cell tracking analyses present additional characteristics for the two types of precipitation patterns from the perspective of the life cycle of the diurnal precipitating systems. For the STRONG type, increasing CCN leads to a larger total
rain contribution from the diurnal precipitating systems that can produce heavy rain rates, while the total rain contribution from those diurnal precipitating systems is less
affected by CCN concentration for the WEAK type. Increasing CCN delays the initiation and the ending time of the diurnal precipitating systems, especially for the STRONG type. Furthermore, for the STRONG type, the maximum rain rate, rain area, cloud depth, and cloud size during the lifetime of the diurnal precipitating systems become considerably stronger when CCN concentration rises. Increasing CCN also results in more concentrated and more vigorous updraft regions in the clouds for the
STRONG type. These results reveal a significant “strong get stronger” response to the diurnal precipitating systems when CCN concentration increases, viewed from the perspective of rain properties, cloud macro-scale characteristics, and cloud dynamical
features (Figure 15).
The difference between the two types of precipitation patterns might result from
the upstream wind field of the AMR region. Figure 16b and Figure 16c demonstrate the local circulation one hour before the initiation of precipitation in the mountain part of the blue box in Figure 16a under the clean scenario on July 7th, 2009 (a case belonged to the STRONG type) and on July 21st, 2006 (a case affiliated with the WEAK type).
The local circulation before the initiation of precipitation on July 7th, 2009 is weaker than that on July 21st, 2006. The average near-coast low-level southwesterly one hour
before the initiation of precipitation for all 13 cases are listed in Table 2. The result reveals that the near-coast low-level southwesterly before the initiation of precipitation is generally weaker (less than 1.5 m·s-1) for the STRONG type (also shown in Figure 15 by the purple translucent arrows). Figure 17 illustrates the local circulation 10
minutes before the initiation of precipitation in the mountain part of the blue box in Figure 16a on July 7th, 2009 under different CCN concentration scenarios. Increasing CCN delays the initiation of precipitation, which prevents the local circulation from being disturbed by the convection and allows the local circulation to be further
intensified. Thus, when CCN concentration rises, the strength of the convection could be stronger owing to the maintenance and development of local circulation.
Table 2 also shows that the low-level southwesterly of the initial sounding is
generally weaker for the STRONG type. Although experiencing several hours of
evolution, the near-coast low-level southwesterly before the initiation of precipitation is still related to the initial sounding. Once this relationship is further confirmed, sensitivity tests on the initial low-level southwesterly should provide further information on the relationship between the intensity of terrain-related local circulation and the strength of diurnal precipitation. Among all 13 cases, June 29th, 2010 (a case being categorized as the WEAK type) is the case with the maximum regional-averaged
rain rate closest to 4 mm·hr-1, and has the weakest near-coast low-level southwesterly
before the initiation of precipitation among the 7 cases of the WEAK type, indicating that it bears marginal features of the two types of precipitation patterns and could be the suitable candidate to conduct the sensitivity tests.
In this study, 13 semi-realistic LESs serve as an ensemble of simulations. Although the initial atmospheric conditions bear some common features, including high CAPE, high CWV, and low-level southwesterly flow, they are still distinct from each other.
Other factors could affect the development of the diurnally developed deep convection as well, including low-level moisture (Lin et al., 2011), the depth of southwesterly flow,
and temperature inversion. To minimize the complication from meteorological factors, idealized simulations could be practiced. A composite summertime sounding, such as the one provided in Chen et al. (2009), could be adopted as the initial condition for the idealized simulations. Thus, the influence of CCN on the diurnally developed deep convection over complex topography could be investigated without other disturbances of meteorology.
Comparing to the analyses simply based on regional averaging, the influence of CCN on the diurnally developed deep convection over complex topography can be more precisely identified by object-based tracking analyses. Besides the AMR region, object-based tracking analyses can be applied to other precipitation hotspots in Taiwan as well. Complex topography also appears in these regions, including the northern tip of CMR and the western slope of SMR (Figure 3). Object-based tracking analyses can also be practiced when studying how increasing CCN affects the diurnally developed deep convection on the other islands with complex topography, such as Maritime Continent (Hodzic and Duvel, 2018; Lee and Wang 2020). Overall, we consider object- based tracking analyses as useful diagnostic packages when investigating the diurnally developed deep convection over complex topography.
References
Andreae, M. O. 2009. Correlation between Cloud Condensation Nuclei Concentration and Aerosol Optical Thickness in Remote and Polluted Regions. Atmospheric Chemistry and Physics 9(2): 543–556. https://doi.org/10.5194/acp-9-543-2009 Avissar, R., and C. A. Nobre. 2002. Preface to special issue on the Large‐Scale
Biosphere‐Atmosphere Experiment in Amazonia (LBA). Journal of Geophysical Research: Atmospheres 107(D20): 8034. https://doi.org/10.1029/2002JD002507 Chen, C.-S., C.-L. Liu, M.-C. Yen, C.-Y. Chen, P.-L. Lin, C.-Y. Huang, and J.-H. Teng.
2010. Terrain Effects on an Afternoon Heavy Rainfall Event, Observed over Northern Taiwan on 20 June 2000 during Monsoon Break. Journal of the Meteorological Society of Japan 88(4): 649–671.
https://doi.org/10.2151/jmsj.2010-403
Chen, F., and J. Dudhia. 2001. Coupling an Advanced Land Surface–Hydrology Model with the Penn State–NCAR MM5 Modeling System. Part I: Model Implementation and Sensitivity. Monthly Weather Review 129(4): 569–585.
https://doi.org/10.1175/1520-0493(2001)129<0569:CAALSH>2.0.CO;2
———, K. Mitchell, J. Schaake, Y. Xue, H.-L. Pan, V. Koren, Q. Y. Duan, M. Ek, and A. Betts. 1996. Modeling of Land Surface Evaporation by Four Schemes and Comparison with FIFE Observations. Journal of Geophysical Research:
Atmospheres 101(D3): 7251–7268. https://doi.org/10.1029/95JD02165
Chen, G. T.-J., H.-C. Chou, P.-C. Liao, and J.-S. Yang. 2009. Study on the Warm Season Afternoon Convection over Northern and Central Taiwan. Atmospheric Sciences 37(2): 155–194. (In Chinese with English abstract)
Chien M.-H., and C.-M. Wu. 2016. Representation of Topography by Partial Steps Using the Immersed Boundary Method in a Vector Vorticity Equation Model (VVM). Journal of Advances in Modeling Earth Systems 8(1): 212–223.
https://doi.org/10.1002/2015MS000514
Deardorff, J. W. 1972. Parameterization of the Planetary Boundary Layer for Use in General Circulation Models. Monthly Weather Review 100(2): 93–106.
https://doi.org/10.1175/1520-0493(1972)100<0093:POTPBL>2.3.CO;2
Fan J., Y. Wang, D. Rosenfeld, and X. Liu. 2016. Review of Aerosol–Cloud Interactions:
Mechanisms, Significance, and Challenges. Journal of the Atmospheric Sciences
Grabowski, W. W. 2018. Can the Impact of Aerosols on Deep Convection be Isolated from Meteorological Effects in Atmospheric Observations? Journal of the Atmospheric Sciences 75(10): 3347–3363.
https://doi.org/10.1175/JAS-D-18-0105.1
———, P. Bechtold, A. Cheng, R. Forbes, C. Halliwell, M. Khairoutdinov, S. Lang, T.
Nasuno, J. Petch, W.‐K. Tao, R. Wong, X. Wu, and K.‐M. Xu. 2006. Daytime Convective Development over Land: A Model Intercomparison Based on LBA Observations. Quarterly Journal of the Royal Meteorological Society 132(615):
317–344. https://doi.org/10.1256/qj.04.147
———, and H. Morrison. 2016. Untangling Microphysical Impacts on Deep Convection Applying a Novel Modeling Methodology. Part II: Double-Moment Microphysics. Journal of the Atmospheric Sciences 73(9): 3749–3770.
https://doi.org/10.1175/JAS-D-15-0367.1
Hodzic, A., and J. P. Duvel. 2018. Impact of Biomass Burning Aerosols on the Diurnal Cycle of Convective Clouds and Precipitation over a Tropical Island. Journal of Geophysical Research: Atmospheres 123(2): 1017–1036.
https://doi.org/10.1002/2017JD027521
Hsieh, M.-K. 2019. Effects of Orographically Induced Low-Level Moisture Convergence and Inversion Strength on Upslope Fog: A Case Study at Xitou.
Master’s thesis, Department of Atmospheric Sciences, National Taiwan University, Taipei, Taiwan. https://doi.org/10.6342/NTU201900872
Huang, J.-D., and C.-M. Wu. 2020. Effects of Microphysical Processes on the Precipitation Spectrum in a Strongly Forced Environment. Earth and Space Science 7: e2020EA001190. https://doi.org/10.1029/2020EA001190
Iacono, M. J., J. S. Delamere, E. J. Mlawer, M. W. Shephard, S. A. Clough, and W. D.
Collins. 2008. Radiative Forcing by Long‐Lived Greenhouse Gases: Calculations with the AER Radiative Transfer Models. Journal of Geophysical Research:
Atmospheres 113(D13): D13103. https://doi.org/10.1029/2008JD009944
Jung, J.-H., and A. Arakawa. 2008. A Three-Dimensional Anelastic Model Based on the Vorticity Equation. Monthly Weather Review 136(1): 276–294.
https://doi.org/10.1175/2007MWR2095.1
Khvorostyanov, V. I., and J. A. Curry. 2006. Aerosol Size Spectra and CCN Activity
Geophysical Research: Atmospheres 111(D12): D12202.
https://doi.org/10.1029/2005JD006532
Krueger, S. K. 1988. Numerical Simulation of Tropical Cumulus Clouds and Their Interaction with the Subcloud Layer. Journal of the Atmospheric Sciences 45(16):
2221–2250.
https://doi.org/10.1175/1520-0469(1988)045<2221:NSOTCC>2.0.CO;2
Kuo, K.-T., and C.-M. Wu. 2019. The Precipitation Hotspots of Afternoon Thunderstorms over the Taipei Basin: Idealized Numerical Simulations. Journal of the Meteorological Society of Japan 97(2): 501–517.
https://doi.org/10.2151/jmsj.2019-031
Lee, H.-H., and C. Wang. 2020. The Impacts of Biomass Burning Activities on Convective Systems over the Maritime Continent. Atmospheric Chemistry and Physics 20(4): 2533–2548. https://doi.org/10.5194/acp-20-2533-2020
Lin, P.-F., P.-L. Chang, B. J.-D. Jou, J. W. Wilson, and R. D. Roberts. 2011. Warm Season Afternoon Thunderstorm Characteristics under Weak Synoptic-Scale Forcing over Taiwan Island. Weather and Forecasting 26(1): 44–60.
https://doi.org/10.1175/2010WAF2222386.1
Lin, W.-T. 2012. A Study of the Cloud Condensation Nuclei (CCN) Activity for Urban Ambient Aerosols. Master’s thesis, Department of Atmospheric Sciences, National Taiwan University, Taipei, Taiwan. https://doi.org/10.6342/NTU.2012.01002 Miao, J.-E., and M.-J. Yang. 2020. A Modeling Study of the Severe Afternoon
Thunderstorm Event at Taipei on 14 June 2015: The Roles of Sea Breeze, Microphysics, and Terrain. Journal of the Meteorological Society of Japan 98(1):
129–152. https://doi.org/10.2151/jmsj.2020-008
Morrison, H., and J. A. Milbrandt. 2015. Parameterization of Cloud Microphysics Based on the Prediction of Bulk Ice Particle Properties. Part I: Scheme Description and Idealized Tests. Journal of the Atmospheric Sciences 72(1): 287–311.
https://doi.org/10.1175/JAS-D-14-0065.1
———, and W. W. Grabowski. 2007. Comparison of Bulk and Bin Warm-Rain Microphysics Models Using a Kinematic Framework. Journal of the Atmospheric Sciences 64(8): 2839–2861. https://doi.org/10.1175/JAS3980
———, and ———. 2008. Modeling Supersaturation and Subgrid-scale Mixing with
65(3): 792–812. https://doi.org/10.1175/2007JAS2374.1
Moseley, C., P. Berg, and J. O. Haerter. 2013. Probing the Precipitation Life Cycle by Iterative Rain Cell Tracking. Journal of Geophysical Research: Atmospheres 118(24): 13361–13370. https://doi.org/10.1002/2013JD020868
———, O. Henneberg, and J. O. Haerter. 2019. A Statistical Model for Isolated Convective Precipitation Events. Journal of Advances in Modeling Earth Systems 11(1): 360–375. https://doi.org/10.1029/2018MS001383
Nugent, A. D., C. D. Watson, G. Thompson, and R. B. Smith. 2016. Aerosol Impacts on Thermally Driven Orographic Convection. Journal of the Atmospheric Sciences, 73(8): 3115–3132. https://doi.org/10.1175/JAS-D-15-0320.1
Ramanathan, V., P. J. Crutzen, J. T. Kiehl, and D. Rosenfeld. 2001. Aerosols, Climate, and the Hydrological Cycle. Science 294(5549): 2119–2124.
https://doi.org/10.1126/science.1064034
Rodell, M., P. R. Houser, U. Jambor, J. Gottschalck, K. Mitchell, C.-J. Meng, K.
Arsenault, B. Cosgrove, J. Radakovich, M. Bosilovich, J. K. Entin, J. P. Walker, D.
Lohmann, and D. Toll. 2004. The Global Land Data Assimilation System. Bulletin of the American Meteorological Society 85(3): 381–394.
https://doi.org/10.1175/BAMS-85-3-381
Rosenfeld, D., U. Lohmann, G. B. Raga, C. D. O’Dowd, M. Kulmala, S. Fuzzi, A.
Reissell, and M. O. Andreae. 2008. Flood or Drought: How Do Aerosols Affect Precipitation? Science 321(5894): 1309–1313.
https://doi.org/10.1126/science.1160606
Seo, J. M., H. Lee, S. Moon, and J.-J. Baik. 2020. How Mountain Geometry Affects Aerosol-Cloud-Precipitation Interactions: Part I. Shallow Convective Clouds.
Journal of the Meteorological Society of Japan 98(1): 43–60.
https://doi.org/10.2151/jmsj.2020-003
Shutts, G. J., and M. E. B. Gray. 1994. A Numerical Modelling Study of the Geostrophic Adjustment Process Following Deep Convection. Quarterly Journal of the Royal Meteorological Society 120(519): 1145–1178.
https://doi.org/10.1002/qj.49712051903
Smith, R. B., J. R. Minder, A. D. Nugent, T. Storelvmo. D. J. Kirshbaum, R. Warren, N.
Lareau, P. Palany, A. James, and J. French. 2012. Orographic Precipitation in the
Society 93(10): 1567–1579. https://doi.org/10.1175/BAMS-D-11-00194.1
Stevens, B., and G. Feingold. 2009. Untangling Aerosol Effects on Clouds and Precipitation in a Buffered System. Nature 461: 607–613.
https://doi.org/10.1038/nature08281
Su, S.-H., J.‐L. Chu, T.‐S. Yo, and L.‐Y. Lin. 2018. Identification of Synoptic Weather Types over Taiwan Area with Multiple Classifiers. Atmospheric Science Letters 19(12): e861. https://doi.org/10.1002/asl.861
Tao, W.-K., J.-P. Chen, Z. Li, C. Wang, and C. Zhang. 2012. Impact of Aerosols on Convective Clouds and Precipitation. Reviews of Geophysics 50(2): RG2001.
https://doi.org/10.1029/2011RG000369
Tsai, W.-M., and C.-M. Wu. 2017. The Environment of Aggregated Deep Convection.
Journal of Advances in Modeling Earth Systems 9(5): 2061–2078.
https://doi.org/10.1002/2017MS000967
Whitby, K. T. 1978. The Physical Characteristics of Sulfur Aerosols. Atmospheric Environment 12(1–3): 135–139. https://doi.org/10.1016/0004-6981(78)90196-8 Wu, C.-M., and A. Arakawa. 2011. Inclusion of Surface Topography into the Vector
Vorticity Equation Model (VVM). Journal of Advances in Modeling Earth Systems 3(2): M04002. https://doi.org/10.1029/2011MS000061
———, H.-C. Lin, F.-Y. Cheng, and M.-H. Chien. 2019. Implementation of the Land Surface Processes into a Vector Vorticity Equation Model (VVM) to Study its Impact on Afternoon Thunderstorms over Complex Topography in Taiwan. Asia- Pacific Journal of Atmospheric Sciences 55: 701–717.
https://doi.org/10.1007/s13143-019-00116-x
Yang, Y., J. Fan, L. R. Leung, C. Zhao, Z. Li, and D. Rosenfeld. 2016. Mechanisms Contributing to Suppressed Precipitation in Mt. Hua of Central China. Part I:
Mountain Valley Circulation. Journal of the Atmospheric Sciences 73(3): 1351–
1366. https://doi.org/10.1175/JAS-D-15-0233.1
Figures
Figure 1. Vertical profiles of the initial environmental conditions presented by Skew-T log-P diagrams. These profiles are adapted from the observational soundings of Central Weather Bureau Banqiao Station (World Meteorological Organization station number 46692) at 08:00 Taiwan Standard Time. The blue and the red lines represent temperature and dew point temperature, respectively. The red and blue translucent shading areas represent the positive areas and the negative areas, respectively. High convective available potential energy (greater than 900 J·kg-1), high column water vapor (greater than 44 mm), and low-level southwesterly are common features shown in these profiles.
Figure 1. Continued.
Figure 2. The domain of TaiwanVVM and its terrain height. The center of the domain is set around Mount Jade, the highest mountain on Taiwan Island.
Figure 3. The composite precipitation of all 13 cases under (a) the clean scenario and (b) the normal scenario on Taiwan Island. The red box represents the Alishan Mountain Range region, which is the most significant precipitation hotspot and the region where this research is focusing.
Figure 4. (a) The topographic map and (b) the three-dimensional terrain of the Alishan Mountain Range region. Several major drainage systems in Taiwan are located in this region, including the Chenyoulan River, the Qingshui River, the Qishan River, and the Laonong River. The Zengwen Reservoir and the Nanhua Reservoir, the main reservoirs that support the water consumption of southern Taiwan, are situated in this region as well.
Figure 5. The Alishan Mountain Range regional-averaged rain rate evolution from 08:00 to 20:00 for (a) the STRONG type (6 cases) and (b) the WEAK type (7 cases).
The blue and the red lines represent the clean and the normal scenarios, respectively.
Figure 6. The composite total precipitation in the Alishan Mountain Range region for (a) STRONG/clean, (b) STRONG/normal, (c) WEAK/clean, and (d) WEAK/normal situations. The terrain height is presented by the hatching.
Figure 7. The composite initiation time of precipitation in the Alishan Mountain Range region for (a) STRONG/clean, (b) STRONG/normal, (c) WEAK/clean, and (d) WEAK/normal situations. The terrain height is presented by the hatching.
Figure 8. The number of the rain tracks by different maximum rain rate during their lifetime for (a) the STRONG type and (b) the WEAK type. The blue translucent bars and the red-edge hollow bars represent the clean and the normal scenarios, respectively.
Figure 9. The probability density functions of the clouds with various maximum rain rates for (a) the STRONG type and (b) the WEAK type, along with the critical cloud size. The critical cloud size is defined as the minimum cloud size that can produce the corresponding rain rate, presented by the size of the hollow dots. The blue and the red dots represent the clean and the normal scenarios, respectively.
Figure 10. The rain contribution of the clouds with different maximum rain rates for (a) the STRONG type and (b) the WEAK type, presented by the cumulative density functions. The blue and the red lines represent the clean and the normal scenarios, respectively.
Figure 11. The box-whisker plots of (a) the initiation time, (b) the ending time, and (c) the duration of the rain tracks. The red and the blue boxes represent the clean and the normal scenarios, respectively. The upper edge, the middle line, and the lower edge of a box represent the 3rd quartile, the median, and the 1st quartile, respectively.
The dot represents the mean. The upper and the lower tip of a whisker represents the maximum and the minimum value. The significance of the difference of the means is shown by the asterisks: ** indicates a p-value smaller than 0.01, while * indicates a p- value smaller than 0.05.
Figure 12. The box-whisker plots of (a) the maximum rain rate and (b) the maximum rain area (shown by effective radius r = √𝐴 𝜋⁄ ) during the lifetime of the rain tracks.
The blue and the red boxes represent the clean and the normal scenarios, respectively.
The upper edge, the middle line, and the lower edge of a box represent the 3rd quartile, the median, and the 1st quartile, respectively. The dot represents the mean. The upper and the lower tip of a whisker represent the 99th percentile and the 1st percentile, respectively. The significance of the difference of the means is shown by the asterisks:
** indicates a p-value smaller than 0.01, while * indicates a p-value smaller than 0.05.
Figure 13. The box-whisker plots of (a) the maximum cloud depth and (b) the maximum cloud size (shown by effective radius r = √3𝑉 4𝜋3 ⁄ ) during the lifetime of the rain tracks. The details are the same as Figure 12.
Figure 14. The box-whisker plots of (a) the maximum in-cloud vertical velocity and (b) the maximum core ratio during the lifetime of the rain tracks. The core ratio is defined as the proportion of the clouds with a vertical velocity greater than 0.5 m·s-1, indicating the updraft region. The details are the same as Figure 12.